

PROBLEM SET B
Problem 21-1B (25 minutes)
Parts 1 and 2
Gilmore Company
Contribution Margin Income Statement
For Year Ended December 31, 2013
(12,000 units) Per unit % of sales
Sales ($18 x 12,000) ………………….…….
$216,000
$18.000
100.00%
Variable costs
Plastic for CD sets ………………….…….
$ 1,500
$0.125
Assembly worker wages …………..…….
30,000
2.500
Labeling ……………………………….…….
3,000
0.250
Sales commissions ………………..…….
6,000
40,500
0.500
3.375
18.75%
Contribution margin ……………………….
$14.625
Fixed costs
4,520
20,000
15,000
Income tax (25%) ……………………….….
Net income ………………………………..…….
$ 6,135
Part 3 Analysis Component
Contribution margin shows how much of total sales are available to cover
fixed costs and contribute to operating income. This is why the title for this

Fundamental Accounting Principles, 21st Edition
1246
Problem 21-2B (40 minutes)
Part 1
(a) Instructor note: Use the equation in Exhibit 21.11
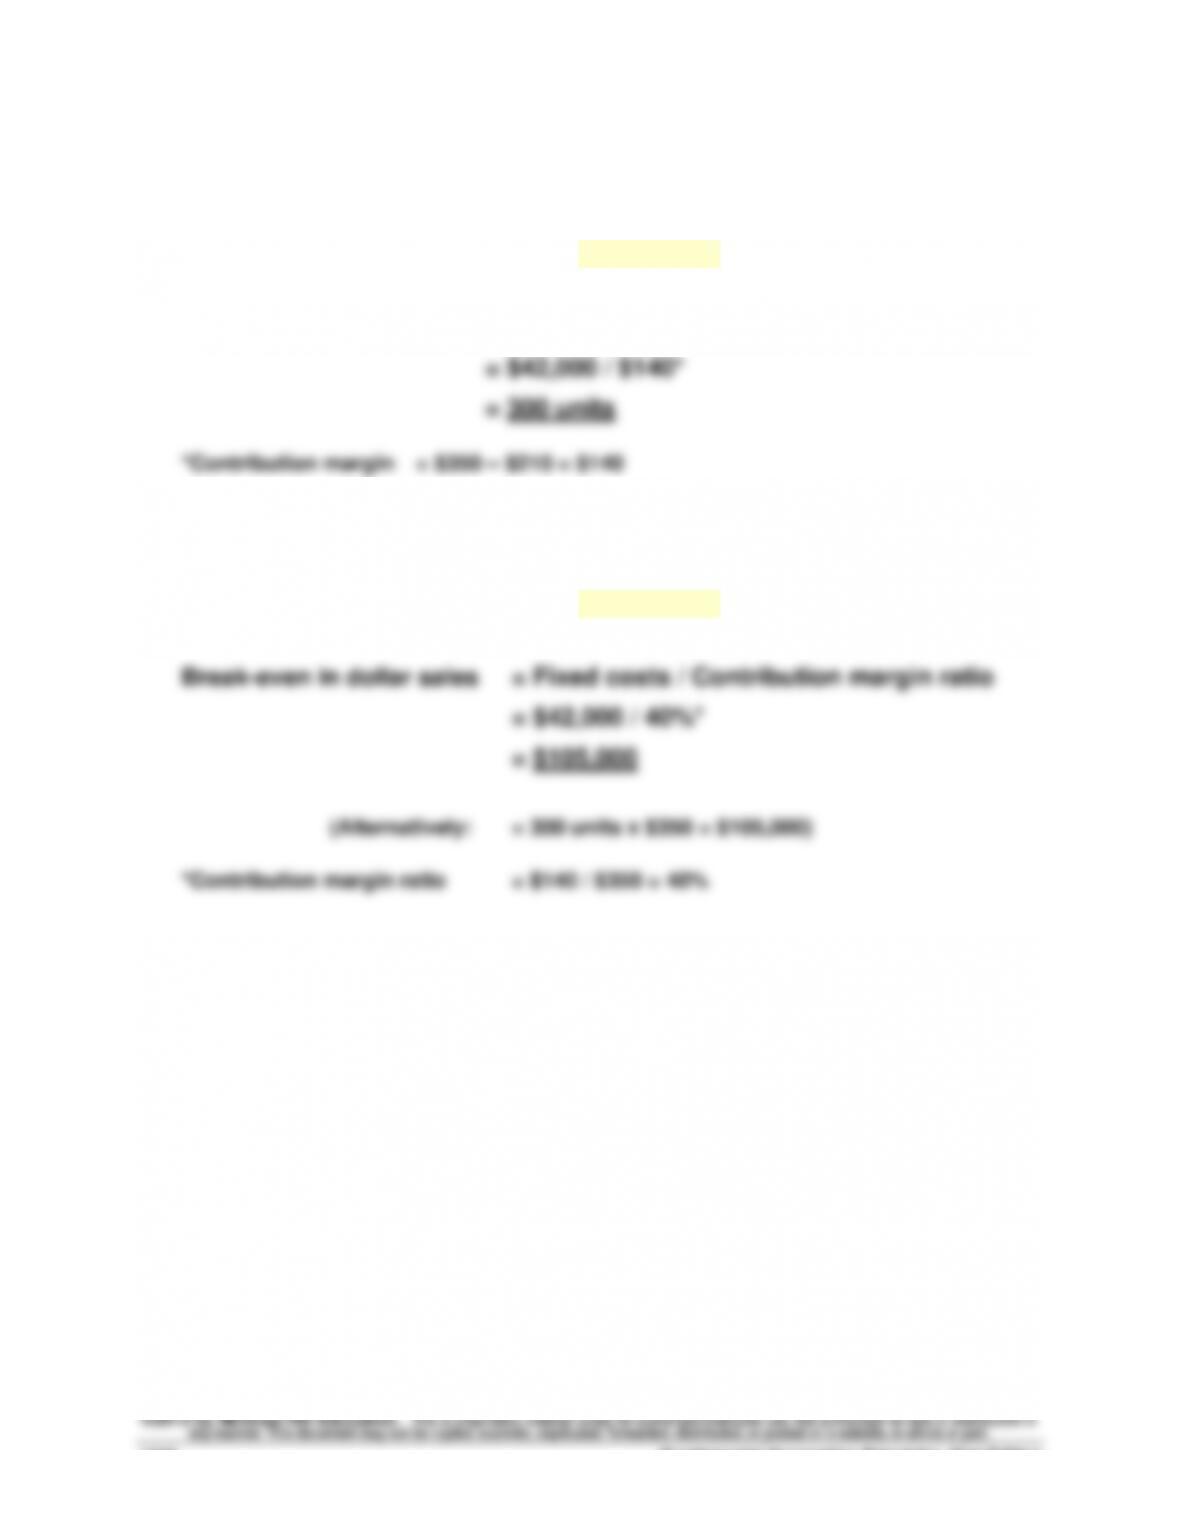
Break-even in unit sales = Fixed costs / Contribution margin per unit
(b) Instructor note: Use the equation in Exhibit 21.12

Problem 21-2B (Continued)
Part 2
Part 3
HIP-HOP CO.
Contribution Margin Income Statement (at Break-Even) — Keyboards
Sales (300 x $350) ……………………………………………………………………..
$105,000
Variable costs (300 x $210) ……………………………………………………….
Fixed costs (given) …………………………………………………………………...
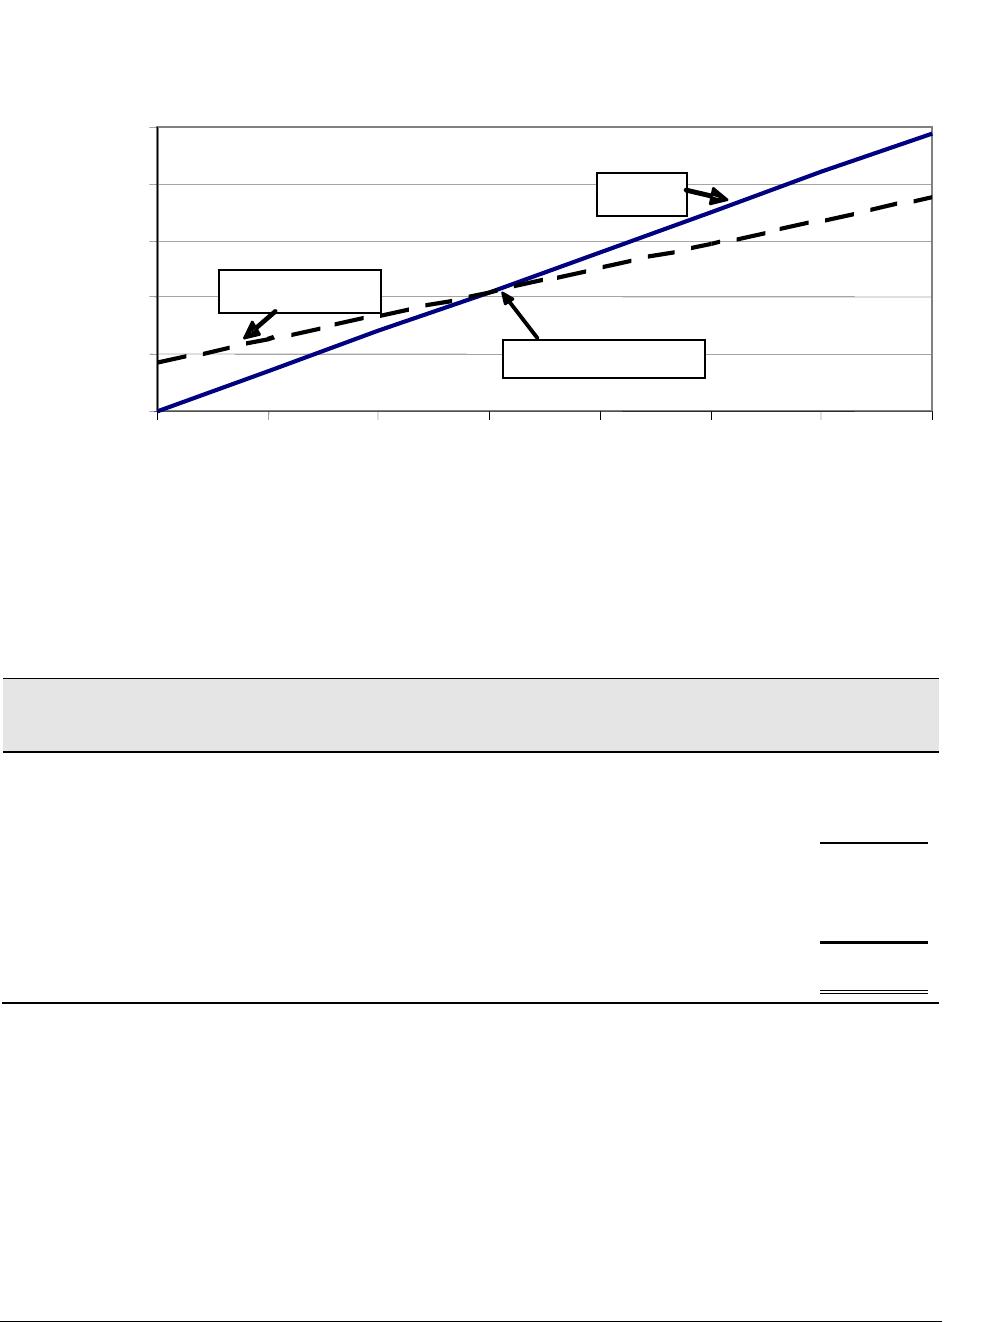
Hip-Hop Company CVP chart
$ 0
$50,000
$200,000
$250,000
0
100
200
300
400
500
600
700
Units
Fundamental Accounting Principles, 21st Edition
1248
Problem 21-3B (45 minutes)
Parts 1 and 2
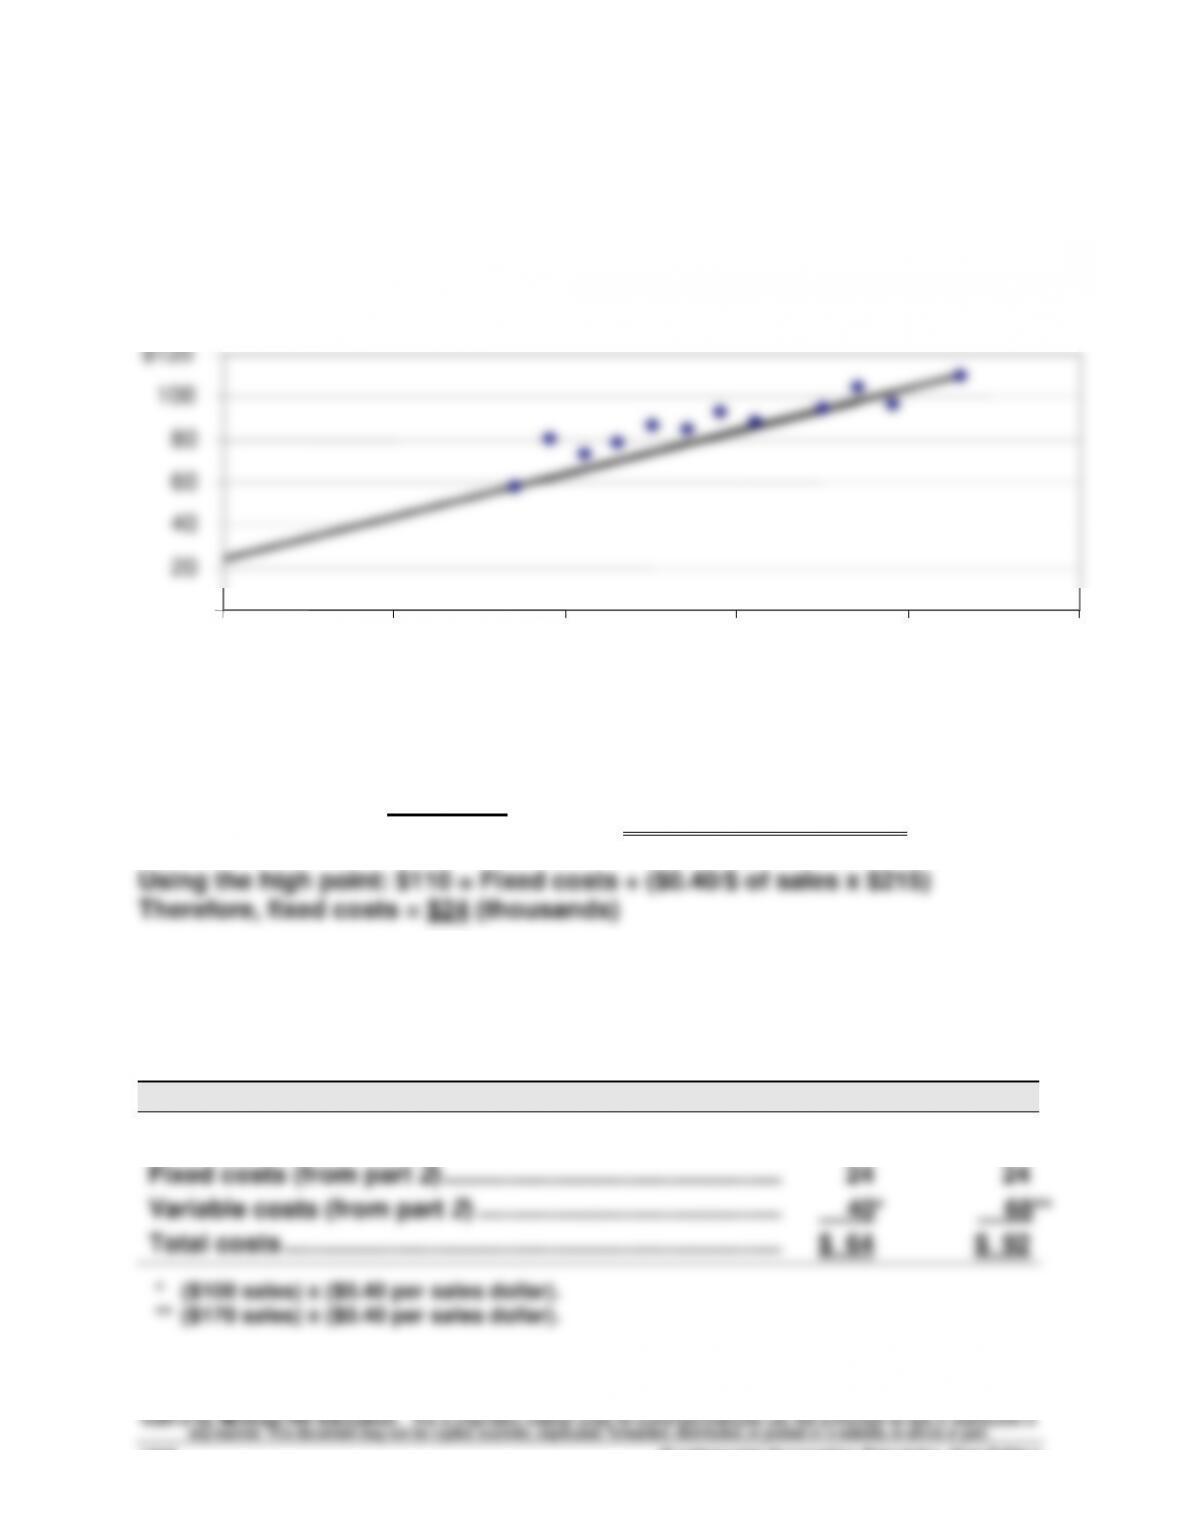
The scatter diagram and its estimated line of cost behavior appear below.
Sales and cost amounts are in thousands of dollars.
Part 2 Calculation of variable and fixed costs
Variable costs = = $0.40 per dollar of sales
Part 3
The estimates in Part 2 can be used to predict the total costs that will be
incurred at sales levels of $100 and $170 (both in thousands).
(‘000s)
Predictions
Sales (given) …………………………………………………………………..
$100
$170
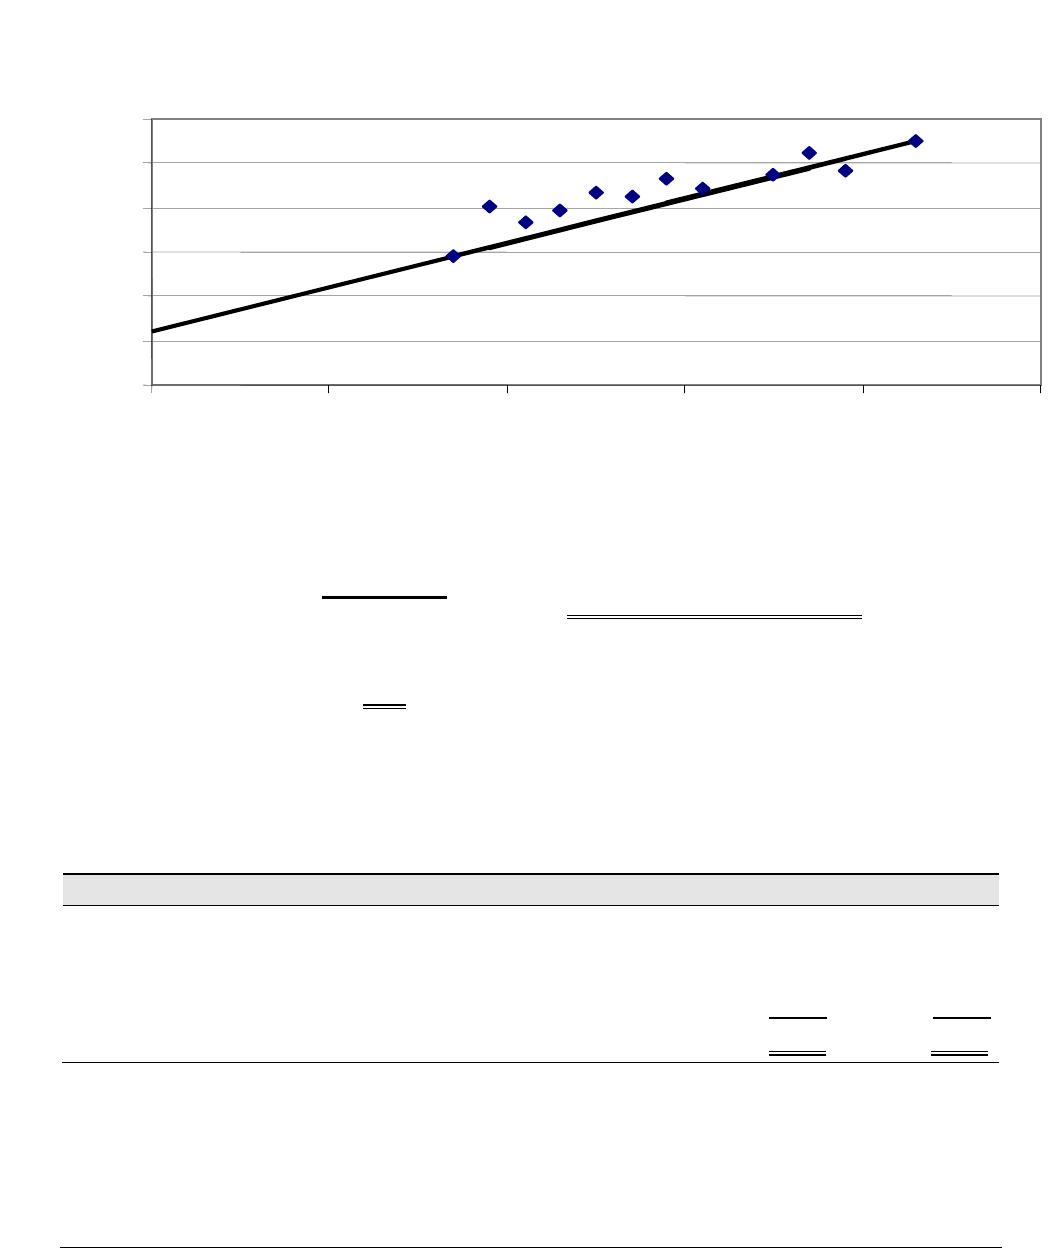
Kyo Company
0
20
40
60
80
100
0
$50
$100
$150
$200
$250
Sales Dollars
Total
Costs
$110 – $58
$215 – $85

Problem 21-4B (75 minutes)
Part 1 Instructor note: Use the equation in Exhibit 21.12
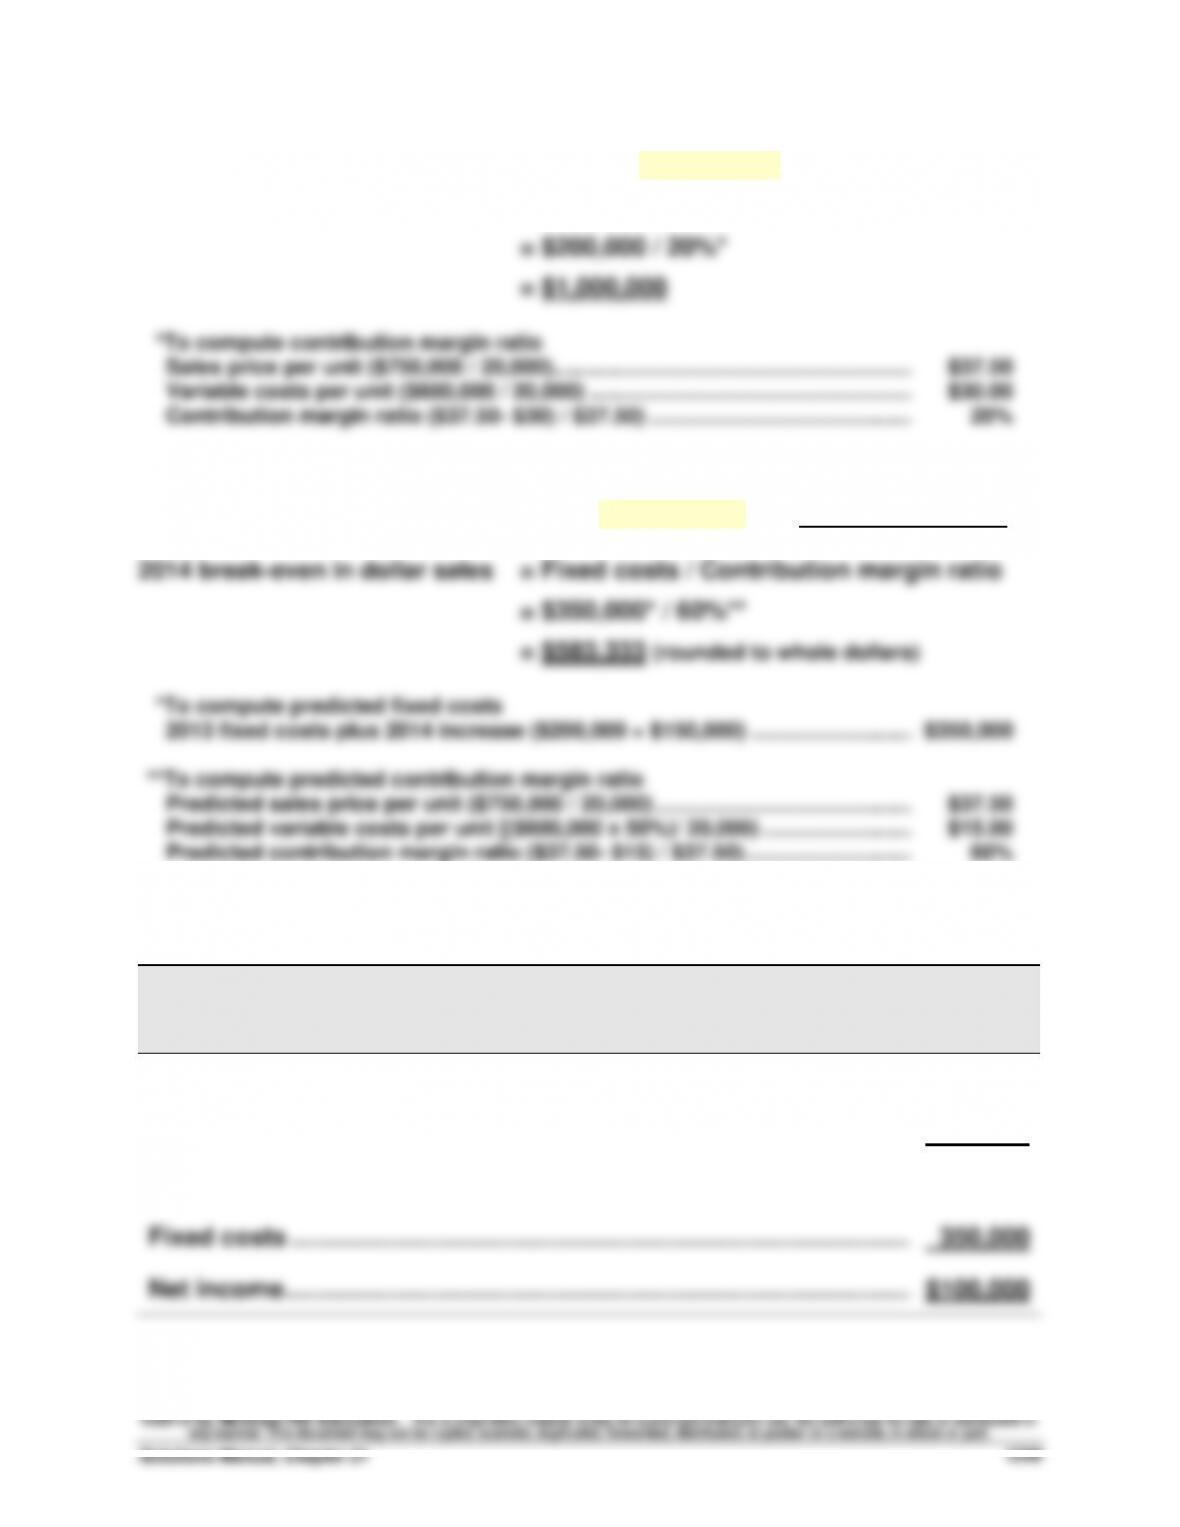
2013 break-even in dollar sales = Fixed costs / Contribution margin ratio
Part 2 Instructor note: Use equation in Exhibit 21.12 with predicted numbers
Part 3
RIVERA COMPANY
Forecasted Contribution Margin Income Statement
For Year Ended December 31, 2014
Sales (20,000 x $37.50) ……………………………………………………………..….
$750,000
Variable costs (20,000 x $15) …………………………………………………….…
300,000
Contribution margin (20,000 x $22.50) ……………………………………….….
450,000
Fixed costs ………………………………………………………………………………….
350,000
Net income ……………………………………………………………………………….….
Fundamental Accounting Principles, 21st Edition
1250
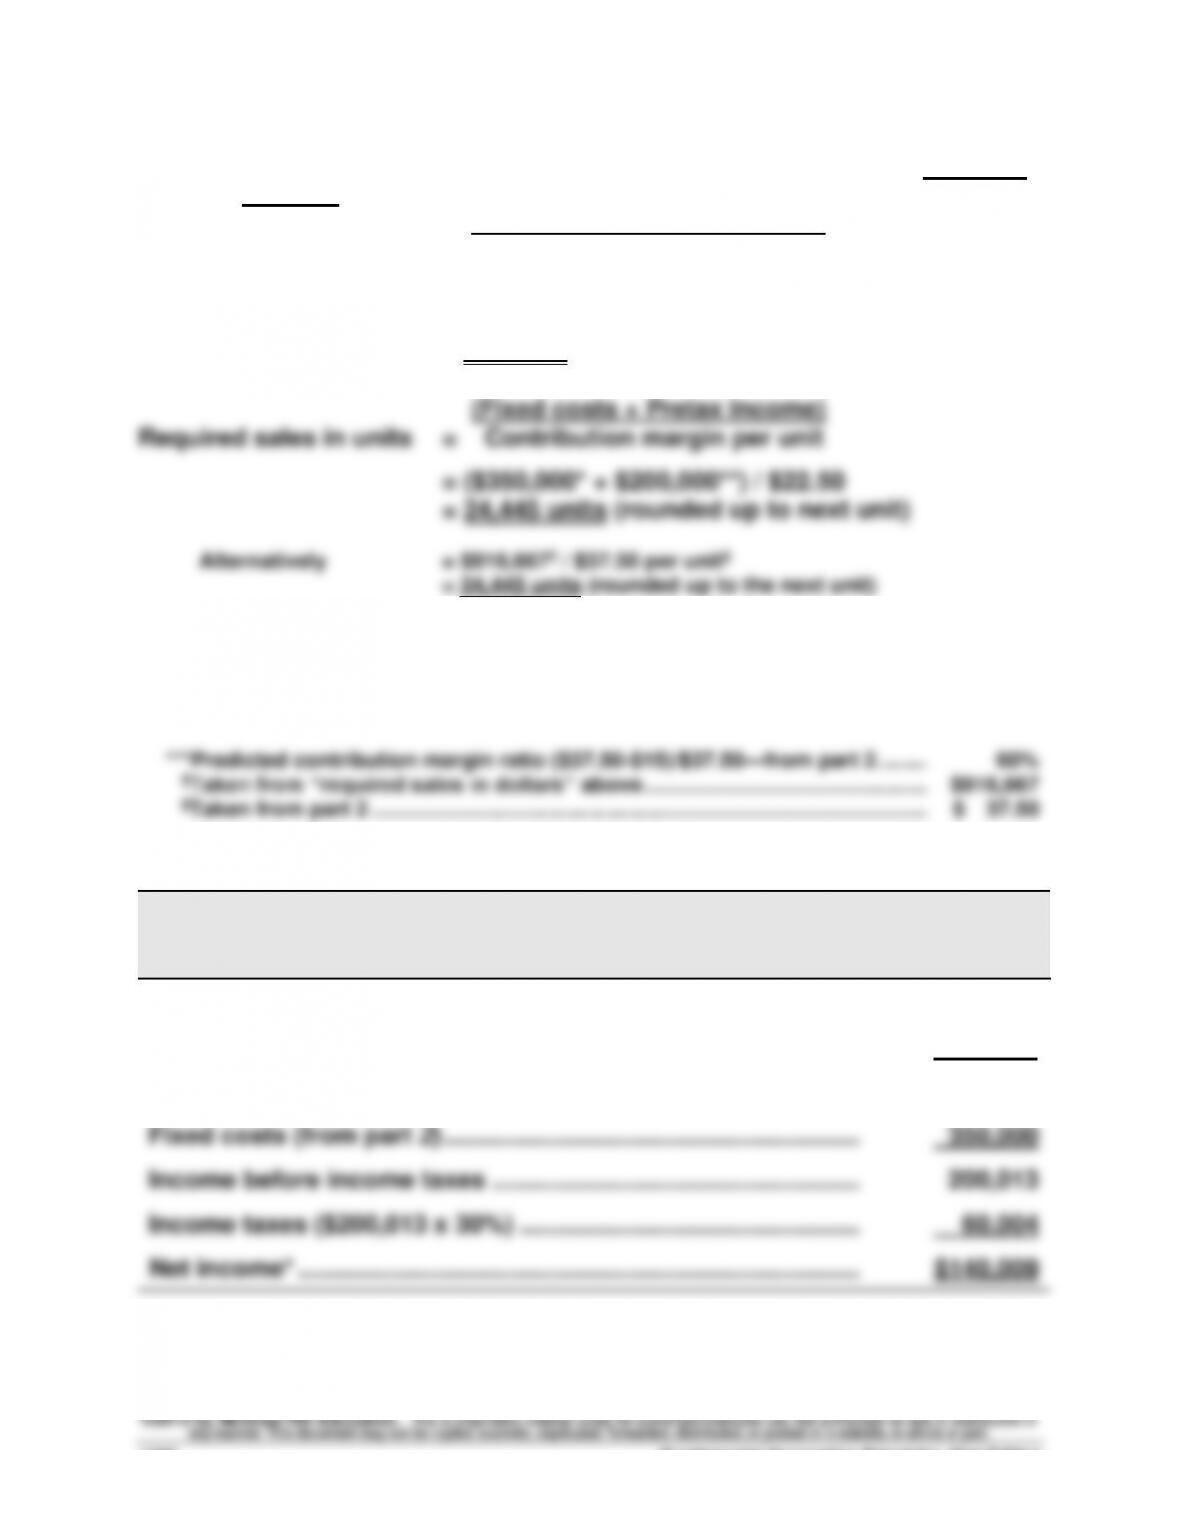
Problem 21-4B (Continued)
Part 4 Instructor note: Use equations in Exhibit 21.22 and 21.23 with predicted
numbers
(Fixed costs + Pretax income)
Required sales in dollars = Contribution margin ratio
= ($350,000* + $200,000**) / 60%***
= $550,000 / 60%
= $916,667 (rounded to the next dollar)
* 2013 fixed costs plus 2014 increase ($200,000 + $150,000) …………………….…..
$350,000
** Target after-tax income (given) ……………………………………………………………..…..
$140,000
Pretax target income = After-tax target income / (1 – Tax rate)
= $140,000 / (1 – 0.30) = $200,000
$916,667
Part 5
RIVERA COMPANY
Forecasted Contribution Margin Income Statement
For Year Ended December 31, 2014
Sales (24,445 units x $37.50) ……………………………………………....
$916,688
Variable costs (24,445 units x $15) ……………………………………...
366,675
Contribution margin (24,445 units x $22.50) ………………………...
550,013
Income before income taxes ……………………………………………....
200,013
60,004
$140,009
*Slightly greater than the targeted $140,000 income due to rounding of units from part 4.

Problem 21-5B (65 minutes)
Part 1 Instructor note: Use the equation in Exhibit 21.12
Break-even in dollar sales = Fixed costs / Contribution margin ratio
Product BB:
*To compute contribution margin ratio
Sales price per unit
Product BB ($800,000 / 50,000) ……………………………………………………….
Product TT ($800,000 / 50,000) ……………………………………………………….
BB
$16.00
TT
$16.00
Variable costs per unit
$11.20
Contribution margin ratio
Part 2
Forecasted contribution margin income statements for each product
assuming sales decline to 33,000 units with no change in unit sales price
MINGEI CO.
Forecasted Contribution Margin Income Statement
Product BB
Product TT
Sales* …………………………………………………………………
$528,000
$ 528,000
Variable costs** ………………………………………………..…
369,600
66,000
Contribution margin ……………………………………………
158,400
462,000
100,000
560,000
18,688
(31,360)
Net income ……………………………………………………….
Unit sales price and variable costs are computed in Part 1 and used in these computations:
* Product BB sales = 33,000 units x $16; Product TT sales = 33,000 units x $16.

Fundamental Accounting Principles, 21st Edition
1252
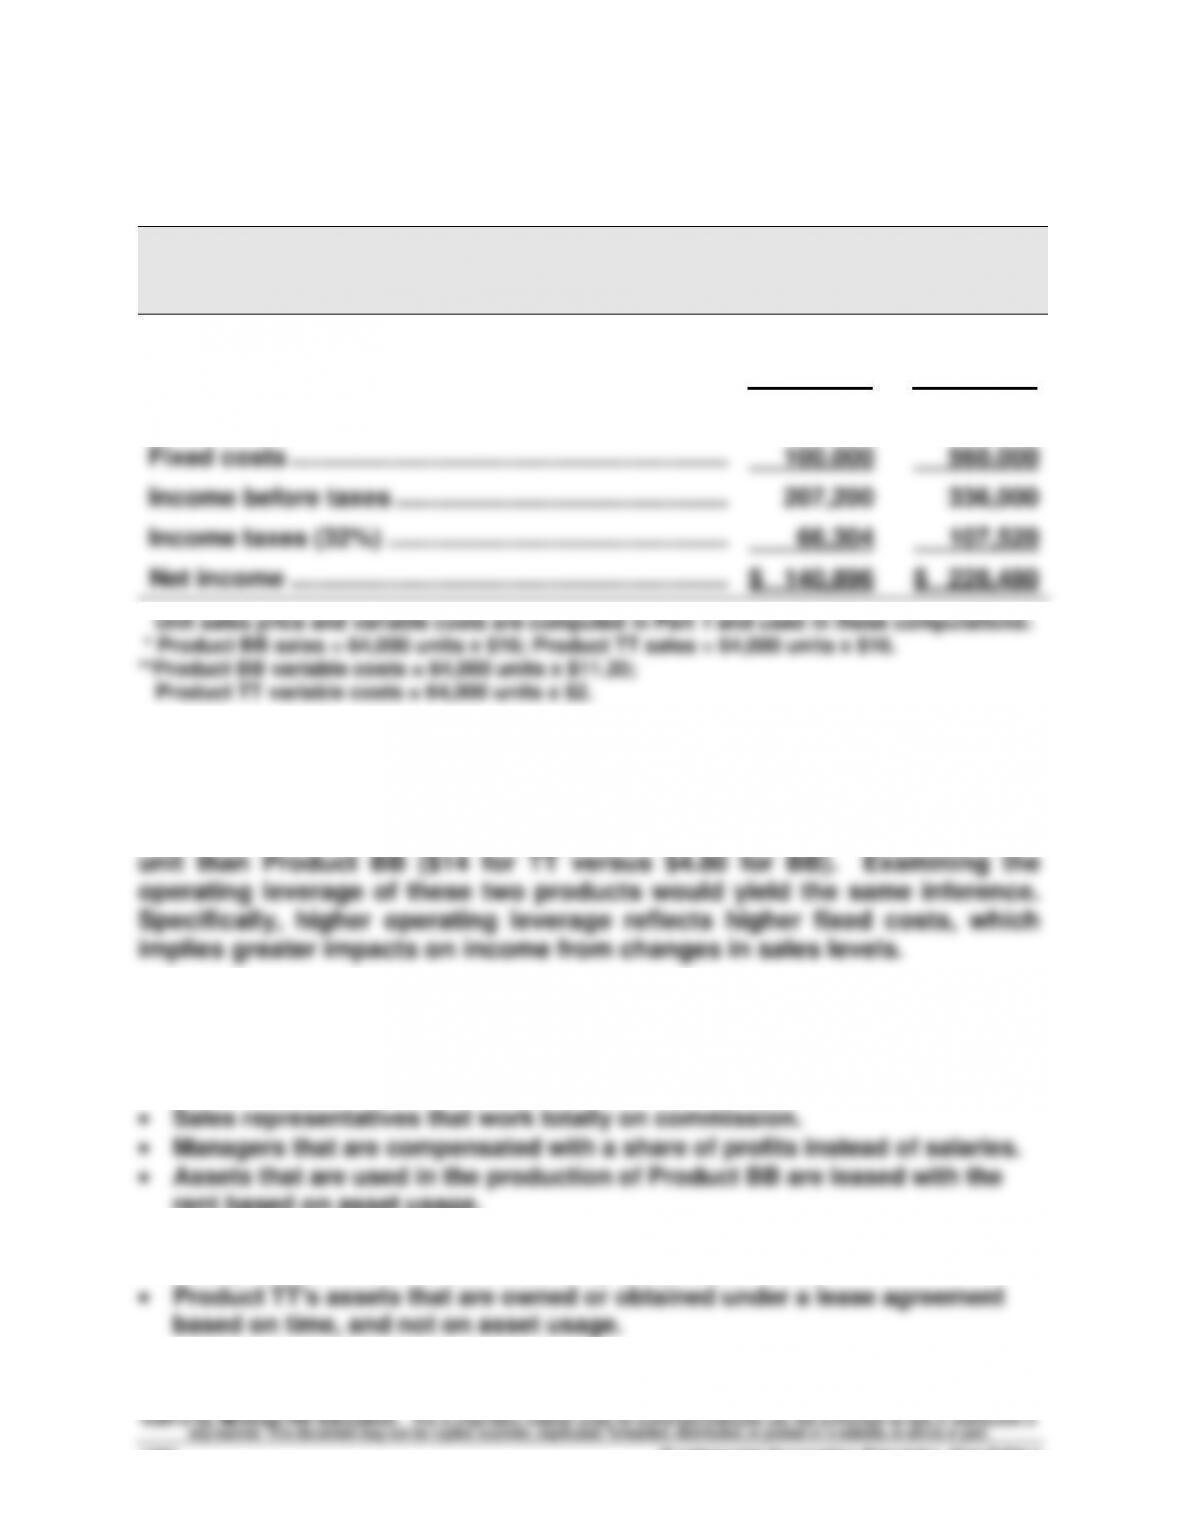
Problem 21-5B (Continued)
Forecasted contribution margin income statements for each product
assuming sales increase to 64,000 units with no change in unit sales price
MINGEI CO.
Forecasted Contribution Margin Income Statement
Product BB
Product TT
Sales* …………………………………………………………………
$1,024,000
$1,024,000
Variable costs** ………………………………………………..…
716,800
128,000
Contribution margin ……………………………………………
307,200
896,000
207,200
336,000
66,304
107,520
Part 4
If sales were to greatly increase, Product TT would experience the greater
increase in income because it would gain more contribution margin per
Part 5
Factors that could cause Product BB to have lower fixed costs include:
• Labor arrangement that pays workers for units produced.
rent based on asset usage.
In contrast, the fixed costs for Product TT could be higher because of:
• Salary structure that is not based on production or sales.
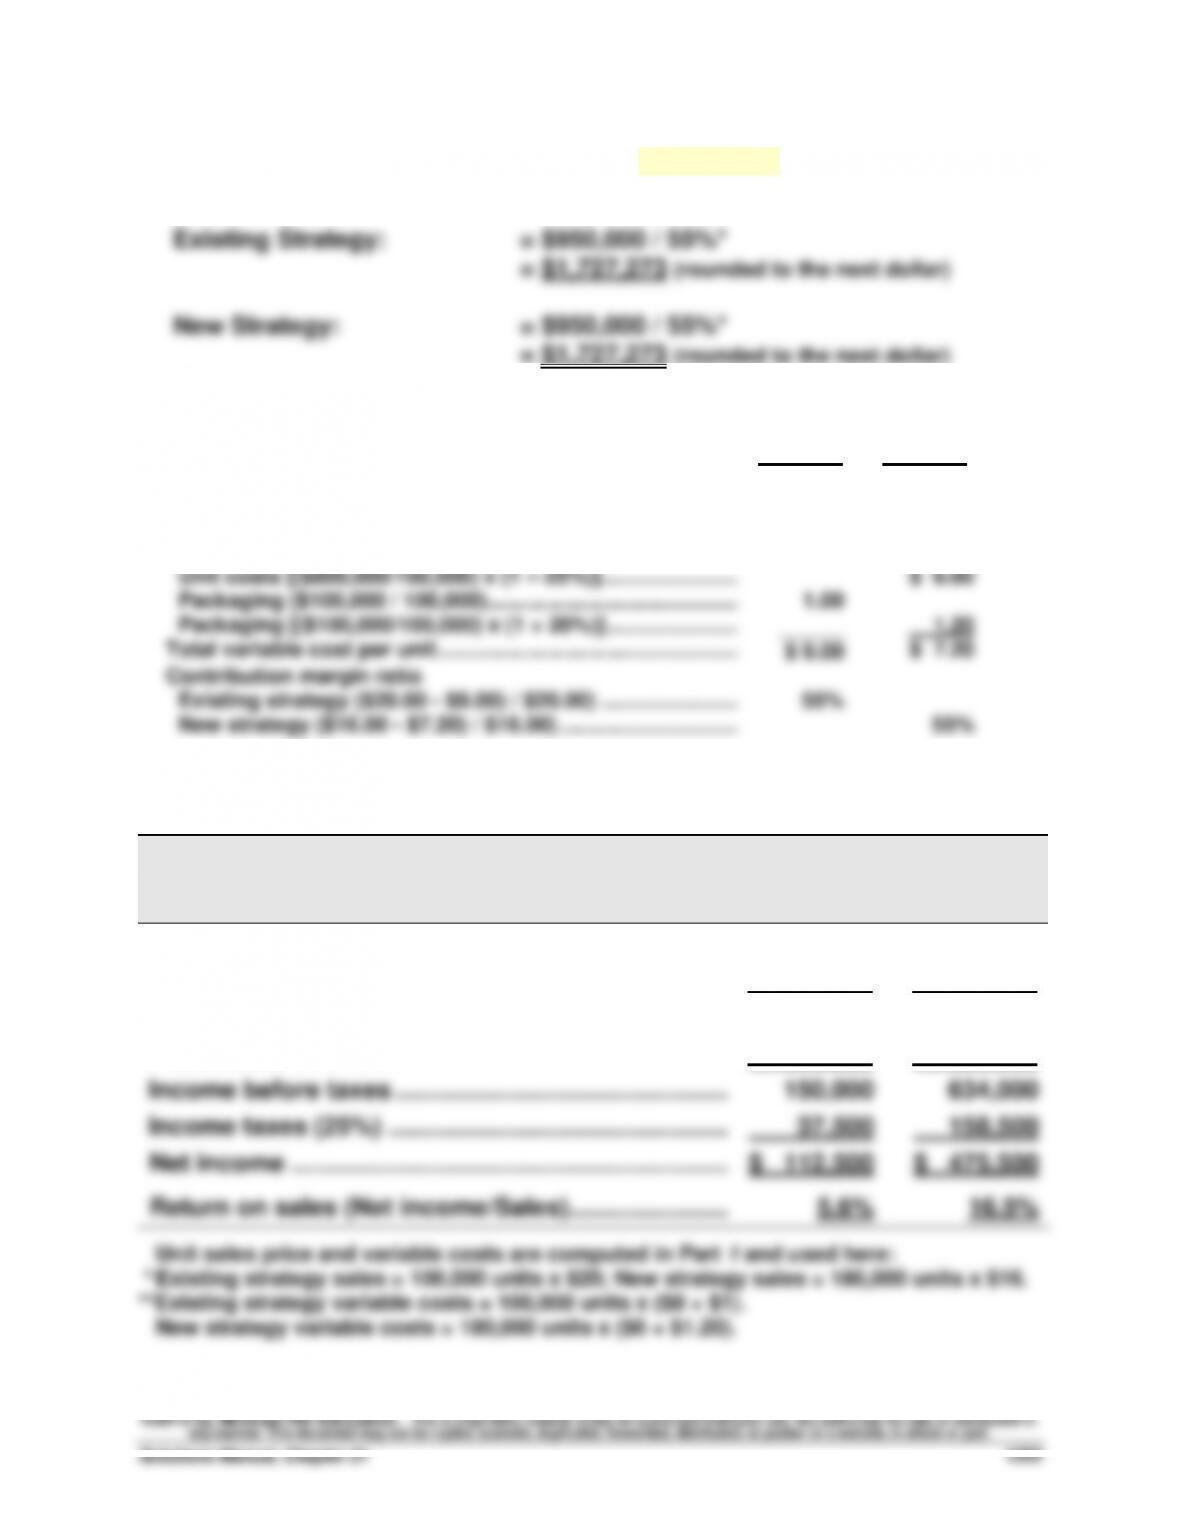
Problem 21-6B (45 minutes)
Part 1 Instructor note: Use the equation in Exhibit 21.12
Break-even in dollar sales = Fixed costs / Contribution margin ratio
*To compute contribution margin ratio
Sales price per unit
Existing strategy ……………………………………………………….
New strategy [$20.00 x (1 – 20%)] ………………………………..……………………..
Existing
Strategy
$20.00
New
Strategy
$16.00
Total variable costs per unit
Unit costs ($800,000 / 100,000) ……………………………………………………….
$ 8.00
Existing strategy ($20.00 – $9.00) / $20.00) …………………..………
Part 2
BEST COMPANY
Forecasted Contribution Margin Income Statement
Existing Strategy
New Strategy
Sales* …………………………………………………………………
$2,000,000
$2,880,000
Variable costs** ………………………………………………..…
900,000
1,296,000
Contribution margin ……………………………………………
1,100,000
1,584,000
Fixed costs ……………………………………………………….
950,000
950,000
Income before taxes ……………………………………………
37,500
158,500
Net income ……………………………………………………….