Title: Exercise 21-7
QA_Ori:
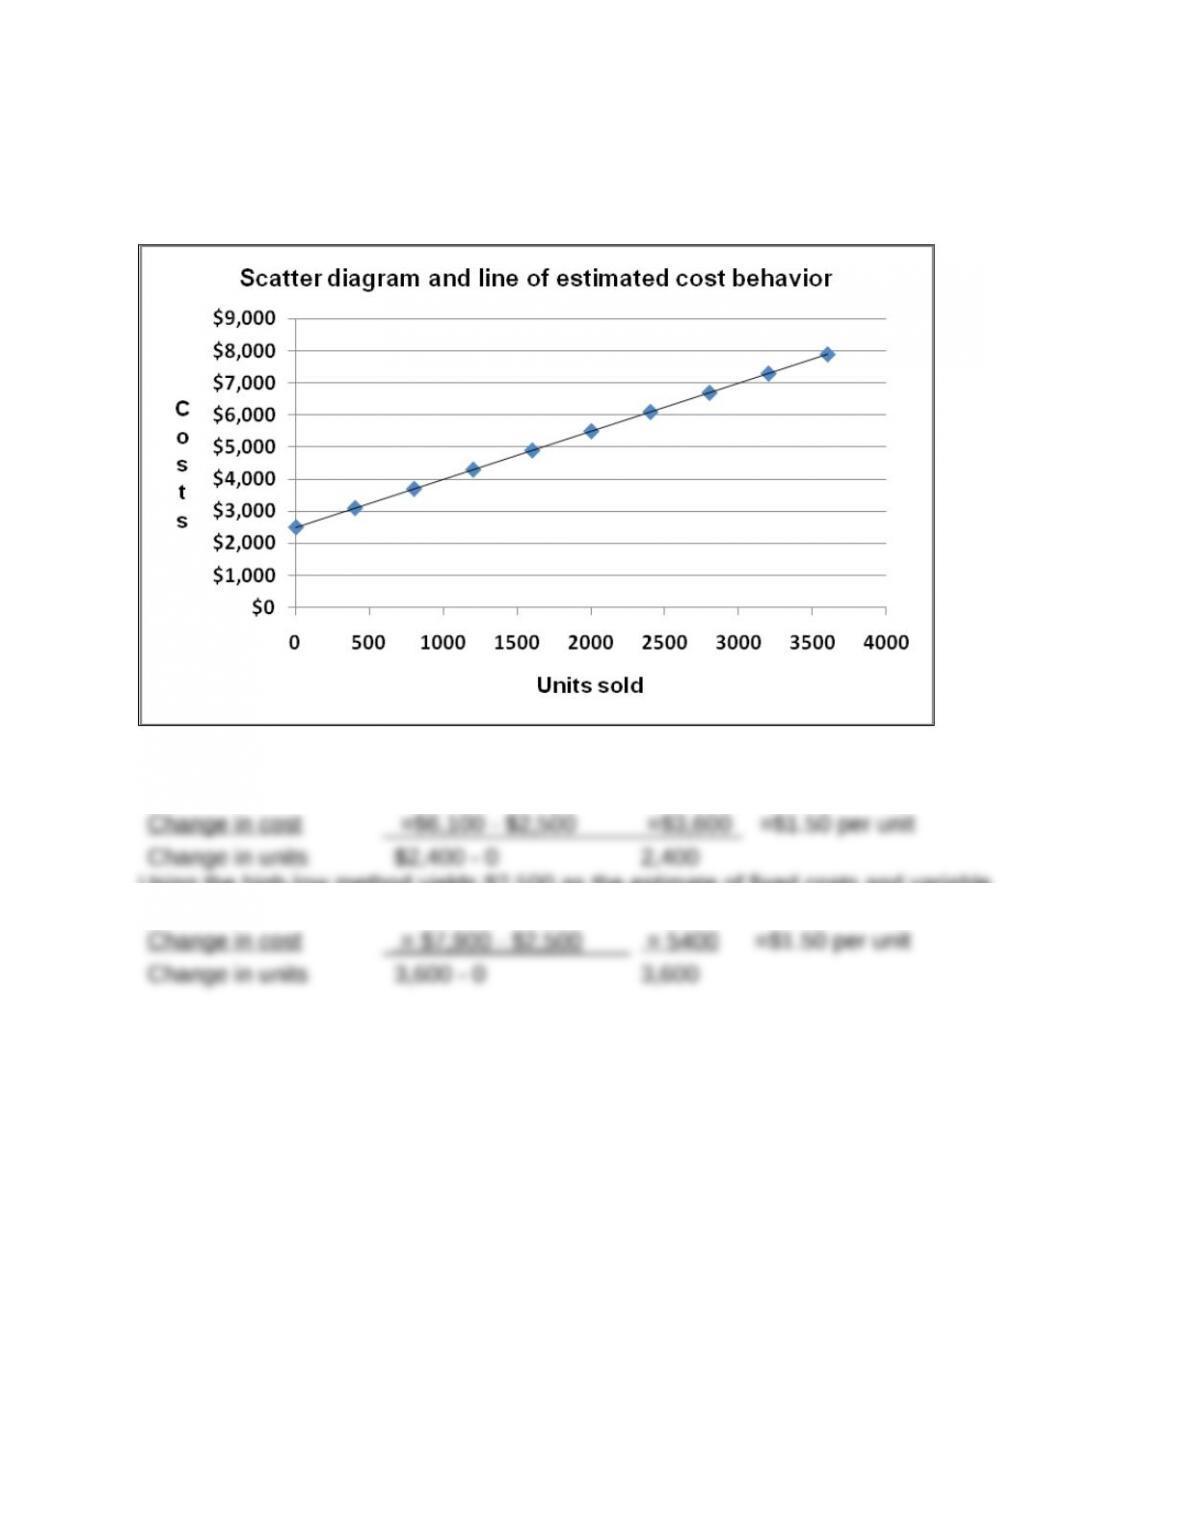
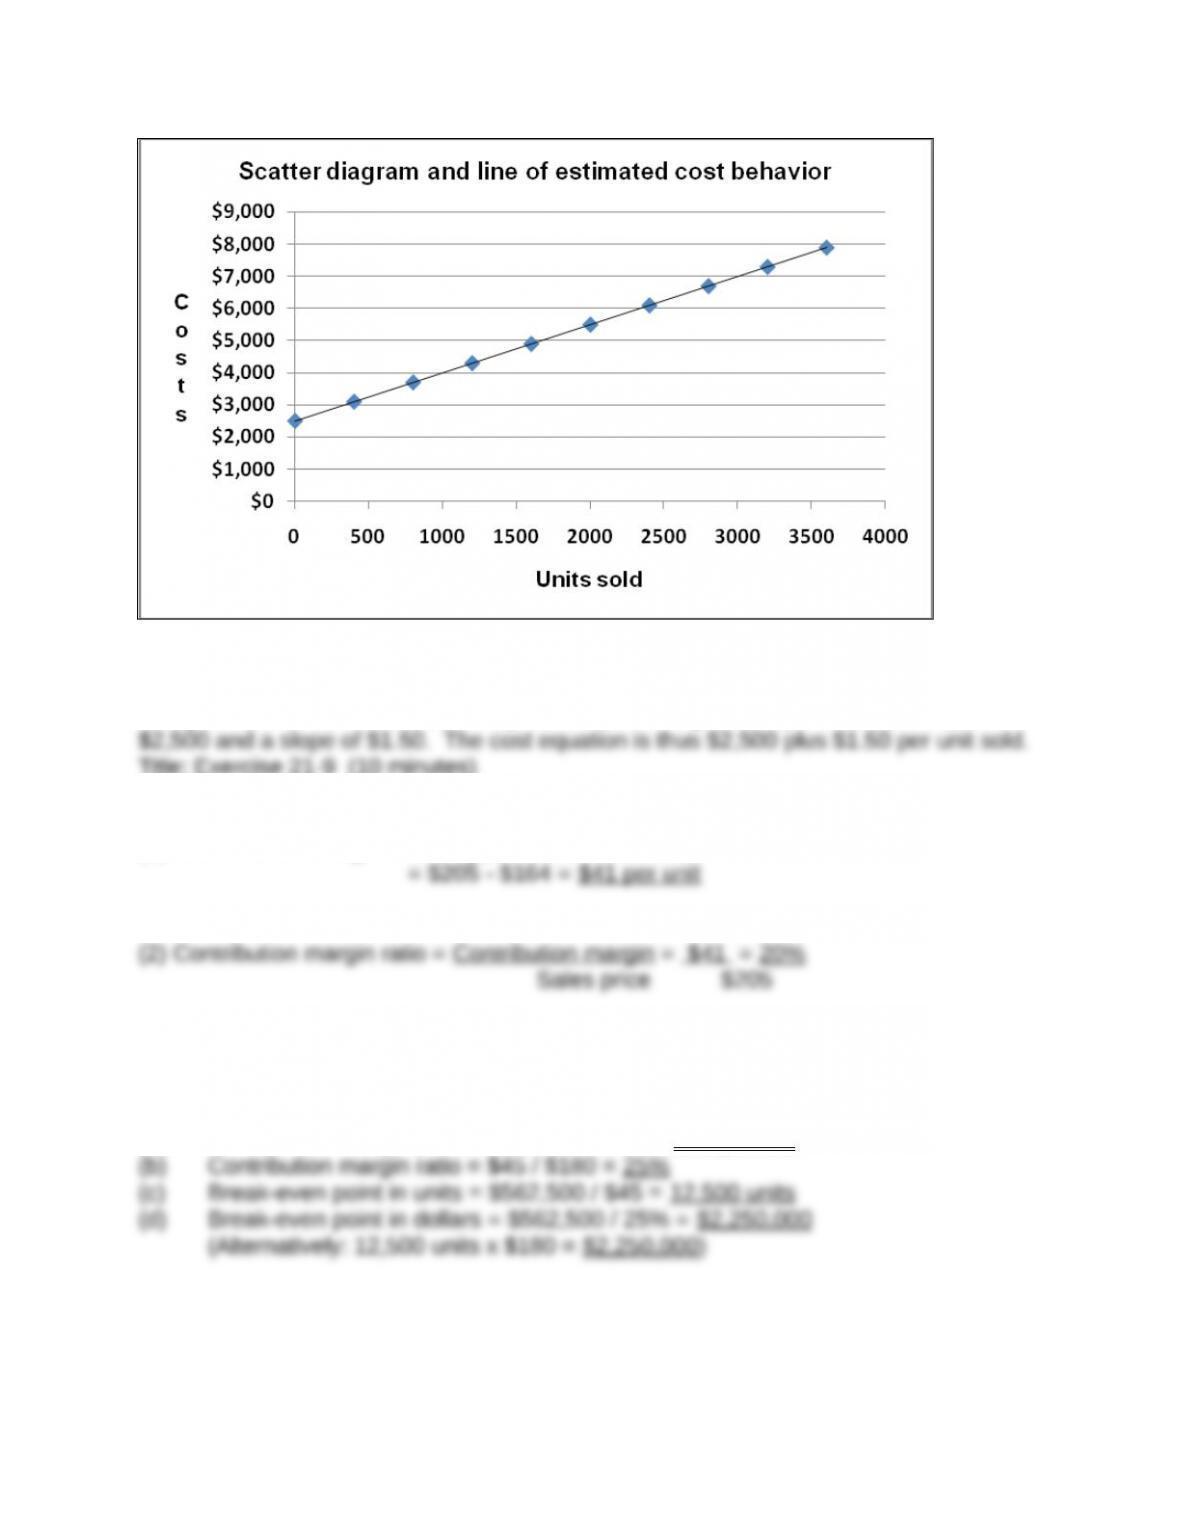
The scatter diagram and line of estimated cost behavior appear below.
Selecting 0 and 2,400 units sold as the activity levels yields $2,500 as the estimate of
fixed costs and the following estimate of variable costs per unit:
Using the high-low method yields $2,500 as the estimate of fixed costs and variable
costs per unit of:
Title: Exercise 21-8A
QA_Ori:
(3) The contribution margin of 20% implies that for each $1 in sales, the company has
$0.20 that contributes to fixed costs and profit.
Title: Exercise 21-10 (30 minutes)
QA_Ori:
(a) Contribution margin per unit = $180 – $135 = $45 per unit
Title: Exercise 21-12
QA_Ori:
1.
BLANCHARD COMPANY
Contribution Margin Income Statement (at Break-Even)
Sales (12,500 x $180) $2,250,000
2. Sales (in dollars) to break even with increased fixed costs
Break-even = (Original fixed costs + Additional fixed costs)
Contribution margin ratio
Title: Exercise 21-13 (25 minutes)
QA_Ori:
Preliminary computations
Pretax income = After-tax income / (1 – Tax rate)
Income taxes = Pretax income x tax rate
Unit sales at target income = Fixed costs + Pretax income
Contribution margin/unit
$45
Dollar sales at target income = Fixed costs + Pretax income
Contribution margin ratio
Title: Exercise 21-14
QA_Ori:
BLANCHARD COMPANY
Forecasted Contribution Margin Income Statement
Sales (40,000 x $200) $8,000,000
Variable costs (40,000 x $140) 5,600,000
Title: Exercise 21-15
QA_Ori:
1 Pretax income = Sales – Variable costs – Fixed costs
2 Instructor note: Use the equation in Exhibit 21.23 with no tax effects
Unit sales = fixed costs + Target Pretax income
Contribution margin per unit
Title: Exercise 21-16
QA_Ori:
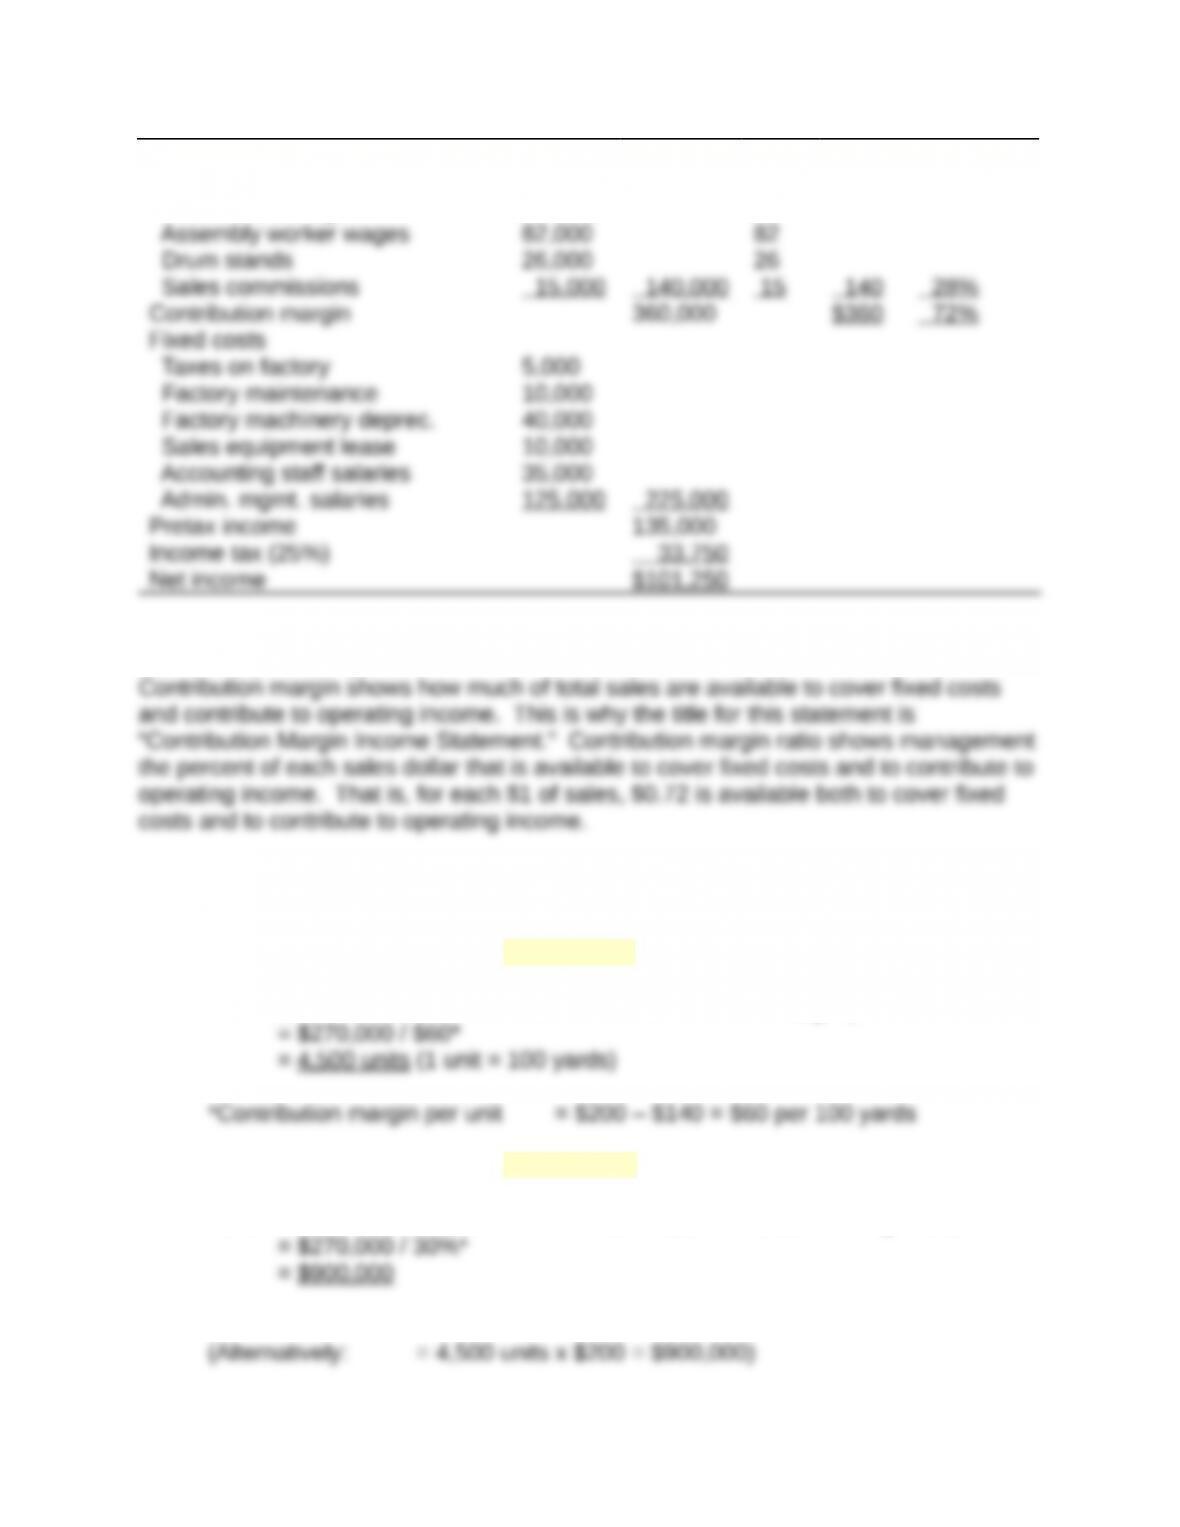
(a) Total expected variable costs
= Variable costs per unit x units produced and sold
= $60* x 200,000 units
= $12,000,000
*The $60 variable costs per unit is computed by determining (i) sales
price per unit and (ii) subtracting contribution margin per unit:
Sales price per unit ($17,000,000 / 200,000 units) $ 85
Title: Exercise 21-17
QA_Ori:
1. Selling price per composite unit
8 windows @ $200 per unit $1,600
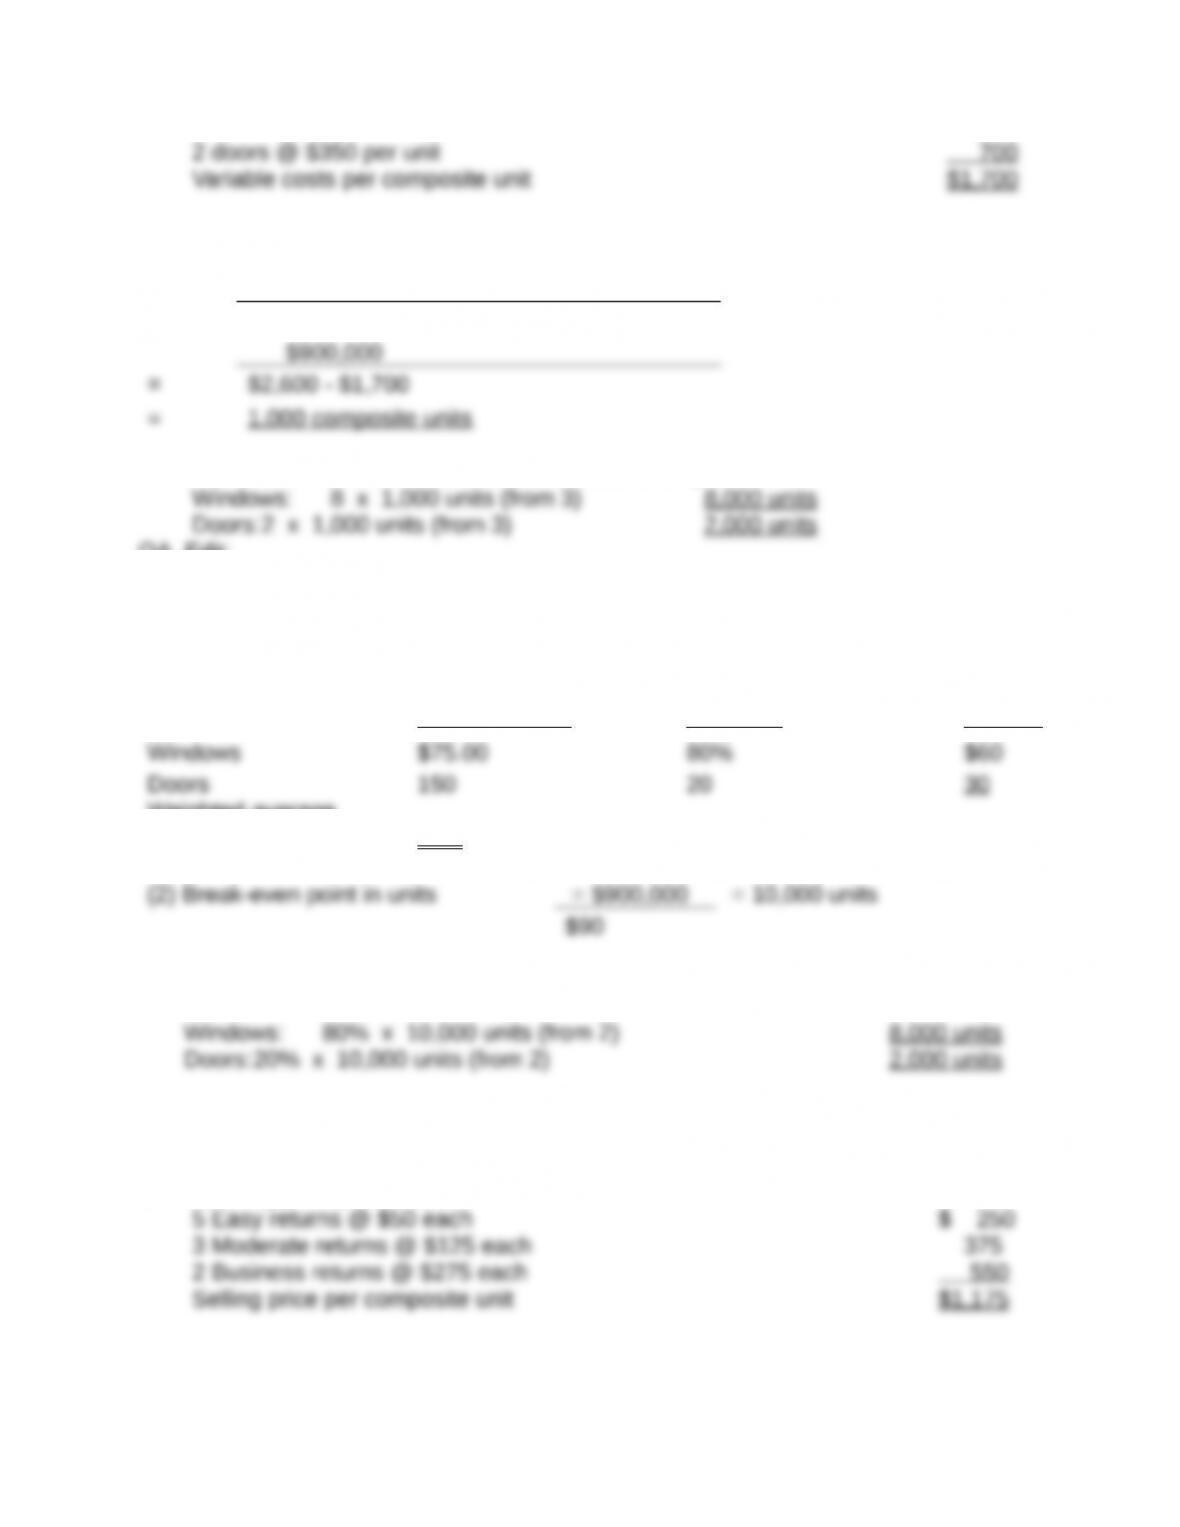
3. Break-even point in composite units
Fixed costs
= Contribution margin per composite unit
4. Unit sales of windows and doors at break-even point
QA_Edit:
2. Variable costs per composite unit
Title: Exercise 21-18
QA_Ori:
Contribution Percentage of Weighted
margin per unit x sales mix = unit CM
Weighted-average
contribution margin $90
(3) Unit sales of windows and doors at break-even point:
Title: Exercise 21-19
QA_Ori:
1. Selling price per composite unit
2. Variable costs per composite unit
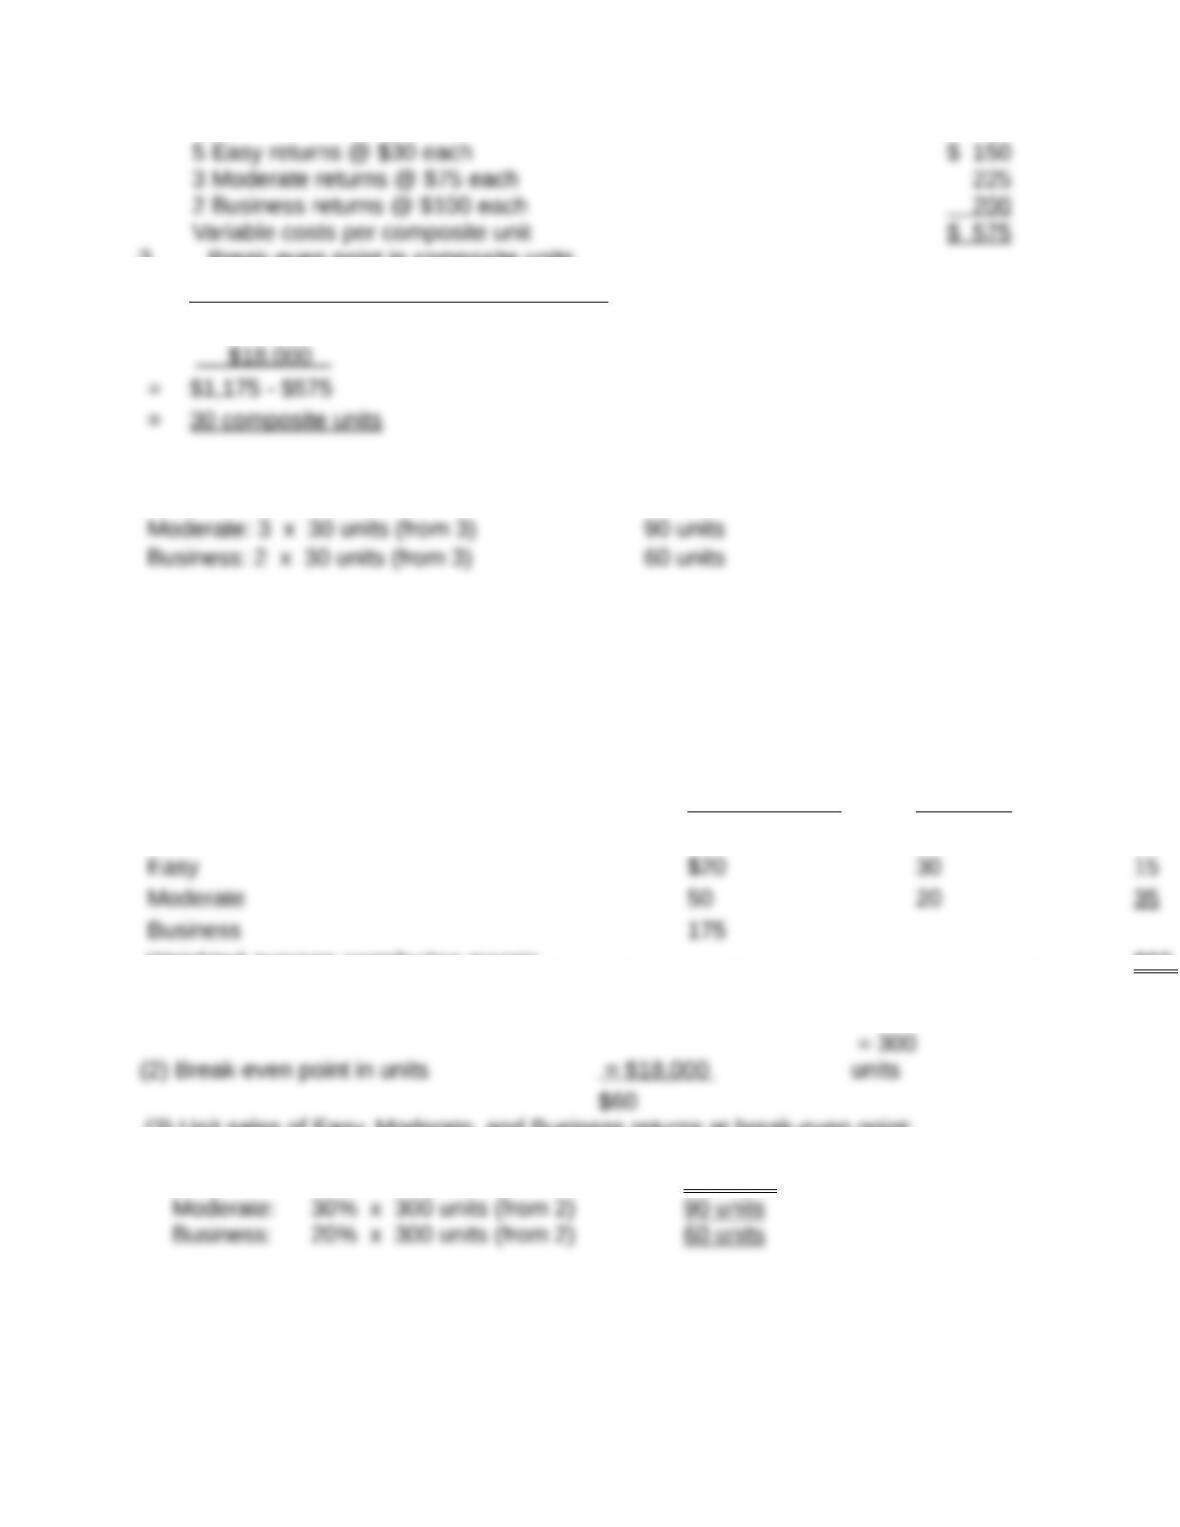
3. Break-even point in composite units
Fixed costs .
= Contribution margin per composite unit
4. Unit sales of Easy, Moderate, and Business returns at break-even point
Easy: 5 x 30 units (from 3) 150 units
Title: Exercise 21-20
QA_Ori:
Contribution Percentage of
Weighte
d
1) Margin per unit x sales mix = Unit CM
50% $10
Weighted-average contribution margin $60
(3) Unit sales of Easy, Moderate, and Business returns at break-even point:
Easy: 50% x 300 units (from 2) 150 units
Title: Exercise 21-21
QA_Ori:
Instructor note: This exercise is solved in 3 steps
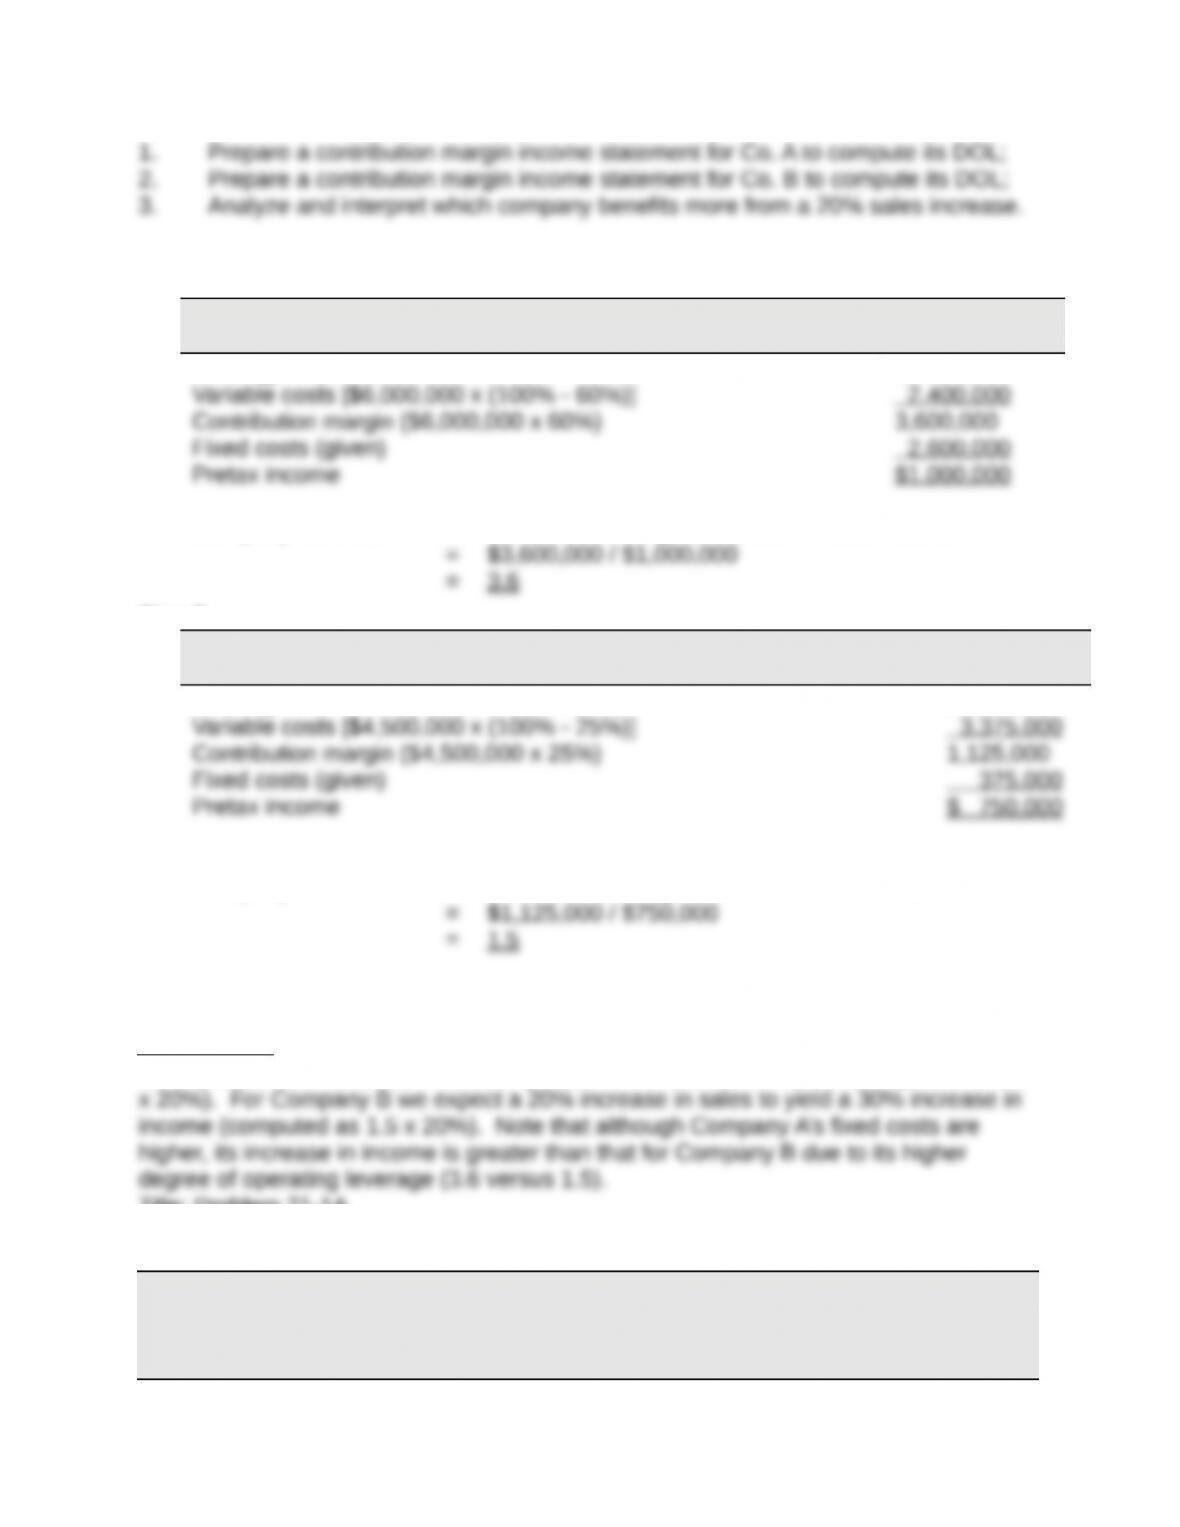
Step 1.
Company A
Contribution Margin Income Statement
Sales (given) $6,000,000
Company A’s DOL = Contribution margin in dollars / Pretax income
Step 2.
Company B
Contribution Margin Income Statement
Sales (given) $4,500,000
Company B’s DOL = Contribution margin in dollars / Pretax income
Step 3.
Interpretation: Company A benefits more from a 20% increase in sales. This is because
we expect a 20% increase in sales to yield a 72% increase in income (computed as 3.6
Title: Problem 21-1A
QA_Ori:
Parts 1 and 2
Tom Thompson Company
Contribution Margin Income Statement
For Year Ended December 31, 2013
(1,000 units) Per unit % of sales
Sales ($500 x 1,000) $500,000 $500 100%
Variable costs
Plastic for casing $17,000 $17
The contribution margin per unit is $360, and the contribution margin ratio is 72%.
Part 3 Analysis Component
Title: Problem 21-2A
QA_Ori:
Part 1
Instructor note: Use the equation in Exhibit 21.11
Break-even in sales units = Fixed costs / Contribution margin per unit
Instructor note: Use the equation in Exhibit 21.12
Break-even in sales dollars = Fixed costs / Contribution margin ratio
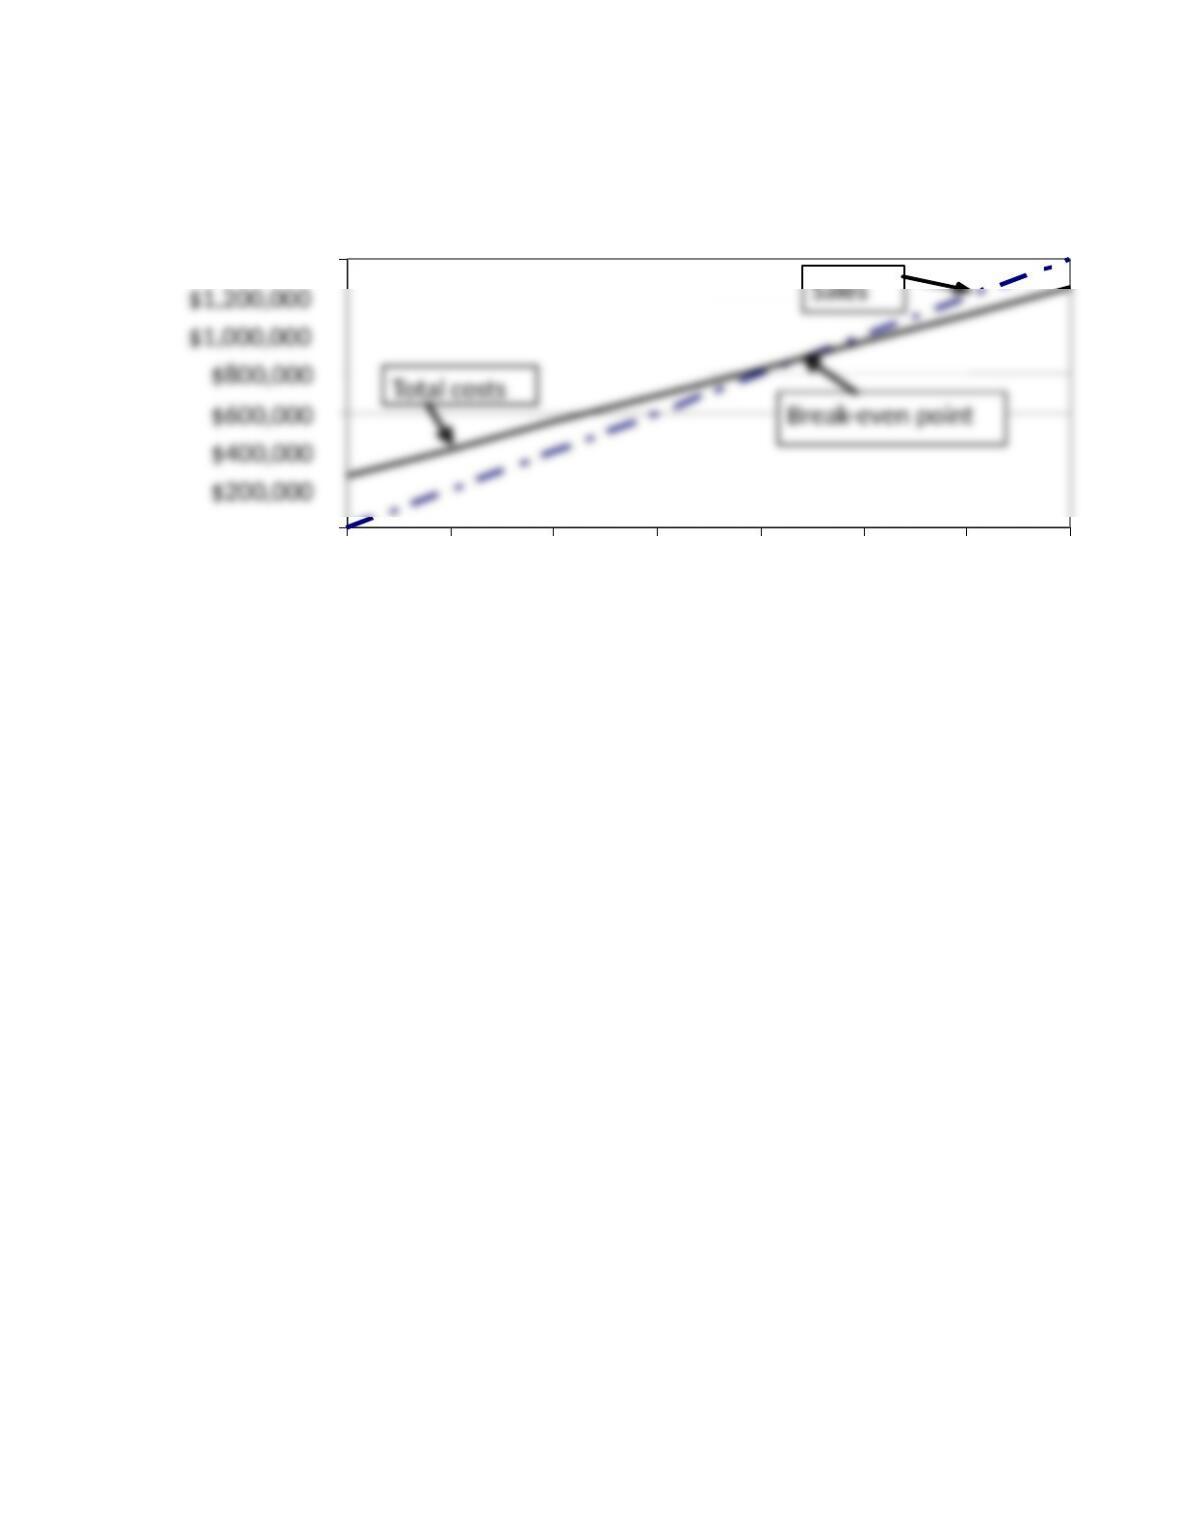
$ 0
$200,000
$400,000
$600,000
$800,000
$1,000,000
$1,200,000
$1,400,000
0 1,000 2,000 3,000 4,000 5,000 6,000 7,000
Units (100 yards)
Total costs
Sales
Break-even point
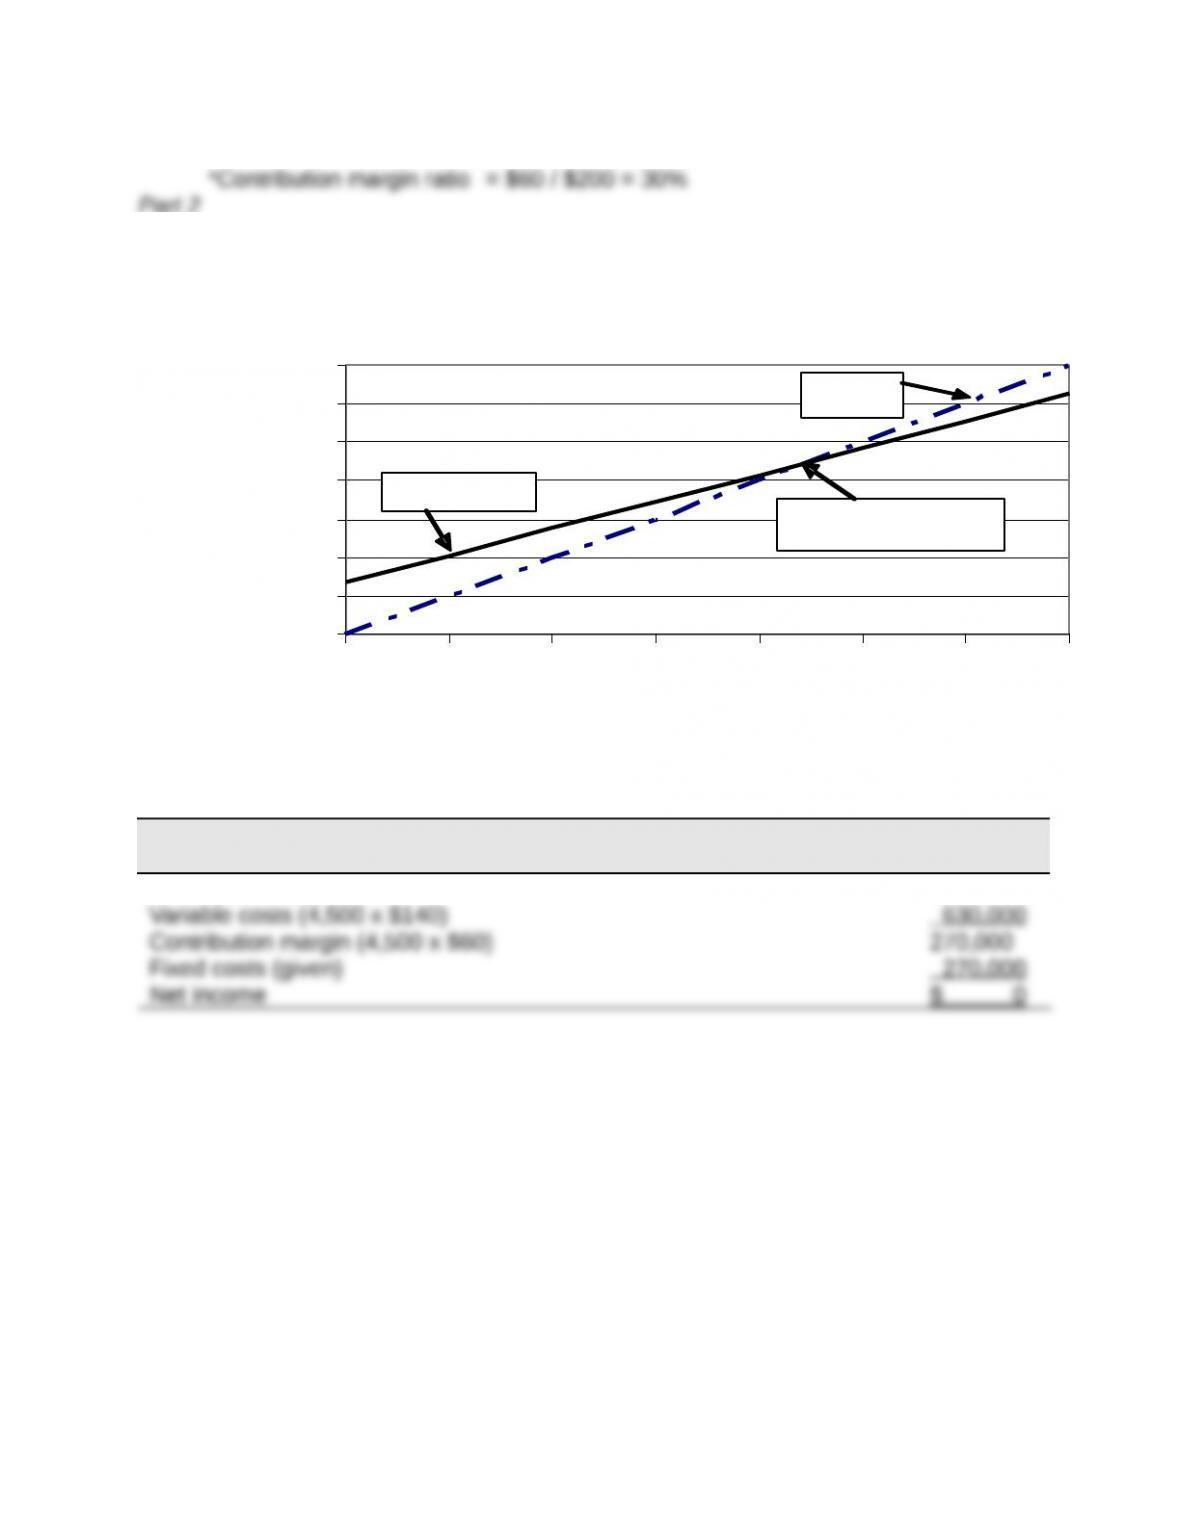
Part 2
CVP Chart for Xcite Equipment Company
Part 3
XCITE EQUIPMENT CO.
Contribution Margin Income Statement (at Break-Even) — Product XT
Sales (4,500 x $200) $900,000
$ 0
$400,000
$1,400,000
0 1,000 2,000 3,000 4,000 5,000 6,000 7,000
Units (100 yards)
Sales