Unlock document.
This document is partially blurred.
Unlock all pages and 1 million more documents.
Get Access
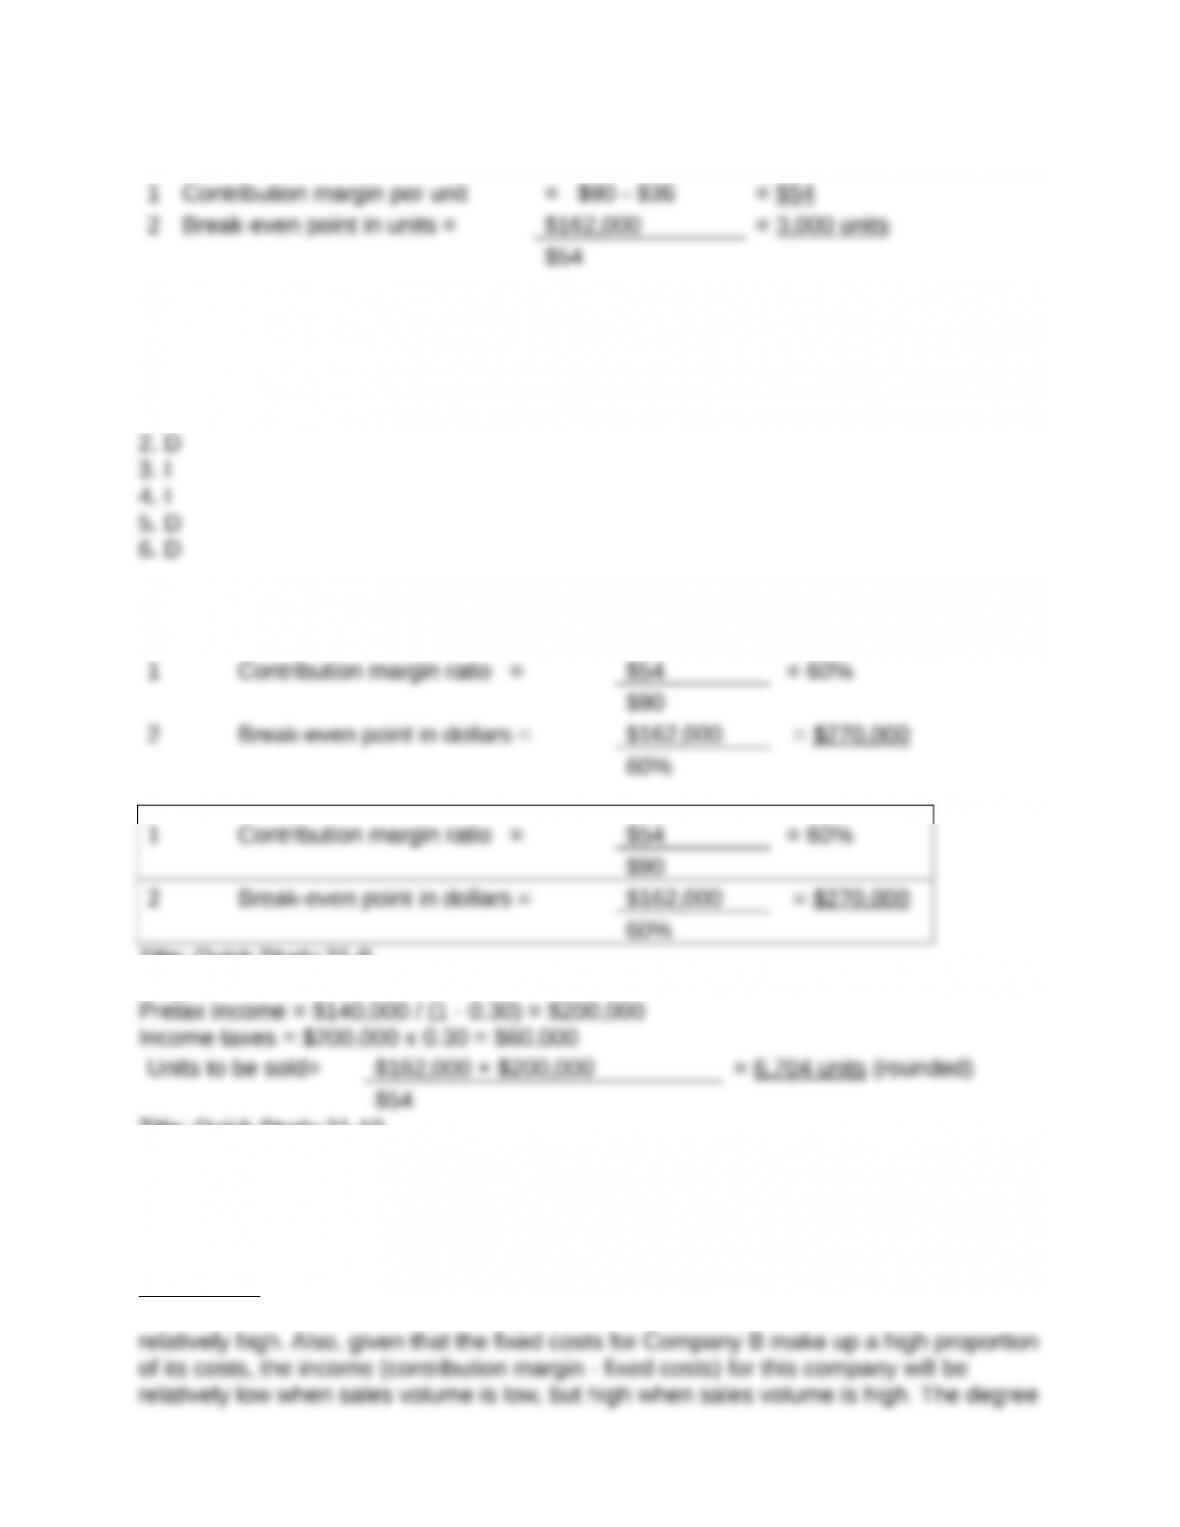
Title: Question 1
QA_Ori:
A variable cost is one that varies proportionately with the volume of activity. For
Title: Question 2
QA_Ori:
Variable costs per unit stay the same (remain constant) when output volume changes.
Title: Question 3
QA_Ori:
Fixed costs per unit decrease when output volume increases. This is because the total
Title: Question 4
QA_Ori:Cost-volume-profit analysis is especially useful in the planning phase for a
Title: Question 5
QA_Ori:A step-wise cost remains constant over a limited range of output activity, outside
Title: Question 6
QA_Ori:Contribution margin ratio means that for each sales dollar a specified percent is
Title: Question 7
QA_Ori:Definition: Contribution margin ratio = Contribution margin / Sales price per unit.
Title: Question 8
QA_Ori:Definition: Unit contribution margin = Sales price per unit - Variable costs per
Title: Question 9
QA_Ori:A CVP analysis for a manufacturing company is simplified by assuming that the
Title: Question 10
QA_Ori:The first is that although individual costs classified as fixed or variable might not
Title: Question 11
QA_Ori:By assuming a relevant range for operating activity, management can more
Title: Question 12
QA_Ori:
Title: Question 13
QA_Ori:
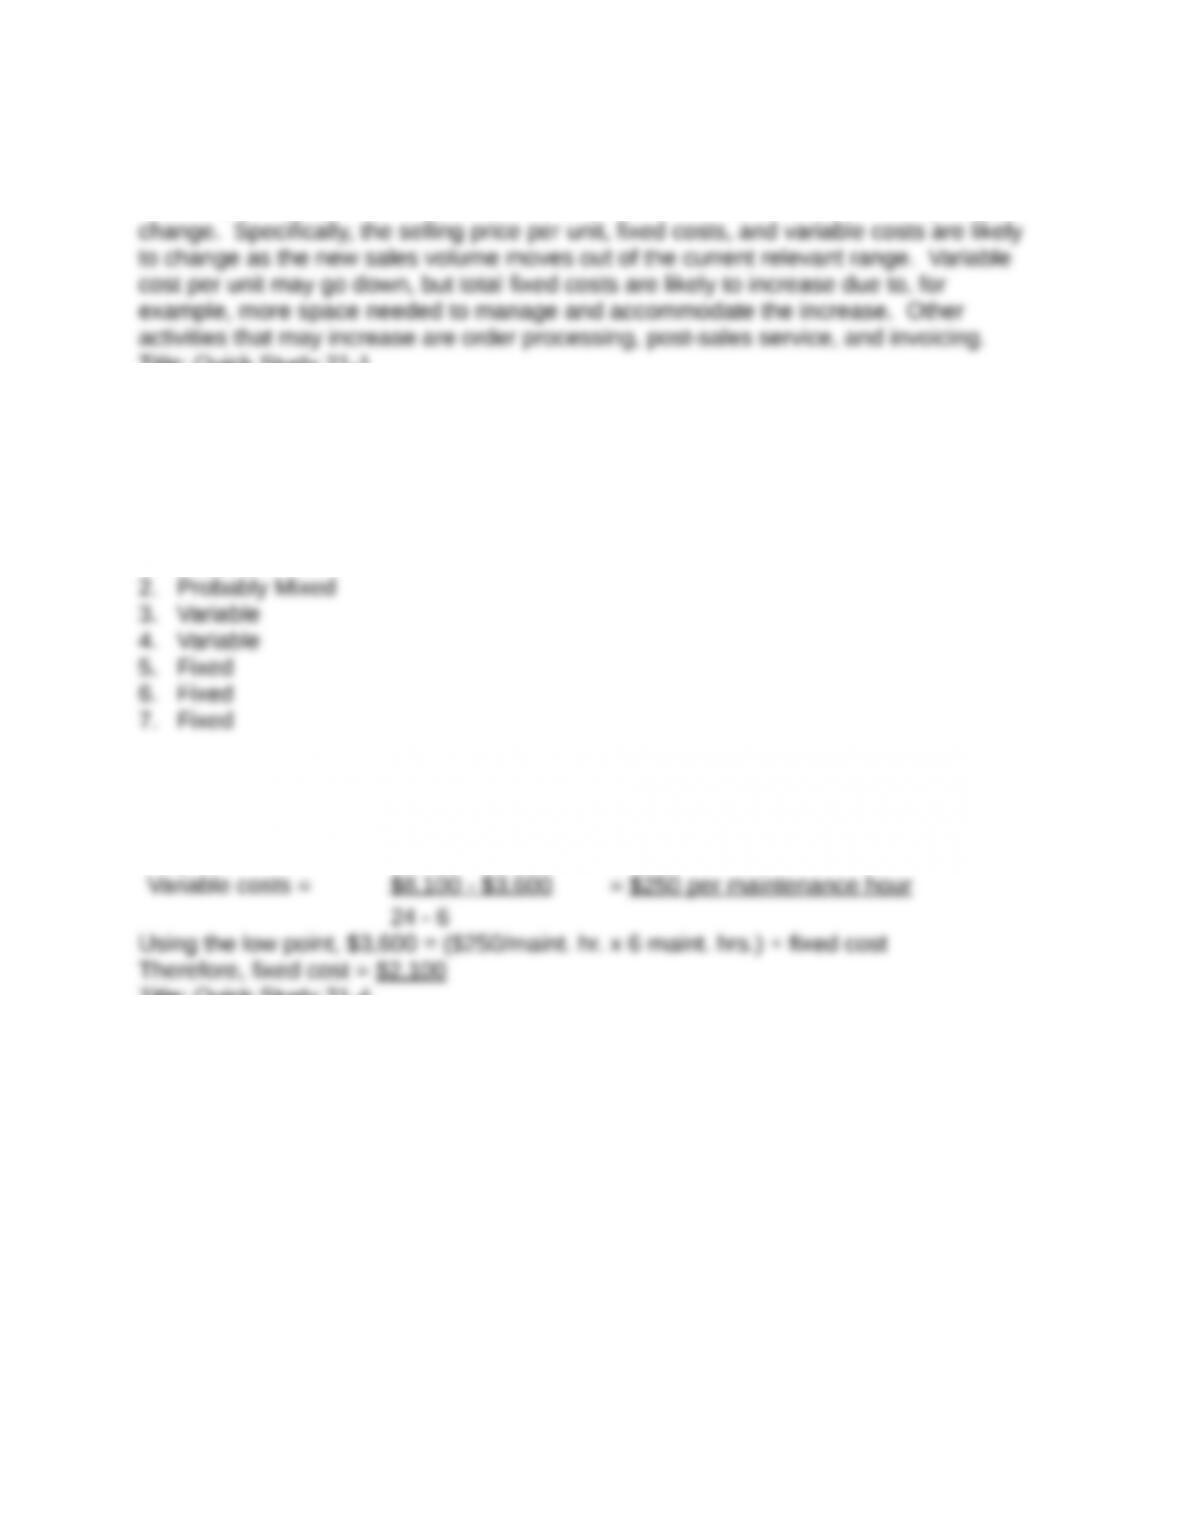
A scatter diagram is used to display the relation between past costs and sales volumes.
Title: Question 14
QA_Ori:
At break-even, profits are zero. Break-even is the point where sales equals fixed plus
variable costs.
Title: Question 15
QA_Ori:
This line represents total cost, which equals the sum of the fixed and variable costs at
Title: Question 16
QA_Ori:
Fixed costs are depicted as a horizontal line on a CVP chart because they remain the
same (constant) at all volume levels within the relevant range.
Title: Question 17
QA_Ori:
Company A has a contribution margin of 50% [($20,000 – $10,000) / ($20,000)] and
Title: Question 18
QA_Ori:
Margin of safety reflects the expected sales in excess of the level of break-even sales.
Title: Question 19
QA_Ori:
Arctic Cat’s primary variable costs in making snowmobiles are: costs of the component
parts (metals, engine parts, seat components, wiring, gauges, etc.), and direct labor.
Title: Question 20
QA_Ori:
Polaris offers a variety of two-, three- and four- wheel vehicles. To adequately
understand its operations, Polaris should compute break-even points for all types of
products sold, that is, it should use multi-product breakeven analysis.
Title: Question 21
QA_Ori:
A 65% increase in sales of a popular scooter model of Piaggio is likely viewed as a
substantial increase. When this occurs, the sales and cost structures are likely to
Title: Quick Study 21-1
QA_Ori:
Series 1 Variable cost Series 3 Step-wise cost
Series 2 Fixed cost Series 4 Curvilinear cost
Title: Quick Study 21-2
QA_Ori:
1. Variable
Title: Quick Study 21-3
QA_Ori:
Title: Quick Study 21-4
QA_Ori:
1. Estimated line of cost behavior
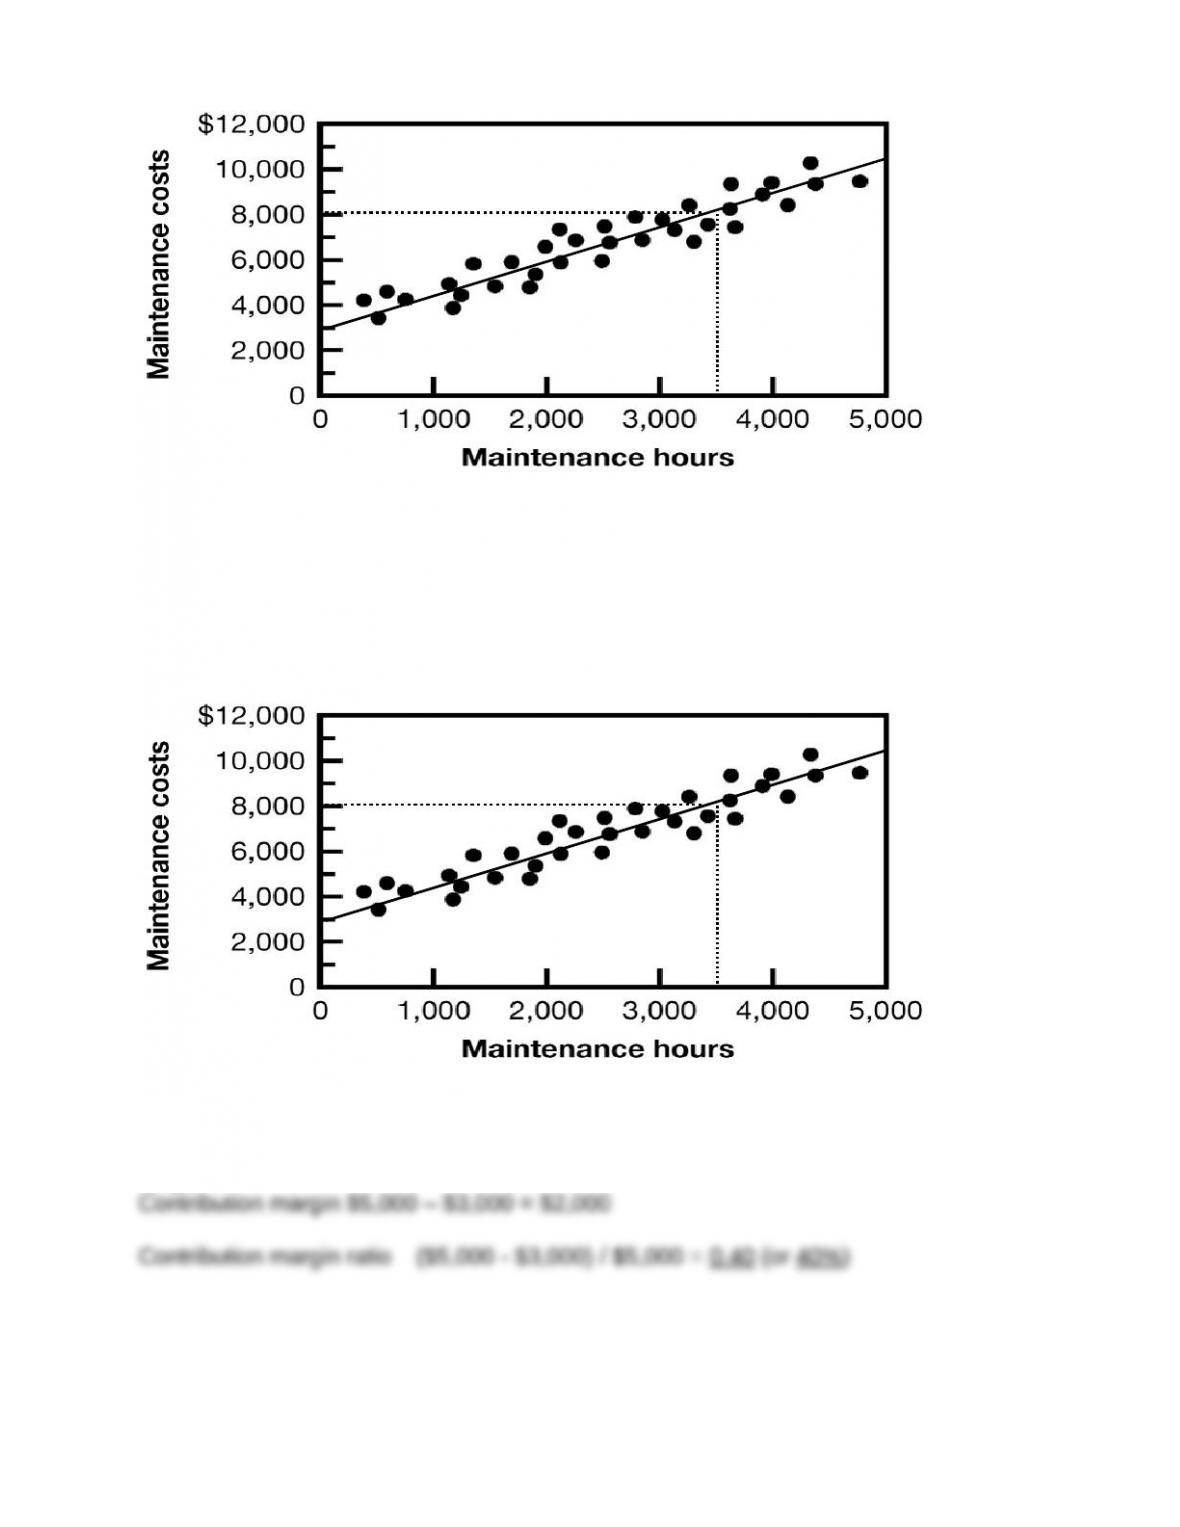
2. Estimated cost components
Instructor note: Answers to part 2 can vary slightly depending on where students draw
the cost line.
*(rounded)
Title: Quick Study 21-5
QA_Ori:
Interpretation: This result indicates 40 cents of each sales dollar is available to cover
fixed costs and contribute to profit.
Title: Quick Study 21-6
QA_Ori:
Title: Quick Study 21-7
QA_Ori:
1. I
Title: Quick Study 21-8
QA_Ori:
Title: Quick Study 21-9
QA_Ori:
Title: Quick Study 21-10
QA_Ori:
Correct (true) answer is 2.
Title: Quick Study 21-11
QA_Ori:
Company B is likely to have a higher degree of operating leverage (DOL).
Explanation: Company B has a relatively low proportion of variable costs to total costs.
This means that the contribution margin (sales - variable costs) for Company B is
Company A.
Title: Quick Study 21-12
QA_Ori:
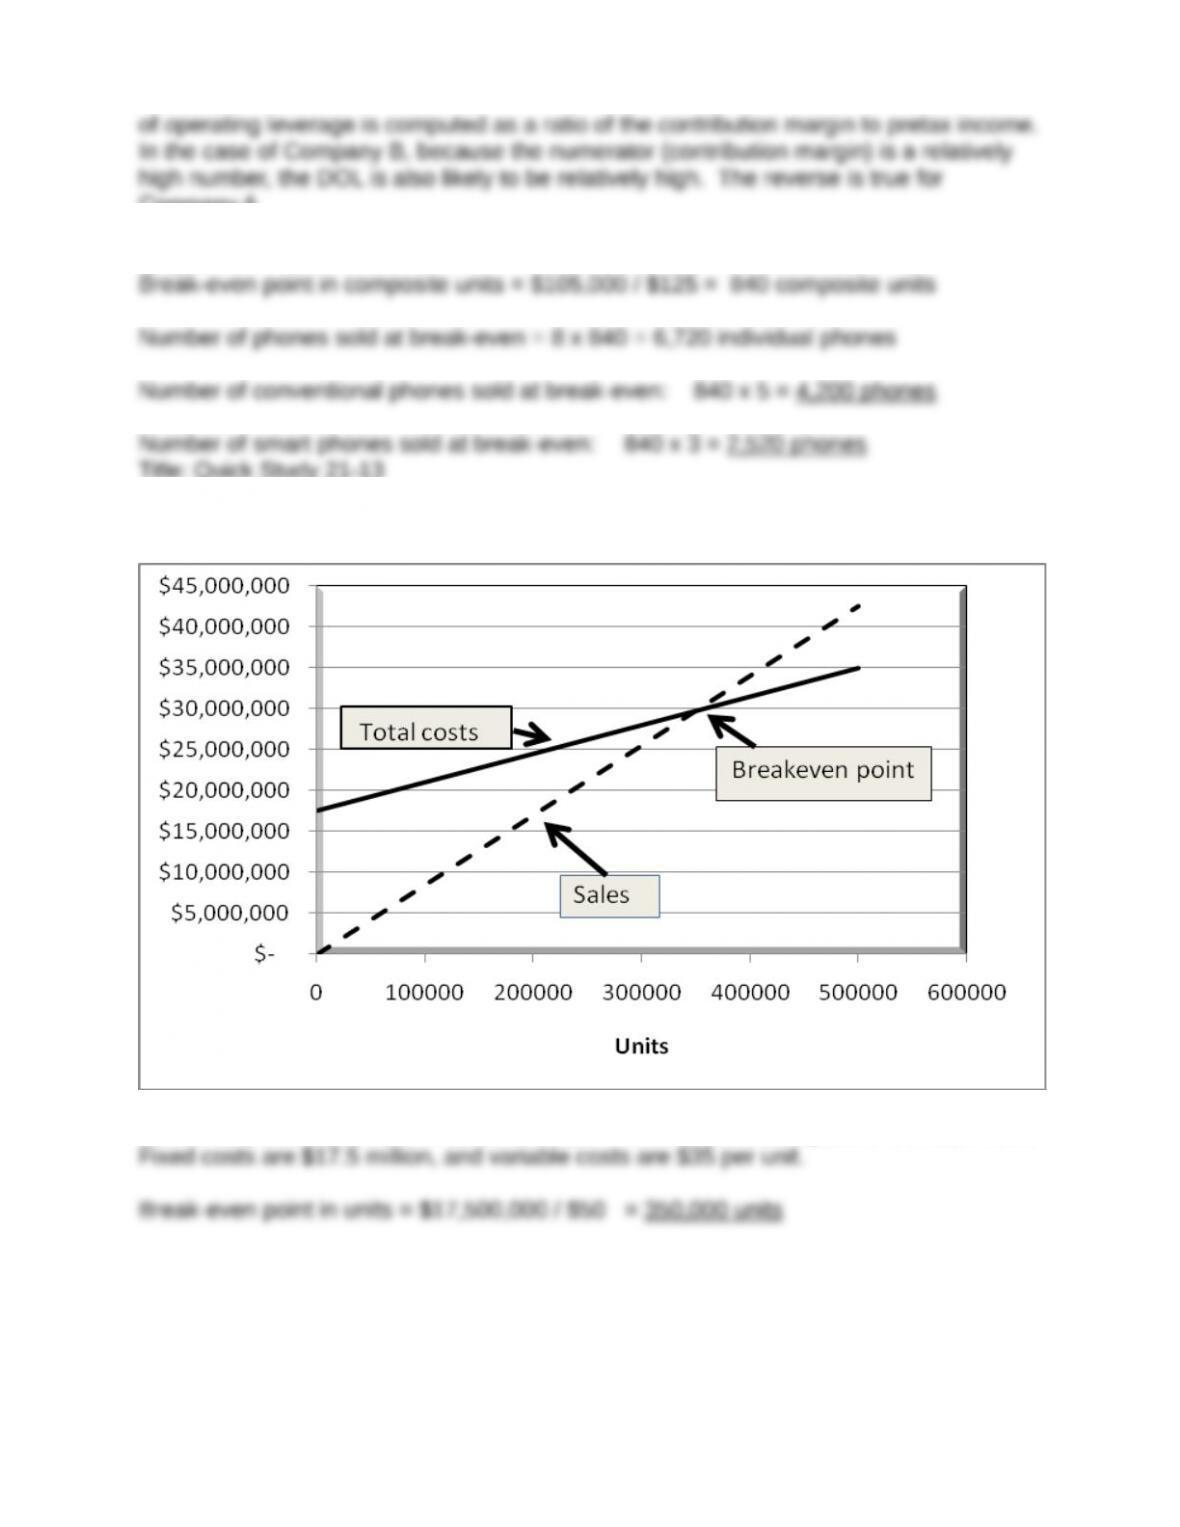
Title: Quick Study 21-13
QA_Ori:
CVP Chart
Notes: Expected sales are 400,000 units ($34 million), thus selling price is $85 per unit.
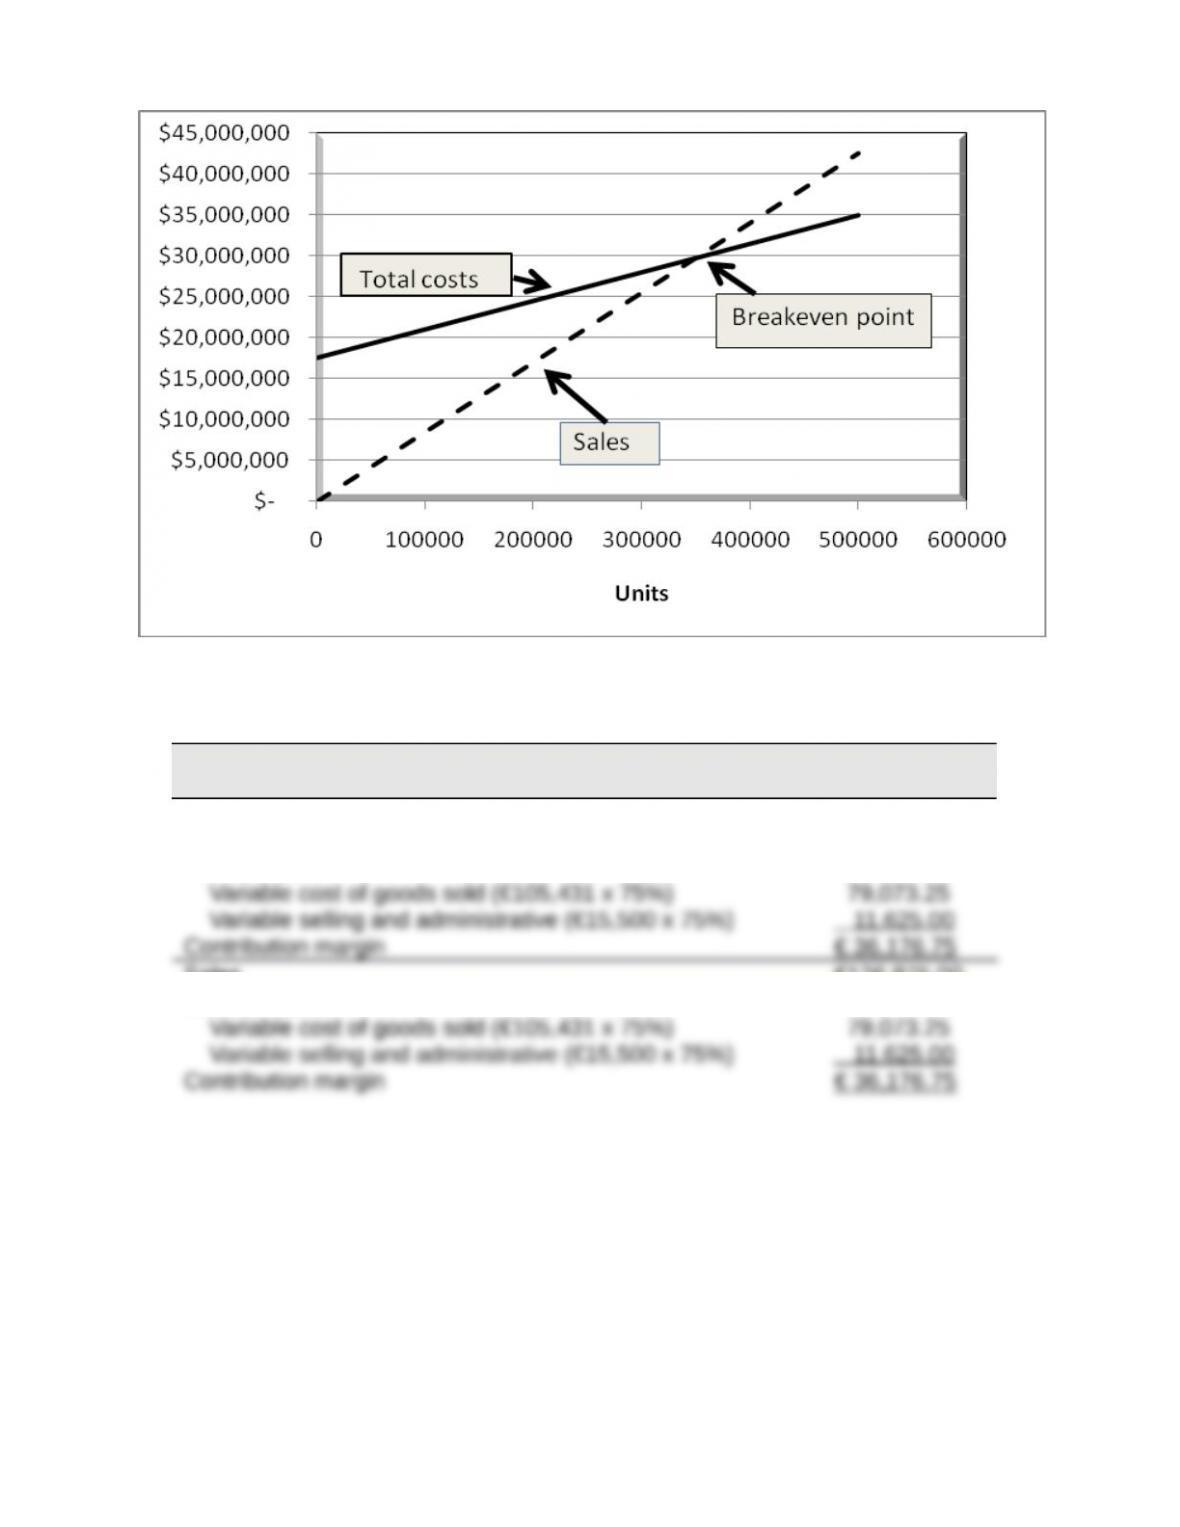
Title: Quick Study 21-14
QA_Ori:
VOLKSWAGEN
Contribution Margin Statement (in € millions)
Sales €126,875.00
Variable costs:
Sales €126,875.00
Variable costs:
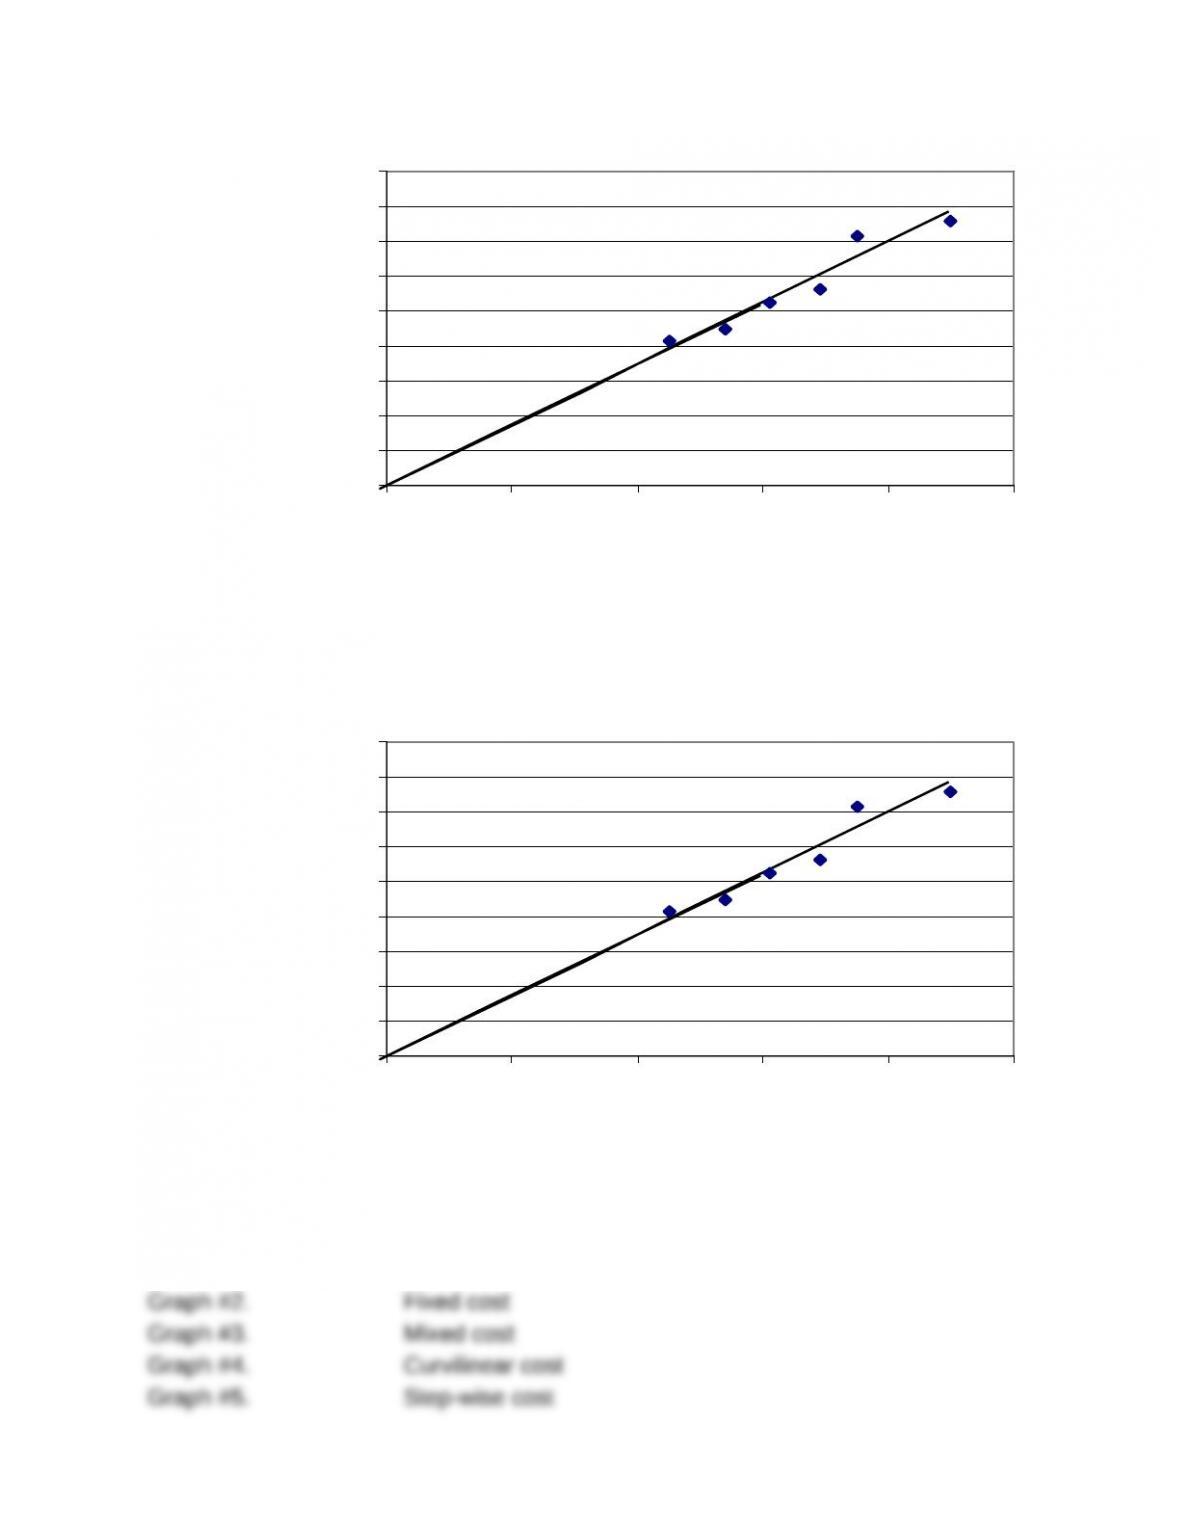
Title: Exercise 21-1
QA_Ori:
The scatter diagram and its estimated line of cost behavior appear below
$ 0
$2,000
$4,000
$6,000
$8,000
$10,000
$12,000
$14,000
$16,000
$18,000
$0 $5,000 $10,000 $15,000 $20,000 $25,000
Sales
Cost of sales
$ 0
$2,000
$4,000
$6,000
$8,000
$10,000
$12,000
$14,000
$16,000
$18,000
$0 $5,000 $10,000 $15,000 $20,000 $25,000
Sales
Cost of sales
The cost line appears to reflect a variable cost because it increases at a reasonably
constant rate with changes in sales and it appears to intersect the cost axis at zero (the
origin).
Title: Exercise 21-2
QA_Ori:
1.
Graph #1. Variable cost
2.
6. C
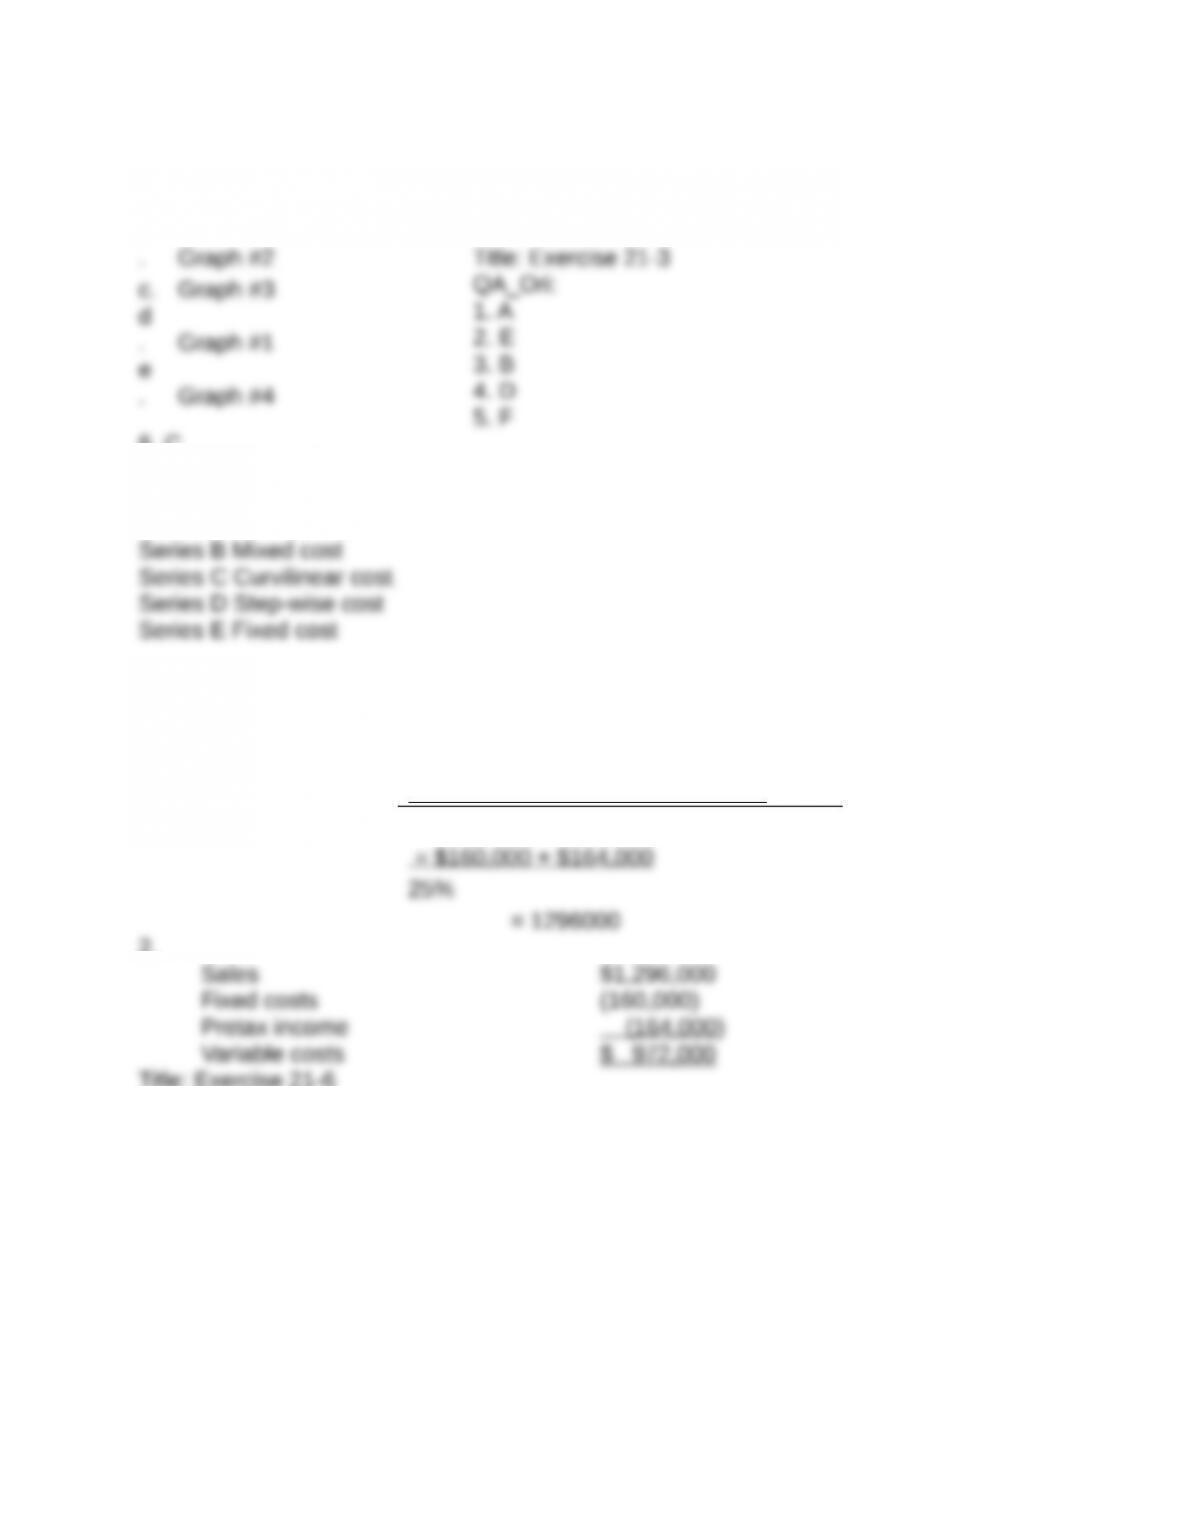
Title: Exercise 21-4
QA_Ori:
Series A Variable cost
Title: Exercise 21-5
QA_Ori:
1 Dollar sales = Fixed costs + Target pretax income
Contribution margin ratio
2.
Title: Exercise 21-6
QA_Ori:
a
. Graph #5
b
The scatter diagram and its estimated line of cost behavior appear below.
The cost pattern appears to exhibit a step-wise pattern.
QA_Edit:


