Unlock document.
This document is partially blurred.
Unlock all pages and 1 million more documents.
Get Access
Chapter 21
Cost-Volume-Profit Analysis
QUESTIONS
1. A variable cost is one that varies proportionately with the volume of activity. For
2. Variable costs per unit stay the same (remain constant) when output volume
3. Fixed costs per unit decrease when output volume increases. This is because the
4. Cost-volume-profit analysis is especially useful in the planning phase for a
5. A step-wise cost remains constant over a limited range of output activity, outside of
6. Contribution margin ratio means that for each sales dollar a specified percent is
7. Definition: Contribution margin ratio = Contribution margin / Sales price per unit.
8. Definition: Unit contribution margin = Sales price per unit - Variable costs per unit.
9. A CVP analysis for a manufacturing company is simplified by assuming that the
Fundamental Accounting Principles, 21st Edition
1216
10. The first is that although individual costs classified as fixed or variable might not
behave precisely in those patterns, some variations of individual components in the
11. By assuming a relevant range for operating activity, management can more
justifiably assume either fixed or variable relations between costs and volume, and
12. Three common methods for measuring cost behavior are: the scatter diagram, the
high-low method, and least-squares regression.
13. A scatter diagram is used to display the relation between past costs and sales
14. At break-even, profits are zero. Break-even is the point where sales equals fixed
plus variable costs.
15. This line represents total cost, which equals the sum of the fixed and variable costs
16. Fixed costs are depicted as a horizontal line on a CVP chart because they remain the
same (constant) at all volume levels within the relevant range.
17. Company A has a contribution margin of 50% [($20,000 – $10,000) / ($20,000)] and
Company B has a contribution margin of 80% [($20,000 – $4,000) / ($20,000)]. This
18. Margin of safety reflects the expected sales in excess of the level of break-even
sales.
19. Arctic Cat’s primary variable costs in making snowmobiles are: costs of the
component parts (metals, engine parts, seat components, wiring, gauges, etc.), and
20. Polaris offers a variety of two-, three- and four- wheel vehicles. To adequately
21. A 65% increase in sales of a popular scooter model of Piaggio is likely viewed as a
substantial increase. When this occurs, the sales and cost structures are likely to
change. Specifically, the selling price per unit, fixed costs, and variable costs are
QUICK STUDIES
Quick Study 21-1 (10 minutes)
Quick Study 21-2 (10 minutes)
Quick Study 21-3 (10 minutes)
Quick Study 21-4 (15 minutes)
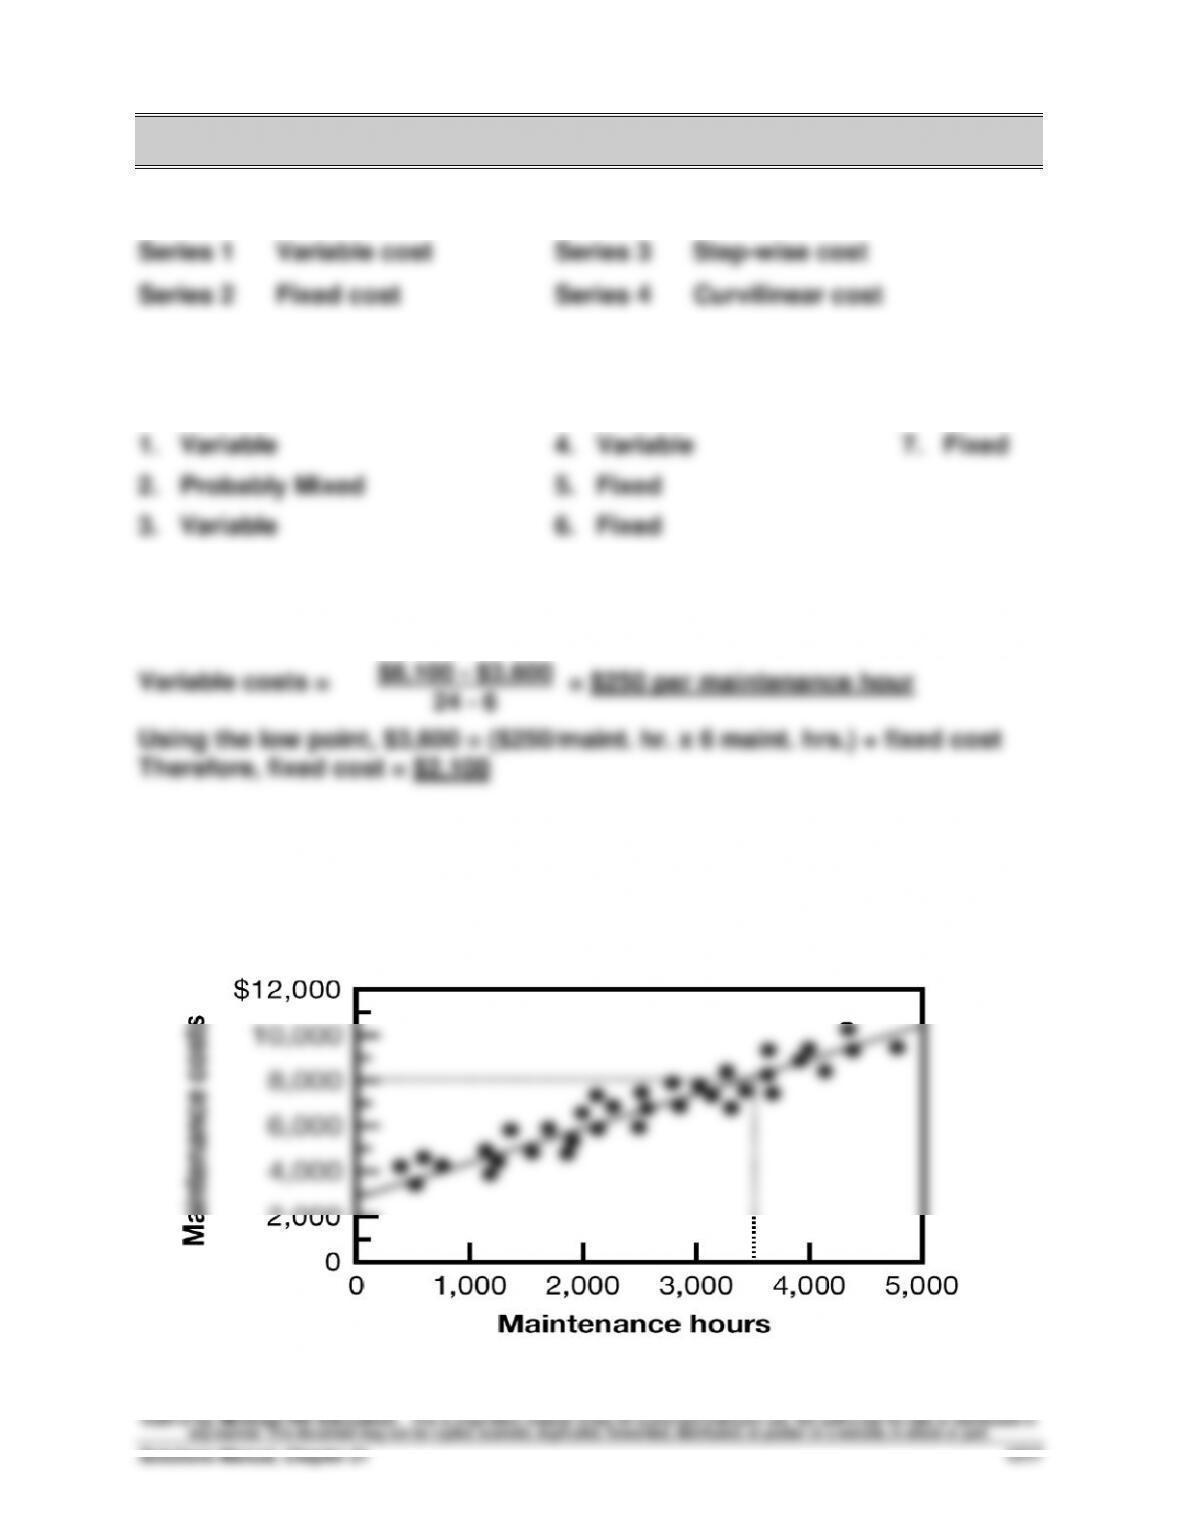
1. Estimated line of cost behavior
$8,100 - $3,600
Quick Study 21-4 (Concluded)
2. Estimated cost components
Fixed costs = $3,000
Quick Study 21-5 (10 minutes)
Contribution margin $5,000 – $3,000 = $2,000
Quick Study 21-6 (10 minutes)
1. Contribution margin per unit = $90 - $36 = $54
Quick Study 21-7 (10 minutes)
Quick Study 21-8 (10 minutes)
$54
Quick Study 21-9 (10 minutes)
Pretax income = $140,000 / (1 - 0.30) = $200,000
Quick Study 21-10 (5 minutes)
Quick Study 21-11 (15 minutes)
Company B is likely to have a higher degree of operating leverage (DOL).
Explanation: Company B has a relatively low proportion of variable costs to
total costs. This means that the contribution margin (sales - variable costs)
Quick Study 21-12 (10 minutes)
Break-even point in composite units = $105,000 / $125 = 840 composite units
$54
Fundamental Accounting Principles, 21st Edition
1220
Quick Study 21-13 (10 minutes)
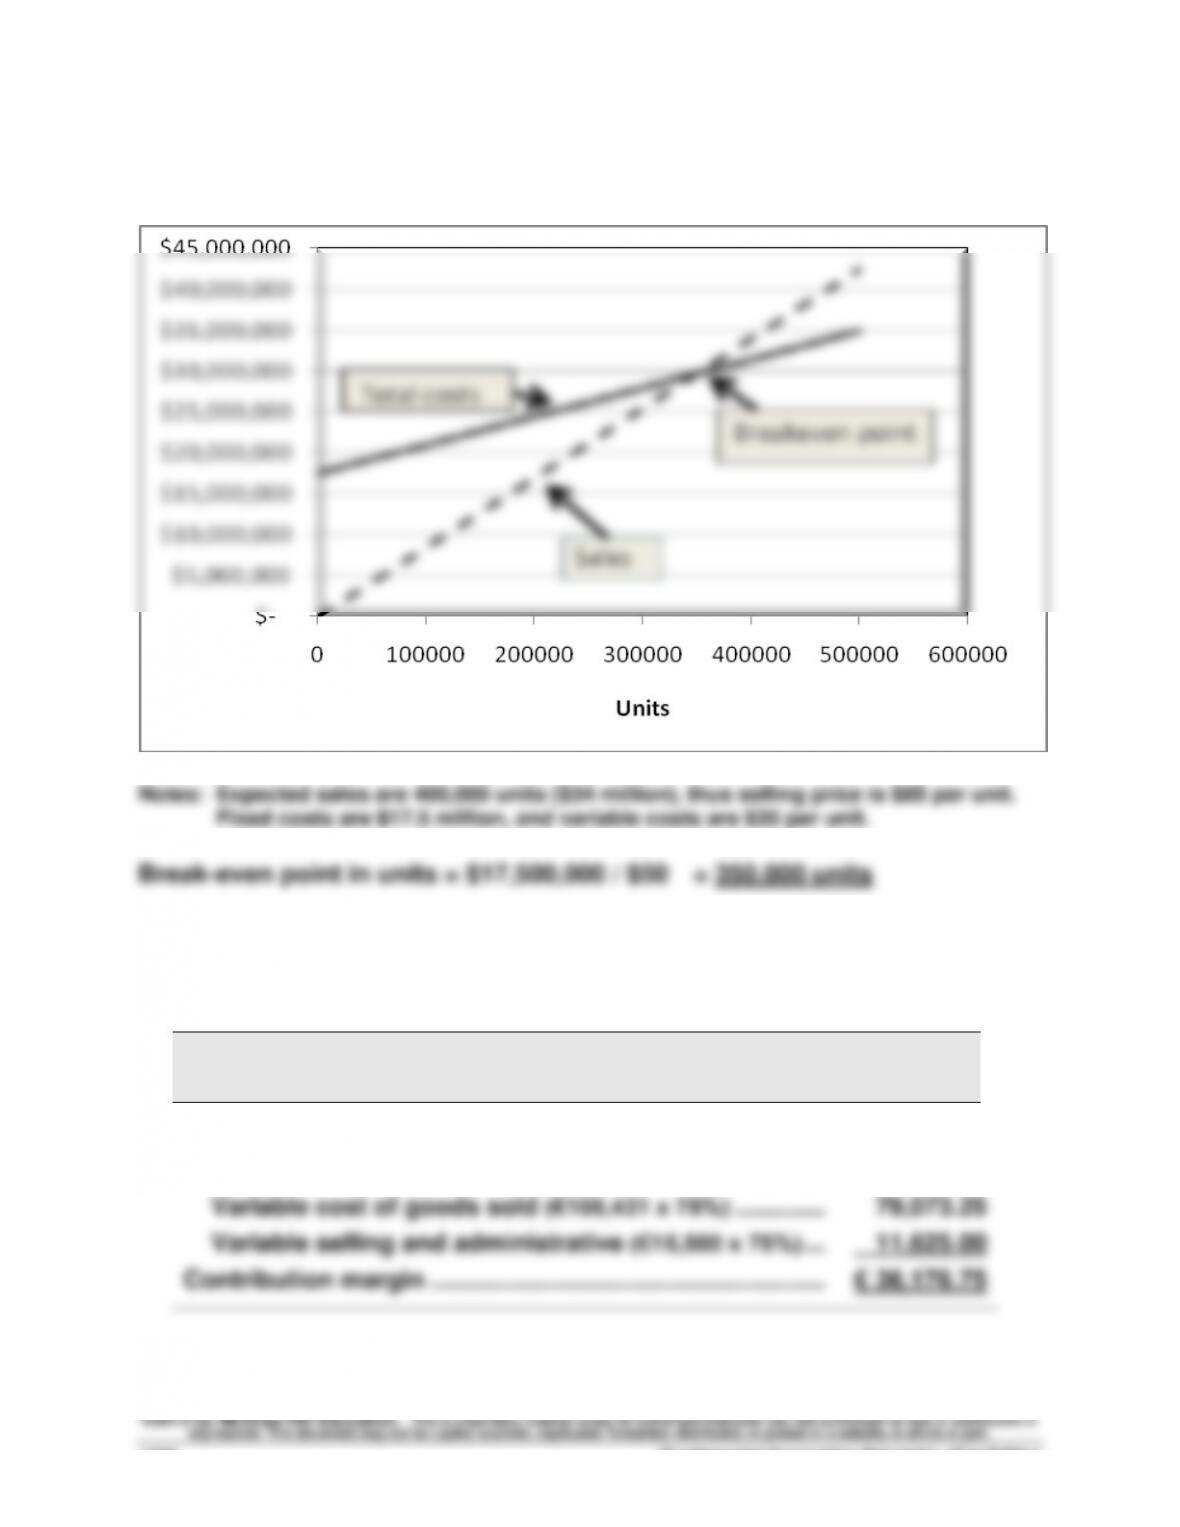
CVP Chart
Quick Study 21-14 (10 minutes)
VOLKSWAGEN
Contribution Margin Statement (in € millions)
Sales ................................................................................................
€126,875.00
Variable costs:
Variable cost of goods sold (€105,431 x 75%) ..............................
79,073.25
Variable selling and administrative (€15,500 x 75%) ....................
11,625.00
Contribution margin ................................................................
€ 36,176.75
EXERCISES
Exercise 21-1 (20 minutes)
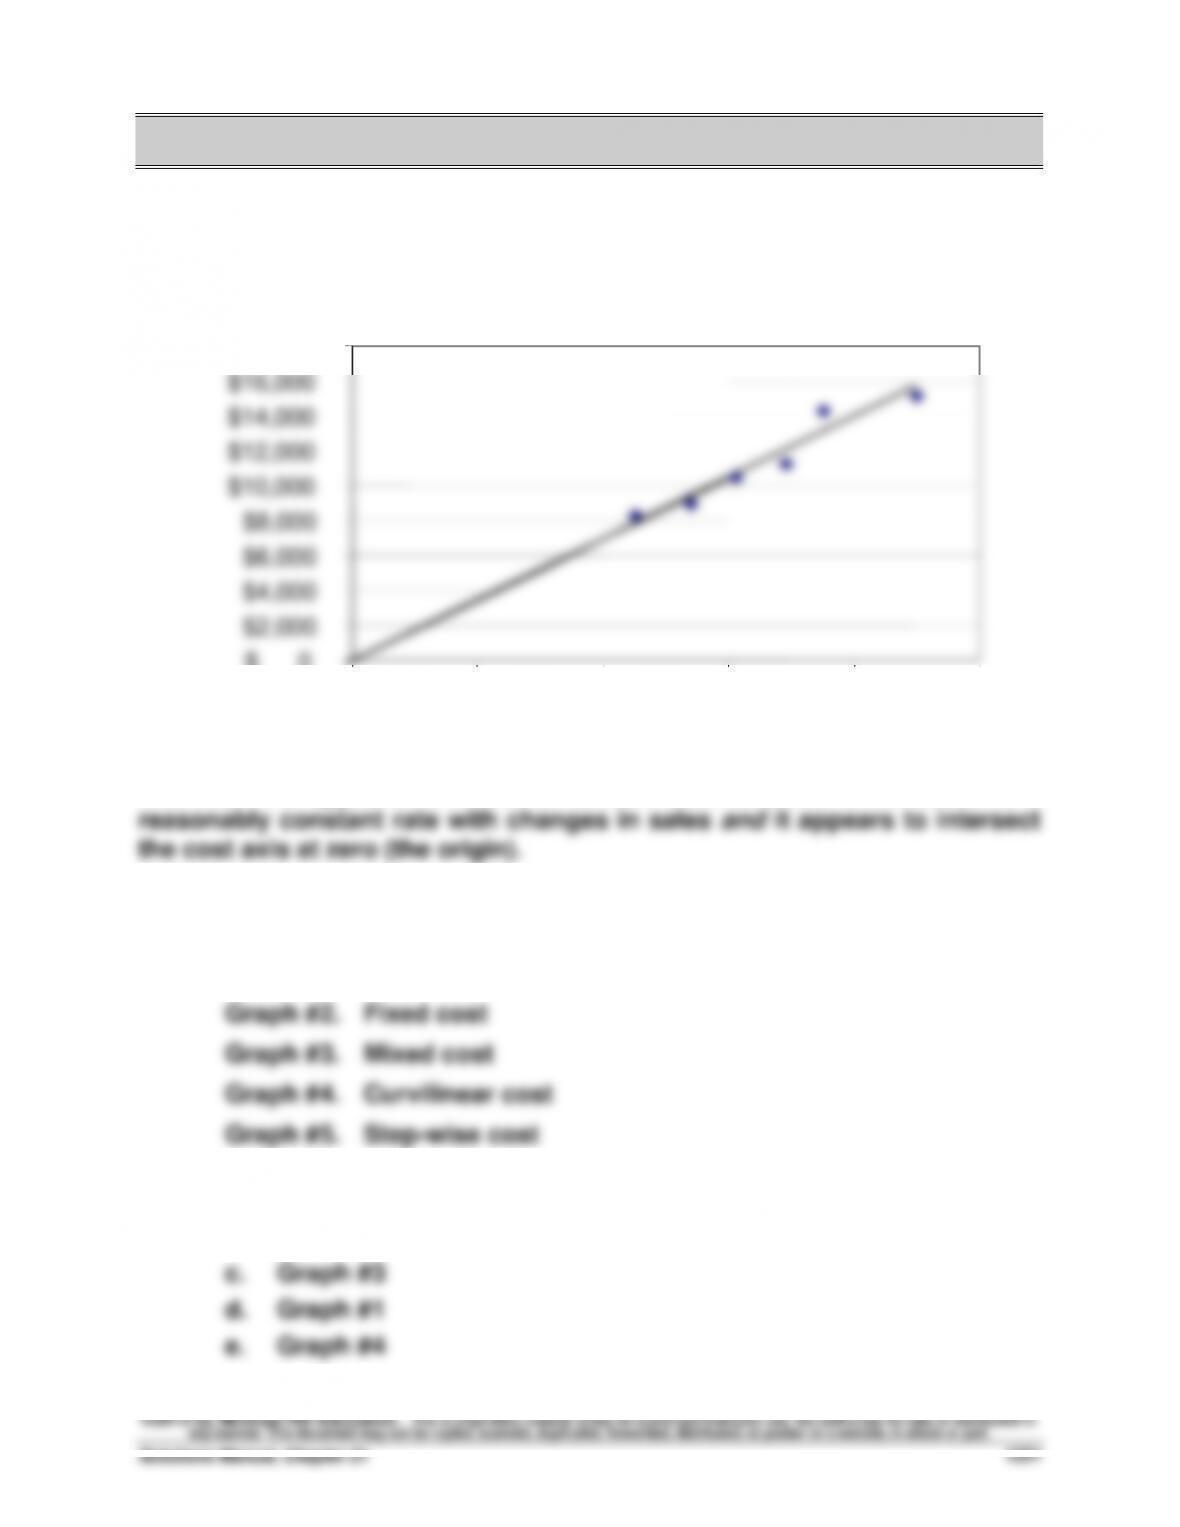
The scatter diagram and its estimated line of cost behavior appear below
The cost line appears to reflect a variable cost because it increases at a
Exercise 21-2 (15 minutes)
1. Graph #1. Variable cost
2. a. Graph #5
b. Graph #2
$ 0
$2,000
$4,000
$6,000
$8,000
$10,000
$12,000
$14,000
$16,000
$18,000
$0
$5,000
$10,000
$15,000
$20,000
$25,000
Sales
Cost of sales
Fundamental Accounting Principles, 21st Edition
1222
Exercise 21-3 (10 minutes)
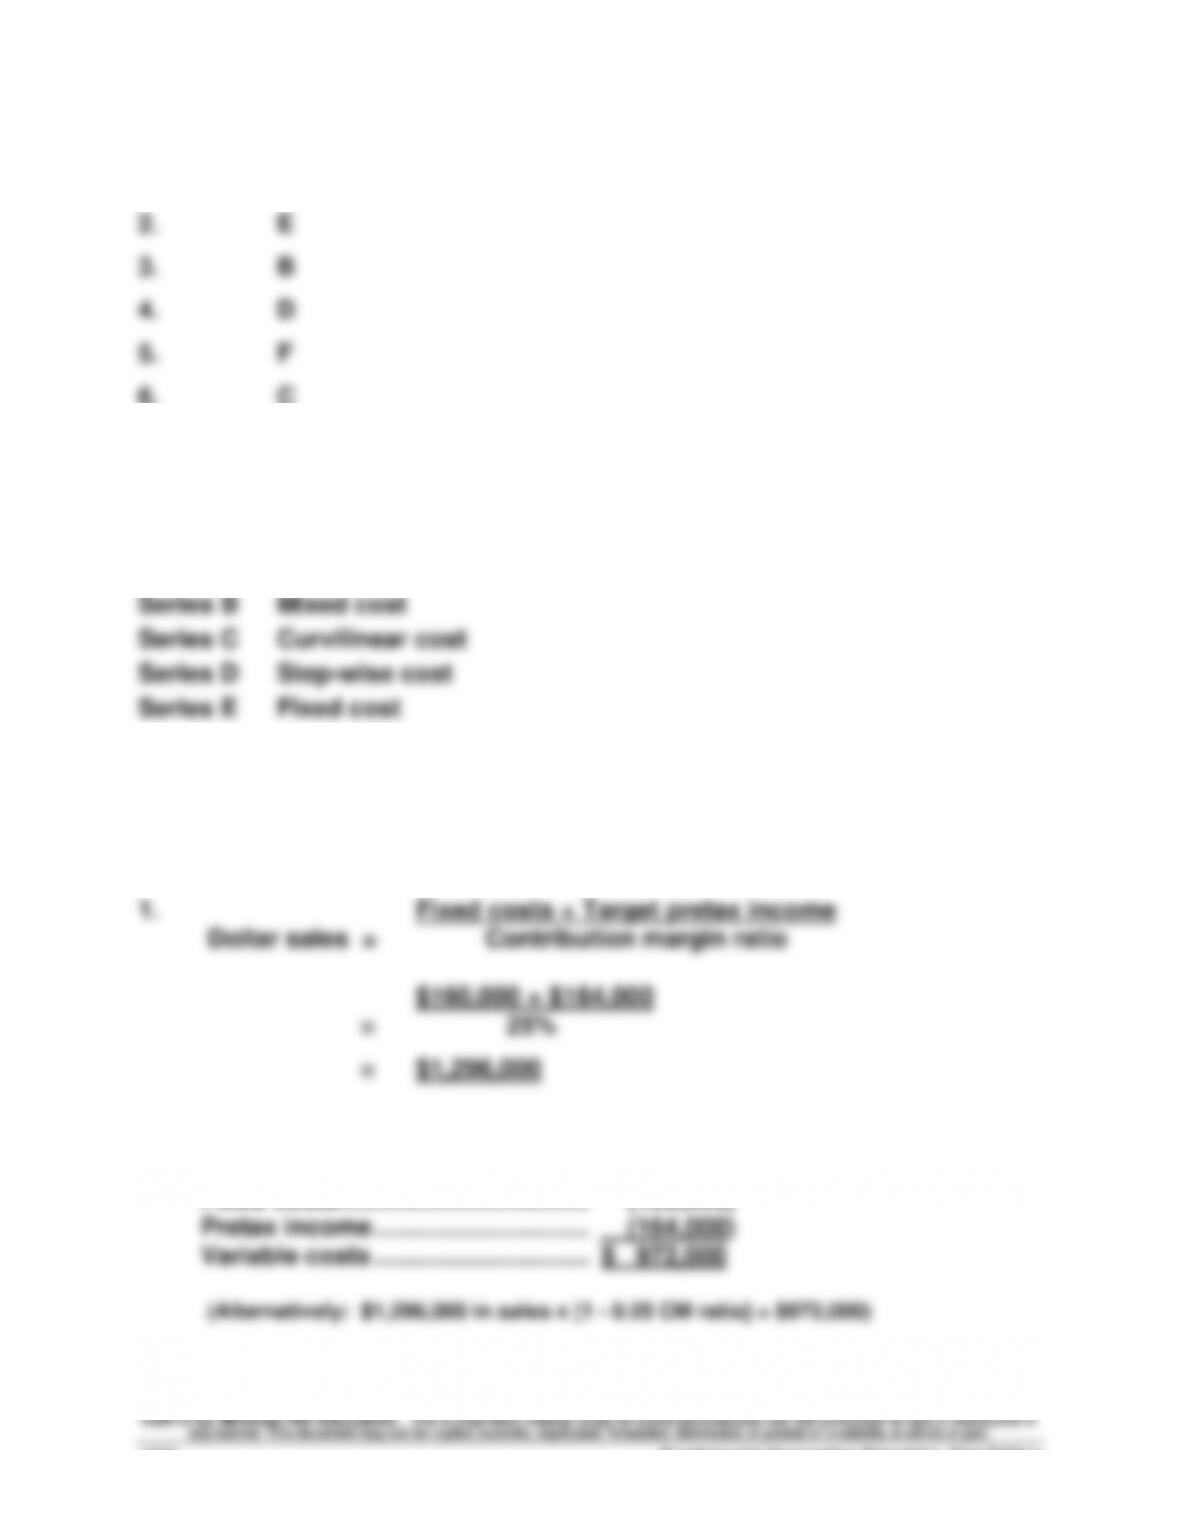
1. A
6. C
Exercise 21-4 (15 minutes)
Series A Variable cost
Exercise 21-5 (20 minutes)
2.
Sales ....................................................
$1,296,000
Fixed costs ..........................................
(160,000)
Pretax income ................................
(164,000)
Variable costs ................................
$ 972,000
(Alternatively: $1,296,000 in sales x [1 - 0.25 CM ratio] = $972,000)
Exercise 21-6 (20 minutes)
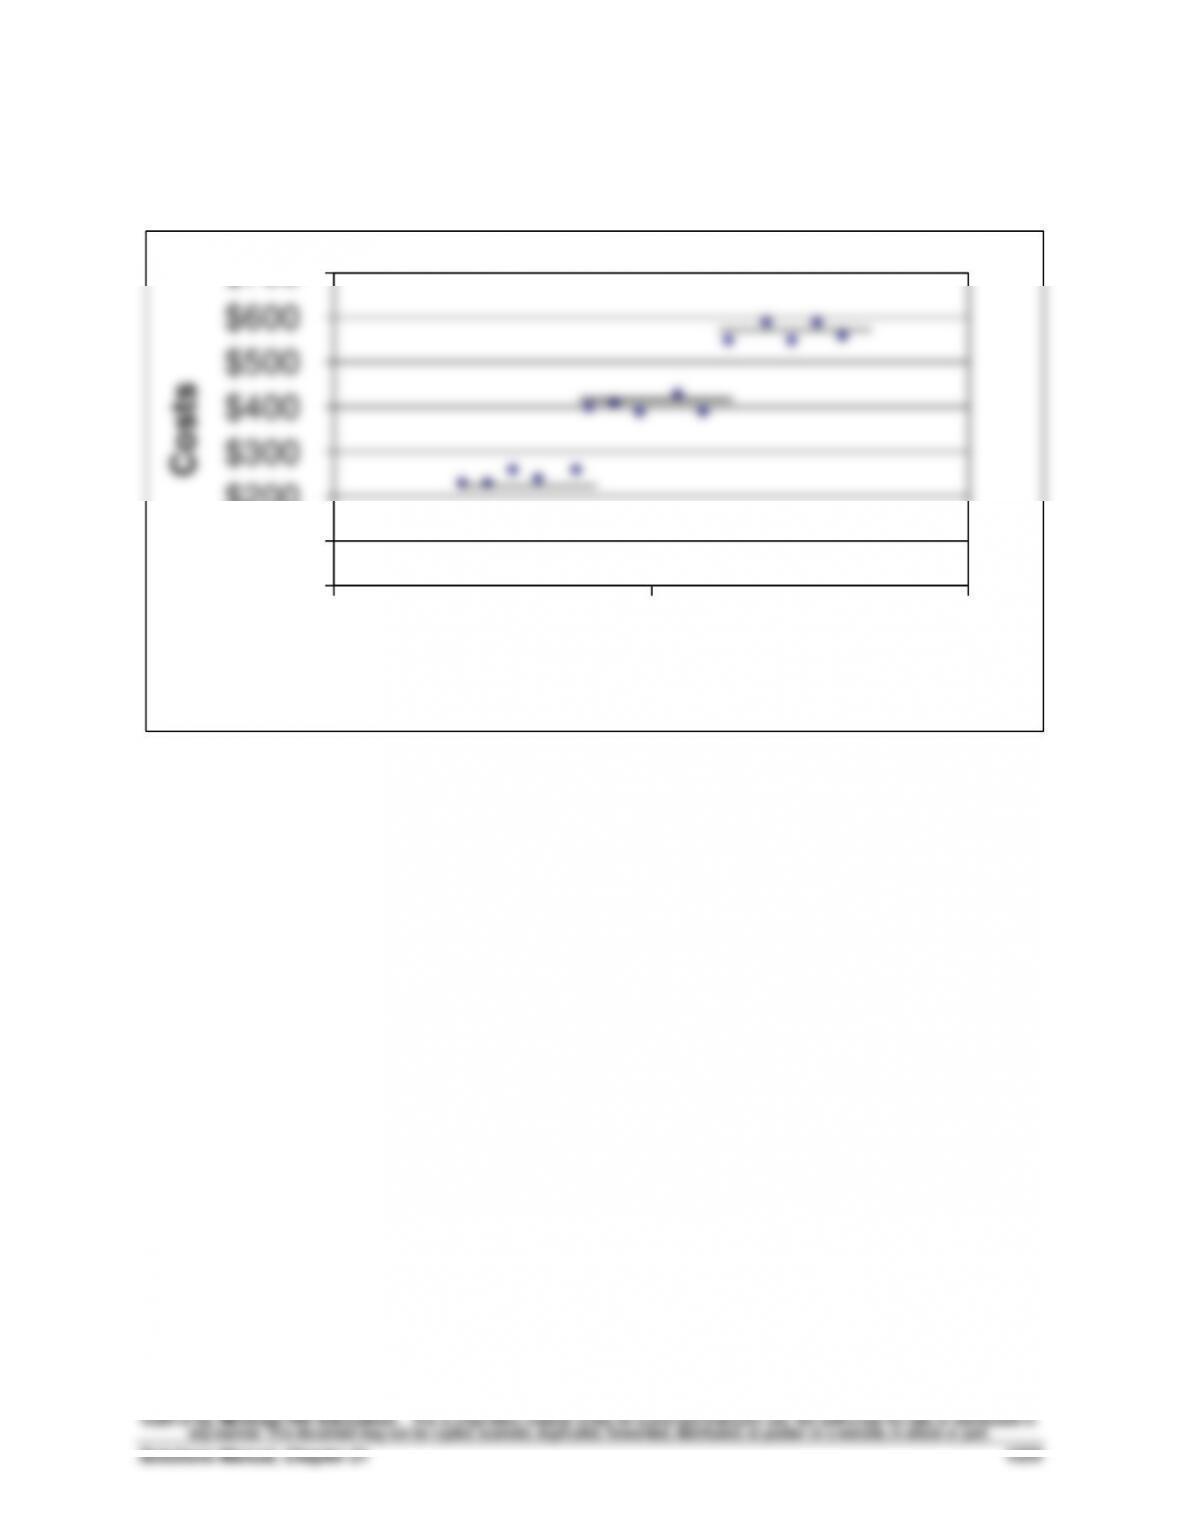
The scatter diagram and its estimated line of cost behavior appear below.
The cost pattern appears to exhibit a step-wise pattern.
$0
$100
$200
$300
$400
$500
$600
$700
$0 $500 $1,000
Costs
Sales
Fundamental Accounting Principles, 21st Edition
1224
Exercise 21-7 (20 minutes)
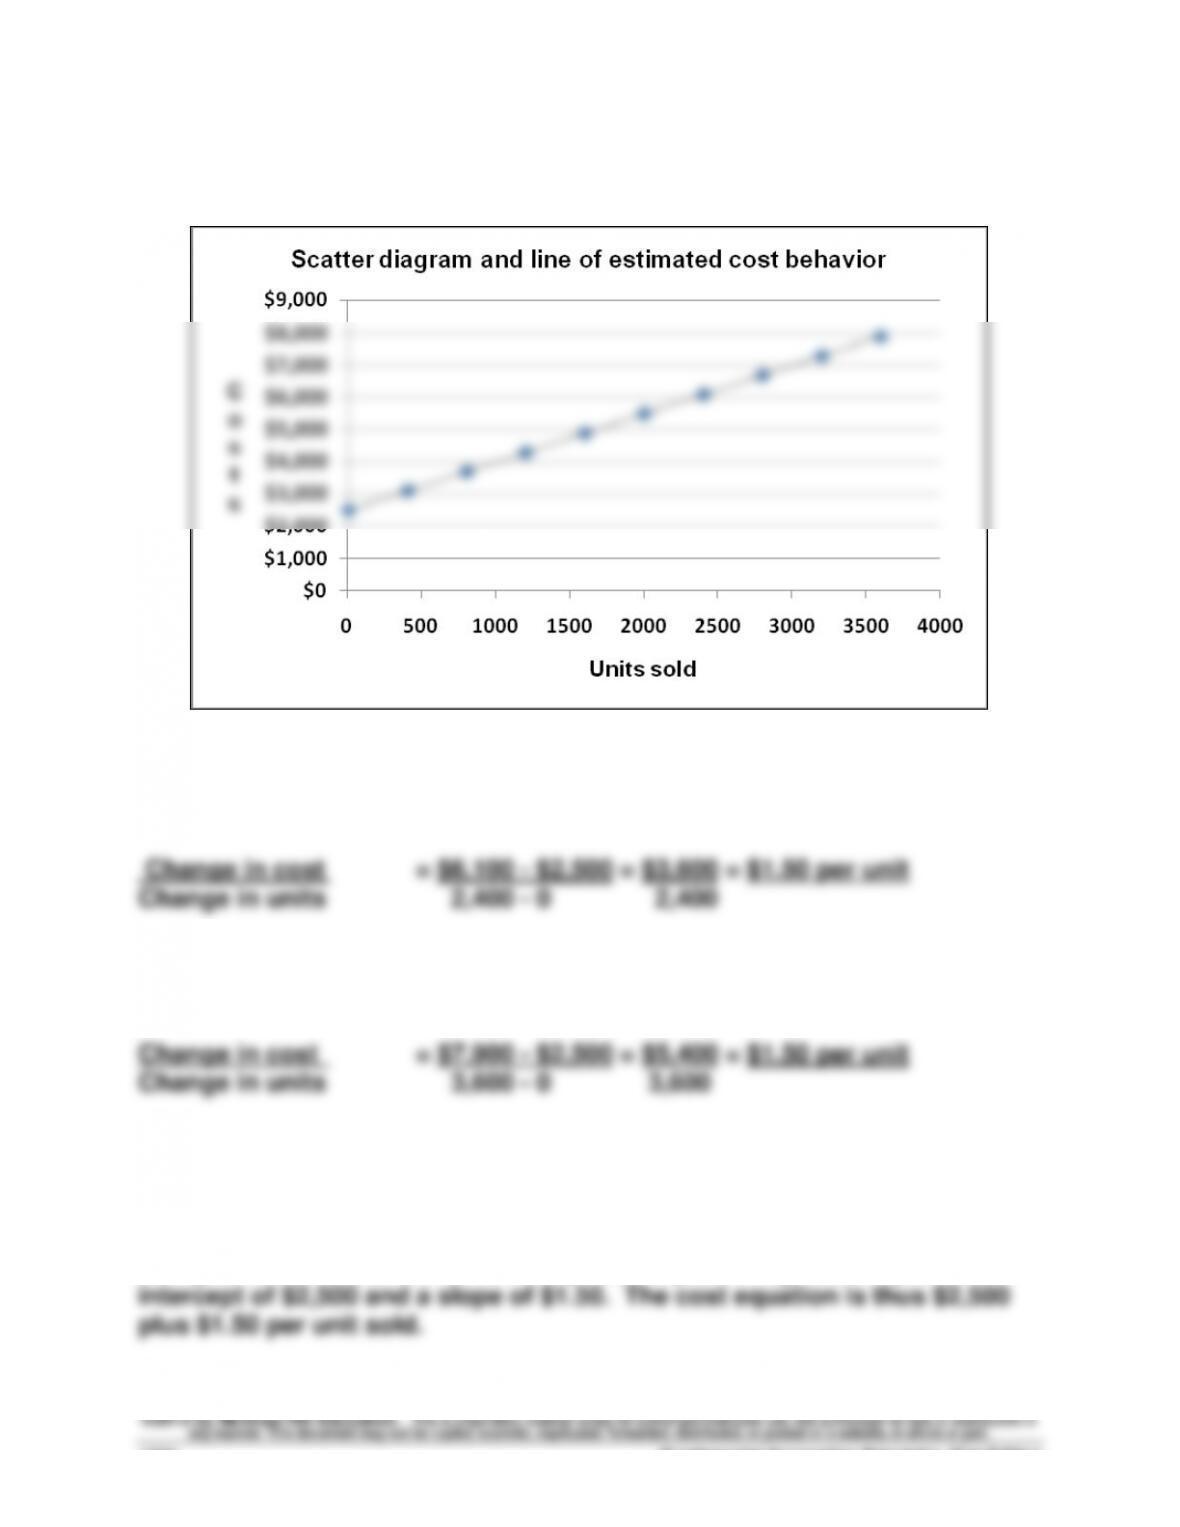
The scatter diagram and line of estimated cost behavior appear below.
Selecting 0 and 2,400 units sold as the activity levels yields $2,500 as the
estimate of fixed costs and the following estimate of variable costs per
unit:
Using the high-low method yields $2,500 as the estimate of fixed costs and
variable costs per unit of:
Exercise 21-8A (20 minutes)
Using Excel® to estimate an ordinary least squares regression yields an
Exercise 21-9 (10 minutes)
(1) Contribution margin = Selling price – Variable costs
= $205 - $164 = $41 per unit
Exercise 21-10 (30 minutes)
(a) Contribution margin per unit = $180 – $135 = $45 per unit
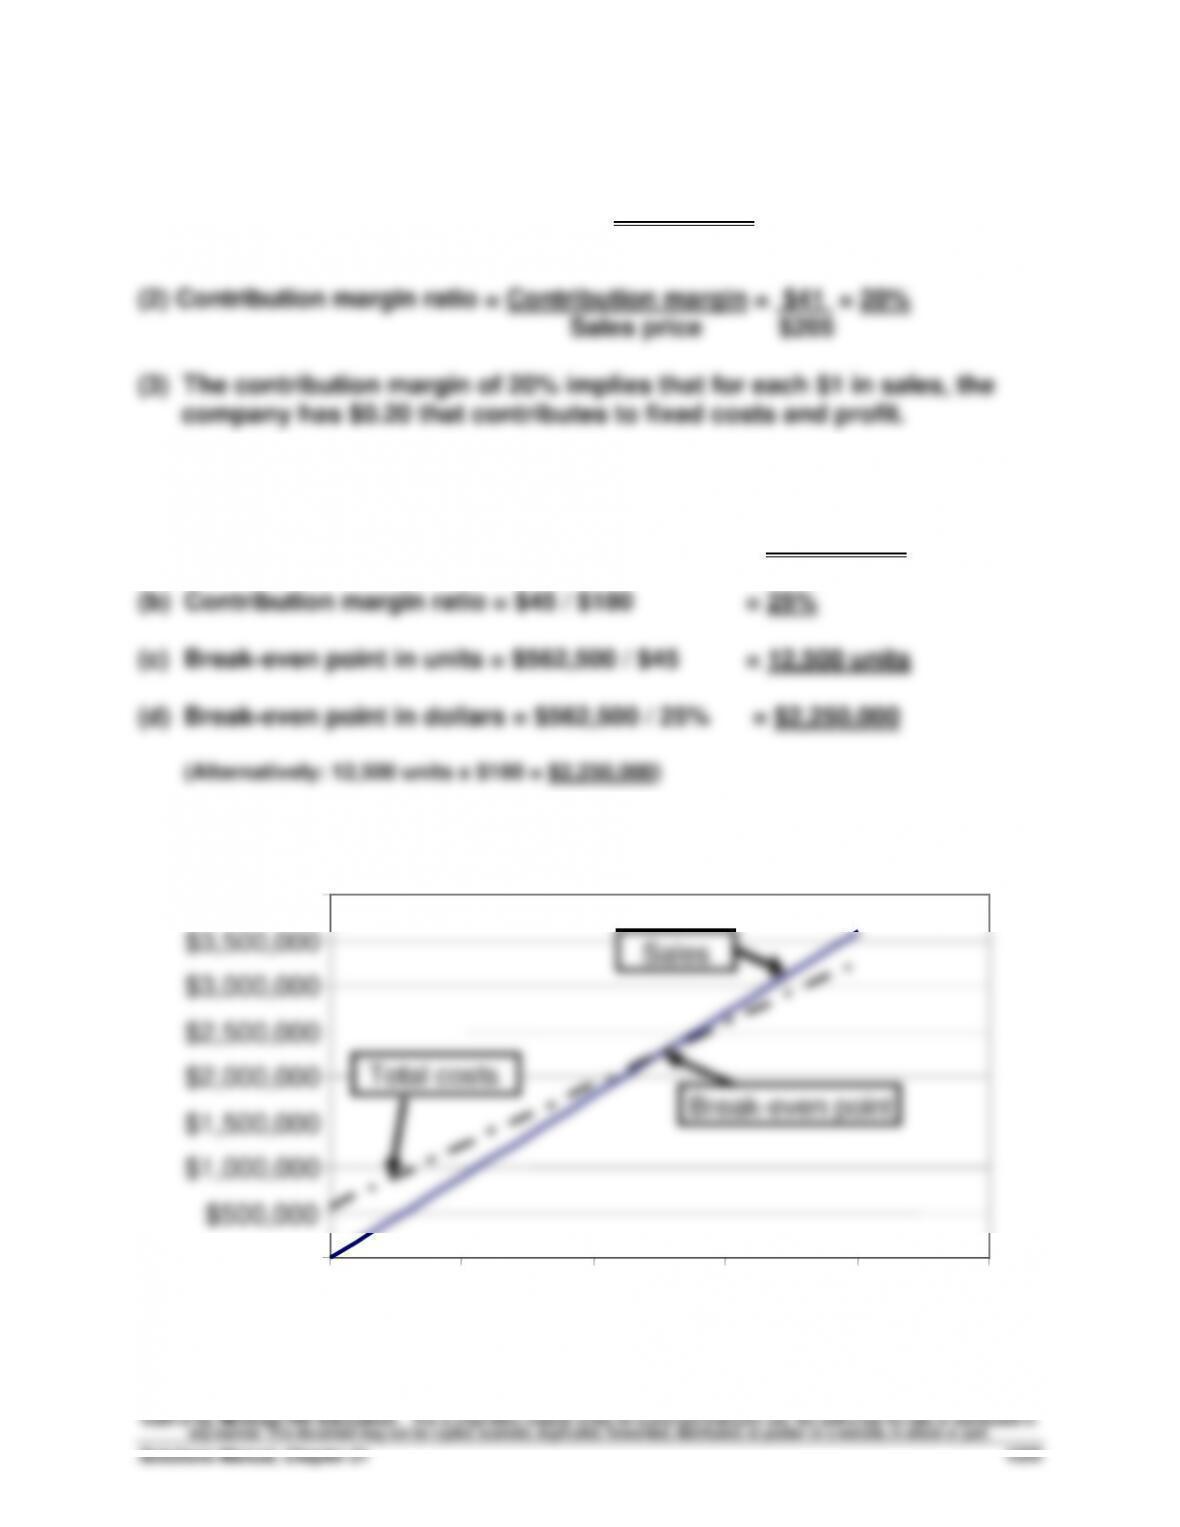
Exercise 21-11 (15 minutes)
$0
$500,000
$1,000,000
$1,500,000
$2,000,000
$2,500,000
$3,000,000
$3,500,000
$4,000,000
0
5,000
10,000
15,000
20,000
25,000
Units
Sales
Total costs
Break-even point
Fundamental Accounting Principles, 21st Edition
1226
Exercise 21-12 (20 minutes)
1.
BLANCHARD COMPANY
Contribution Margin Income Statement (at Break-Even)
Sales (12,500 x $180) ..........................................................................
$2,250,000
Variable costs (12,500 x $135) ...........................................................
1,687,500
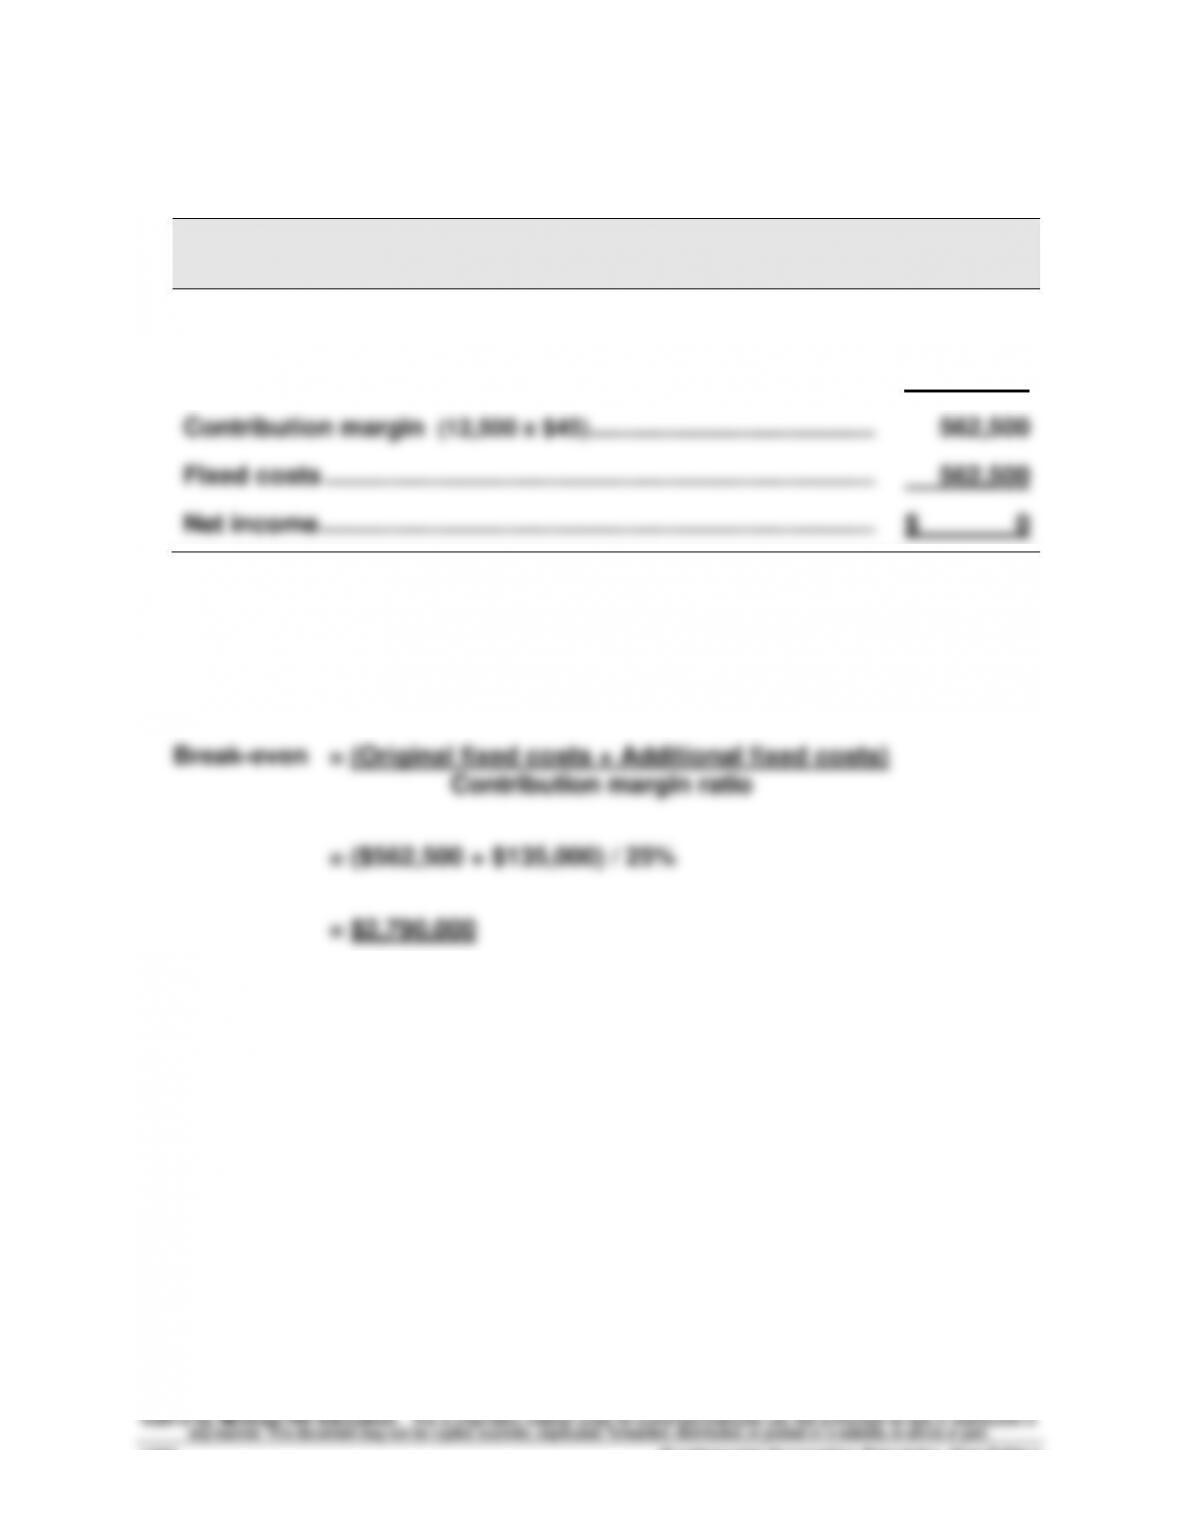
Contribution margin (12,500 x $45) ...................................................
562,500
Fixed costs .........................................................................................
562,500
Net income ..........................................................................................
$ 0
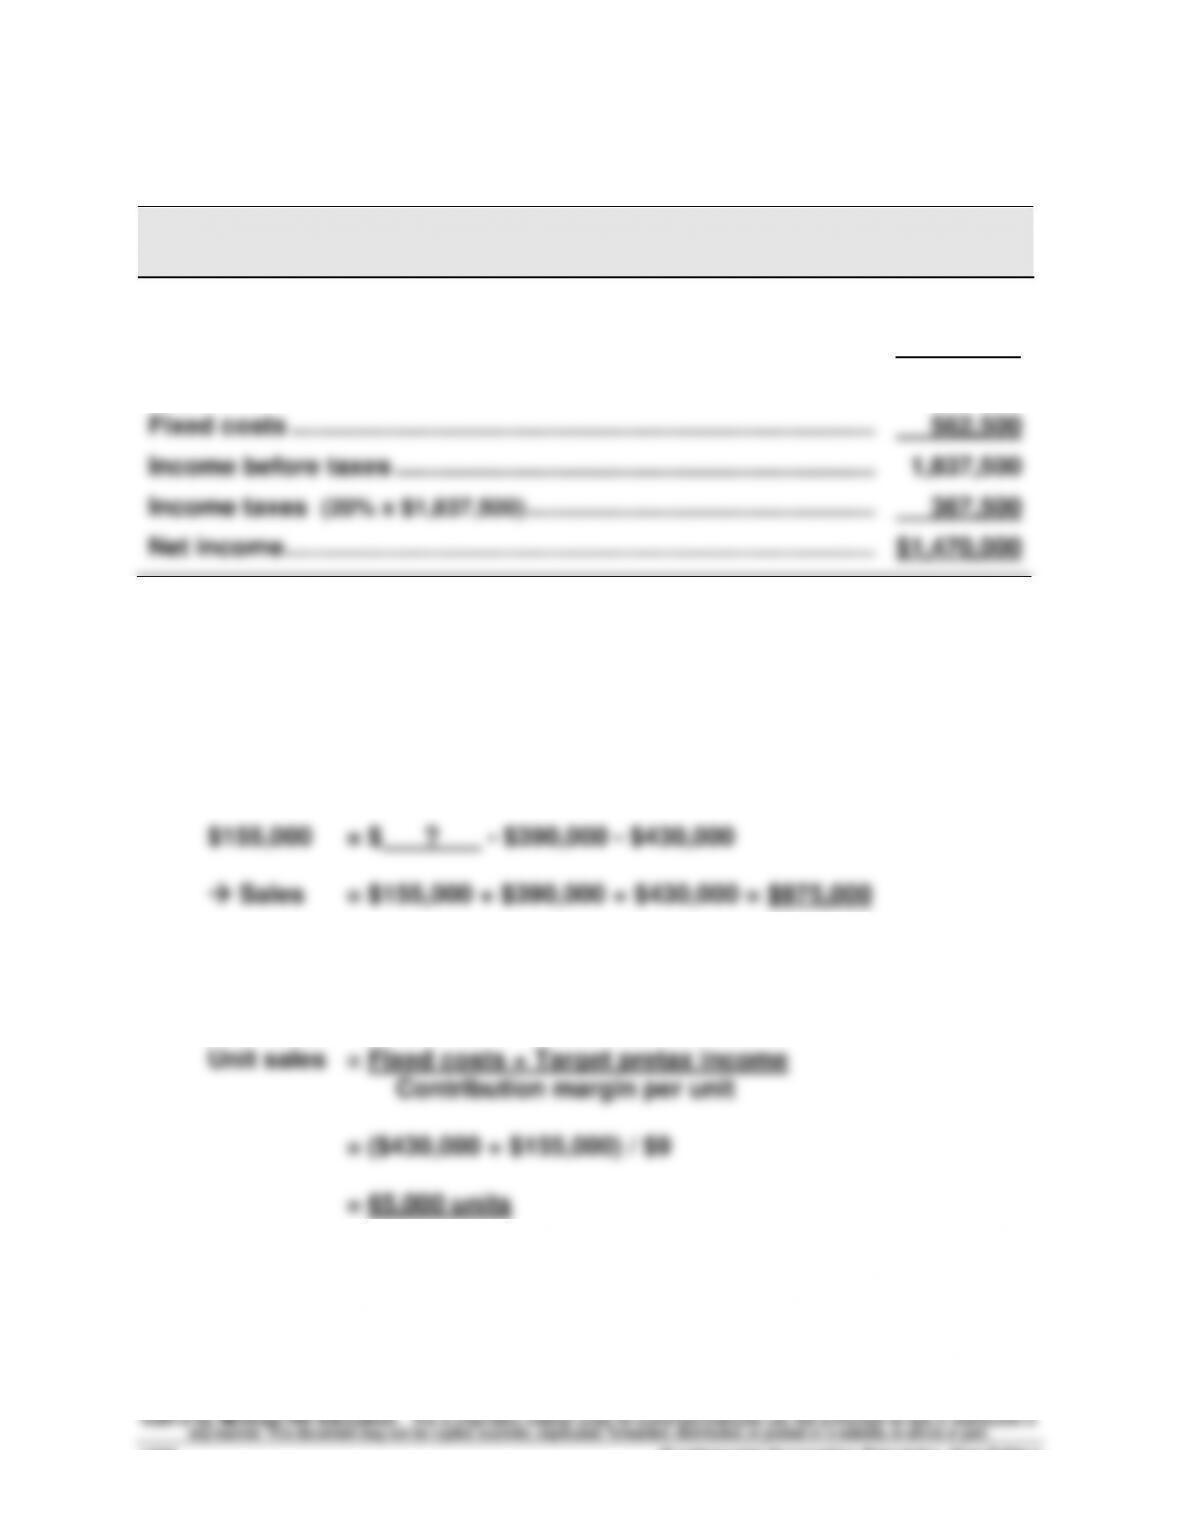
2. Sales (in dollars) to break even with increased fixed costs
Exercise 21-13 (25 minutes)
Preliminary computations
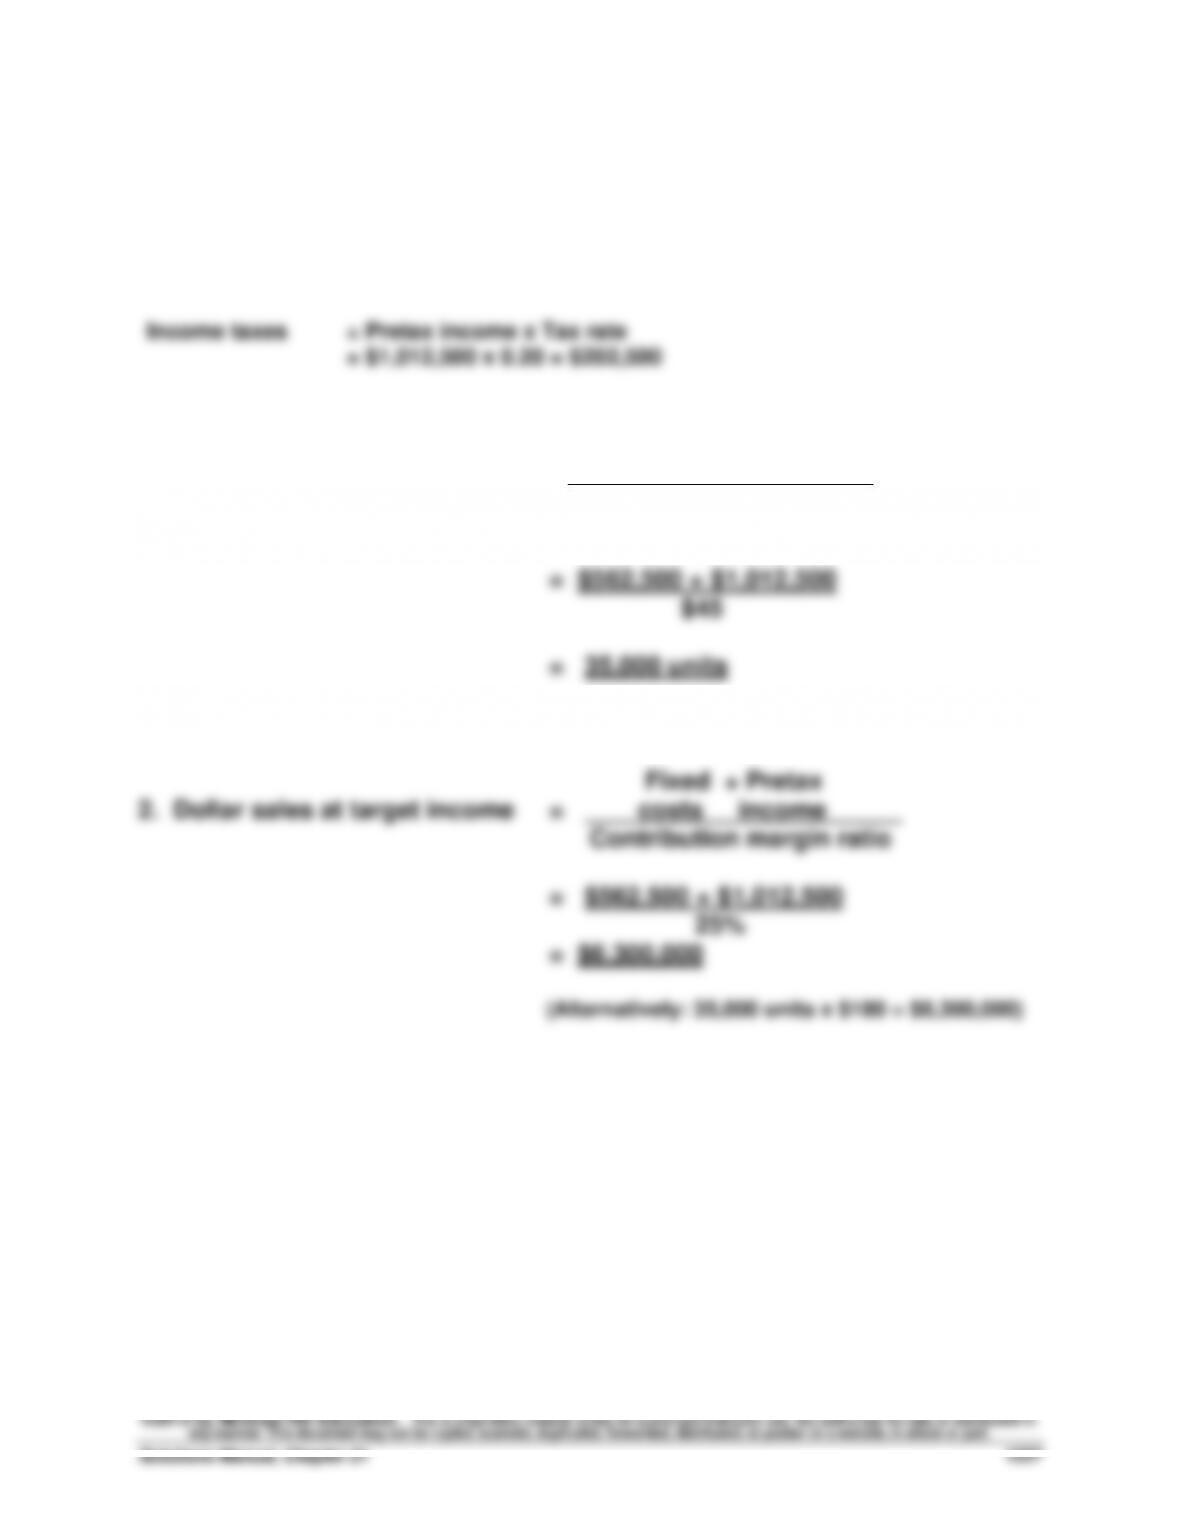
Pretax income = After-tax income / (1 – Tax rate)
= $810,000 / (1 - 0.20)
= $810,000 / 0.80
= $1,012,500
1. Unit sales at target income =
Fixed Pretax
costs income
Contribution margin/unit
+
Fundamental Accounting Principles, 21st Edition
1228
Exercise 21-14 (20 minutes)
BLANCHARD COMPANY
Forecasted Contribution Margin Income Statement
Sales (40,000 x $200) ..........................................................................
$8,000,000
Variable costs (40,000 x $140) ...........................................................
5,600,000
Contribution margin (40,000 x $60) ...................................................
2,400,000
Fixed costs .........................................................................................
562,500
Income before taxes ..........................................................................
1,837,500
Income taxes (20% x $1,837,500) .......................................................
367,500
Net income ..........................................................................................
$1,470,000
Exercise 21-15 (20 minutes)
1. Pretax income = Sales – Variable costs – Fixed costs
2. Instructor note: Use the equation in Exhibit 21.23 with no tax effects
Exercise 21-16 (30 minutes)
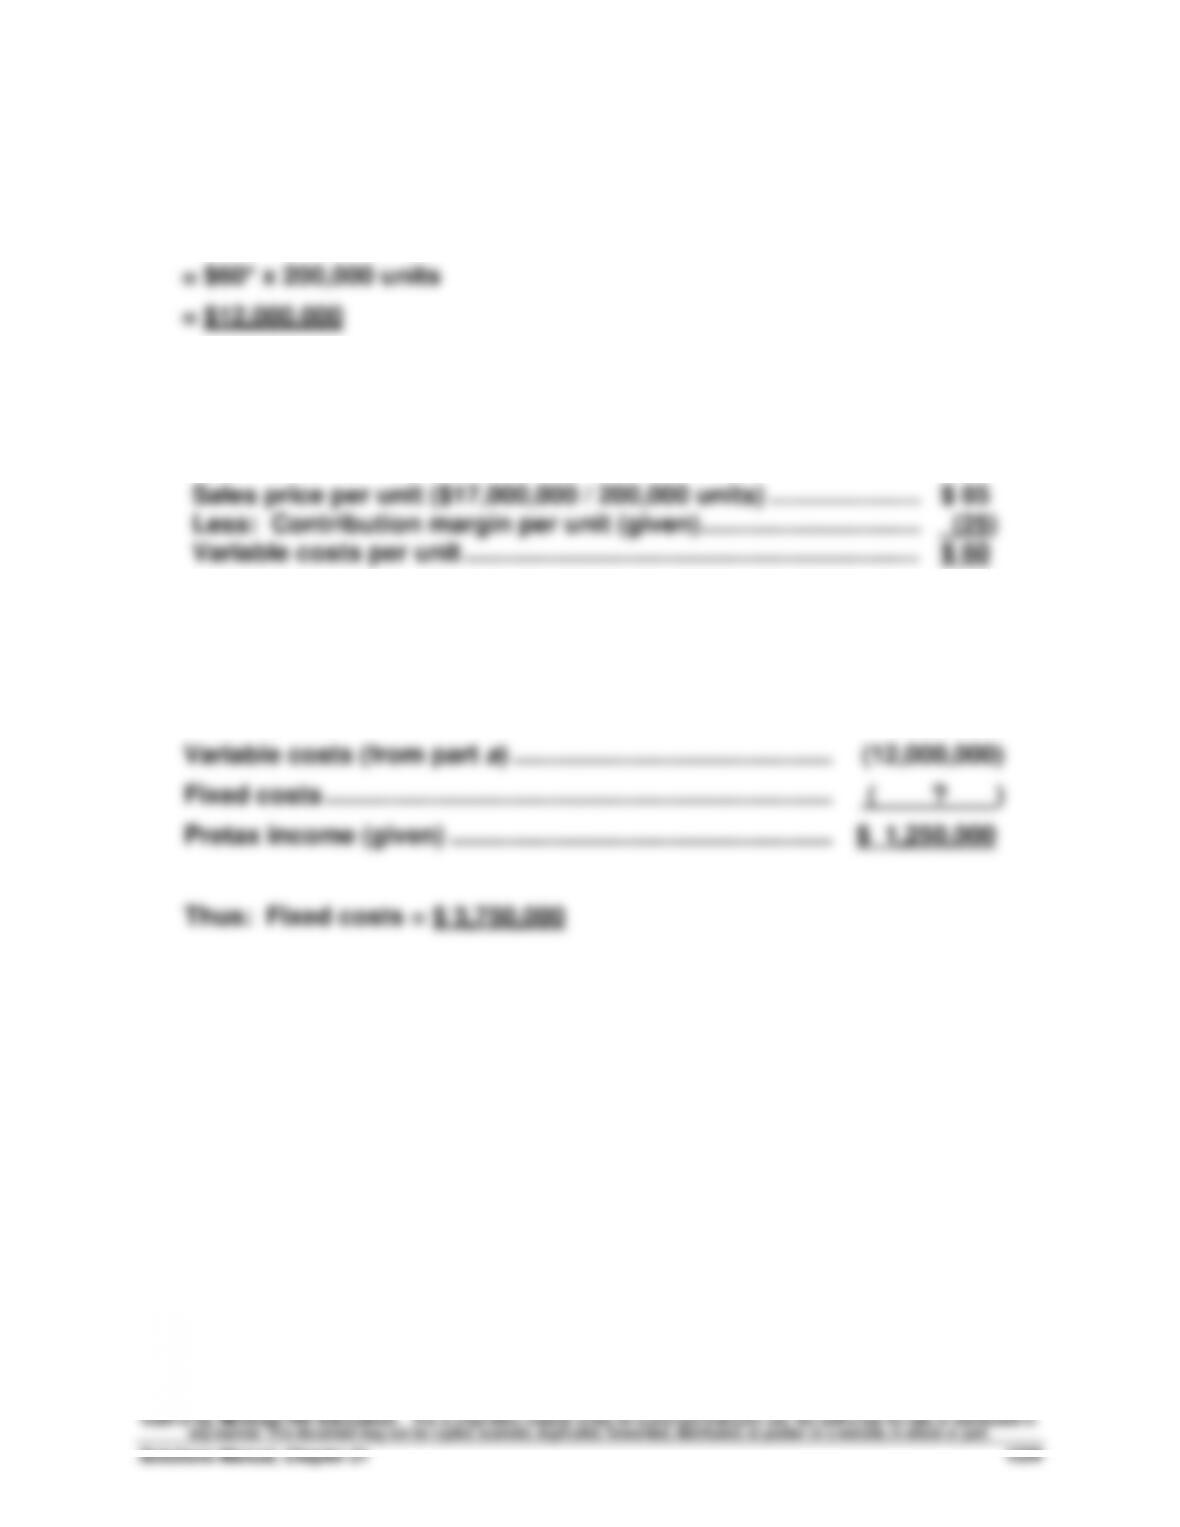
(a) Total expected variable costs
= Variable costs per unit x units produced and sold
*The $60 variable costs per unit is computed by determining (i) sales
price per unit and (ii) subtracting contribution margin per unit:
Sales price per unit ($17,000,000 / 200,000 units) .......................
$ 85
Less: Contribution margin per unit (given) ................................
(25)
Variable costs per unit ...................................................................
$ 60
(b) To solve, set up a brief contribution margin income statement
Sales (given) .............................................................................
$17,000,000
Variable costs (from part a) ....................................................
(12,000,000)
Fixed costs ...............................................................................
( ? )
Pretax income (given) .............................................................
$ 1,250,000


