

Title: Serial Problem 2
QA_Ori:
QA_Edit:
Title: Serial Problem 3
QA_Ori:
QA_Edit:
Title: Serial Problem 4
QA_Ori:
Title: Reporting in Action 1
QA_Ori:
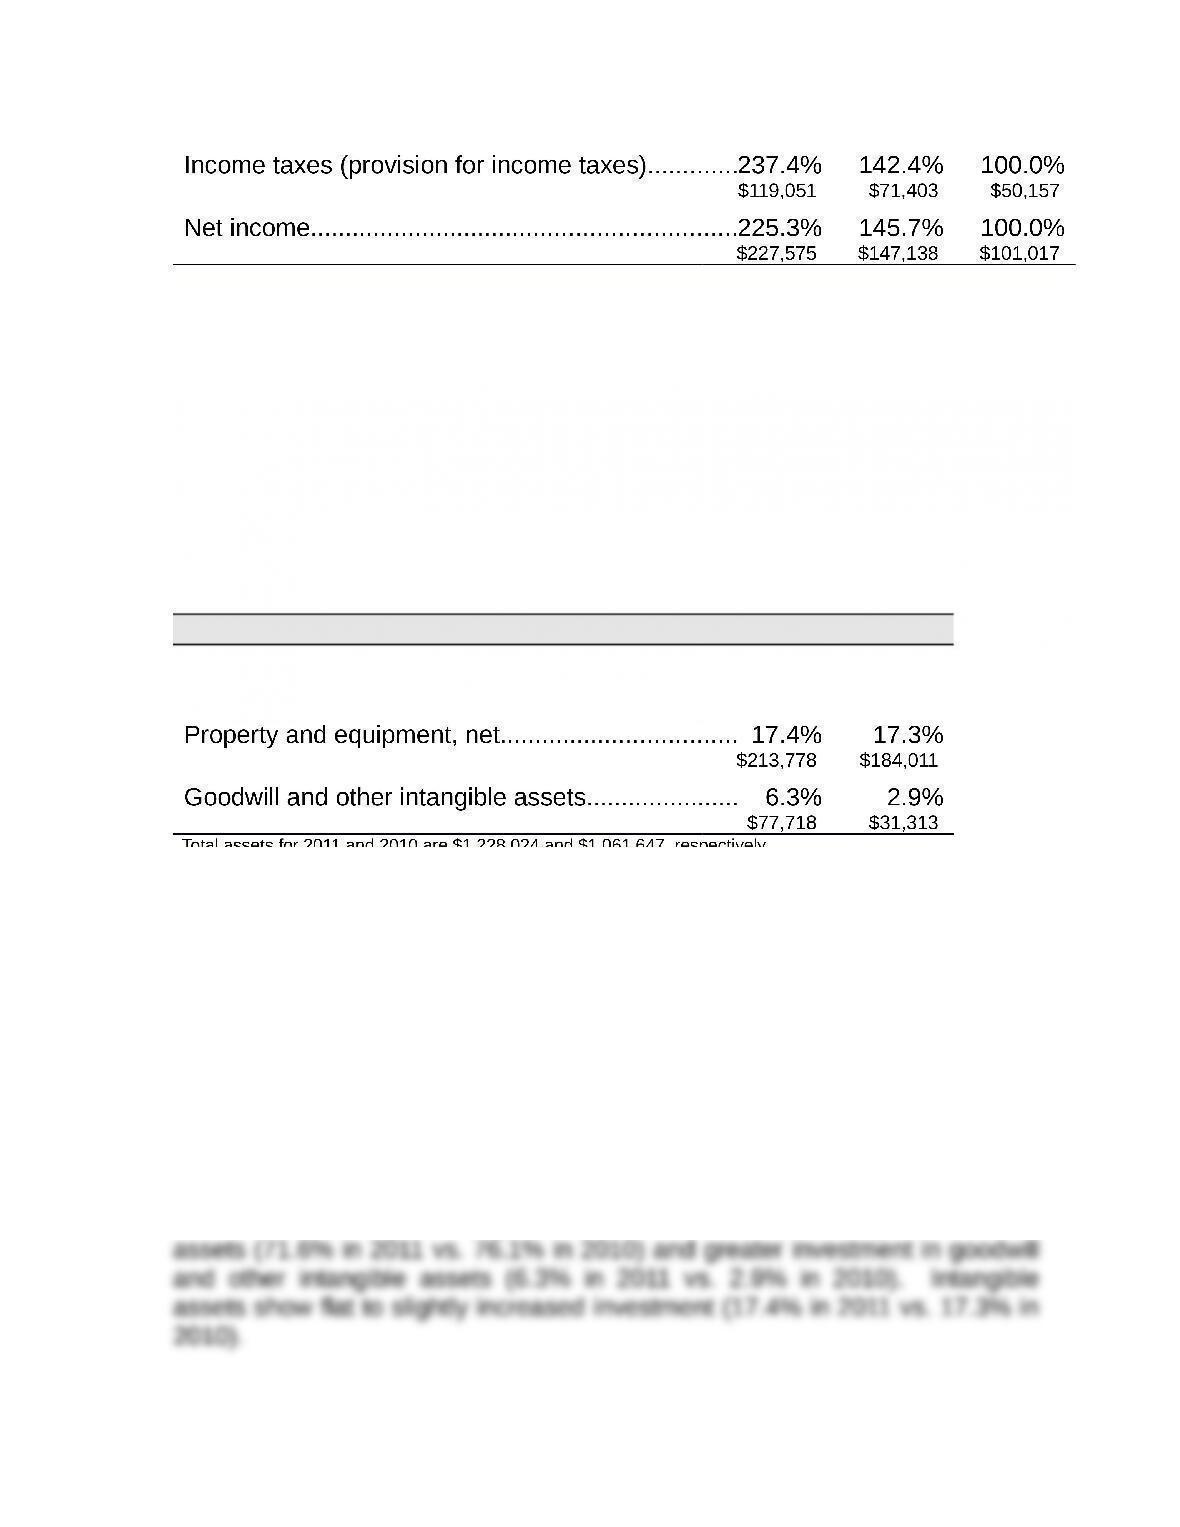
Trend percents for selected income statement accounts
($ in thousands) 2011 2010 2009
Revenues………………………………………………………169.7% 127.2% 100.0%
$2,656,949 $1,991,139 $1,565,887
QA_Edit:
Trend percents for selected income statement accounts
Title: Reporting in Action 2
QA_Ori:
Common-size percents for asset categories and accounts
($ in thousands) 2011 2010
Total current assets………………………………………… 71.6% 76.1%
$878,676 $808,145
Total assets for 2011 and 2010 are $1,228,024 and $1,061,647, respectively.
QA_Edit:
Common-size percents for asset categories and accounts
Title: Reporting in Action 3
QA_Ori:
For 2011 and 2010, revenues grew at a higher rate than cost of goods sold.
The common-size percent figures in part 2 show a shift away from current


Title: Reporting in Action 4
QA_Ori:
QA_Edit:
Title: Comparative Analysis 1
QA_Ori:
Key figures ($ thousands) Polaris Arctic Cat
Cash and equivalents…………… 26.5% $325,336 5.4% $14,700
Accounts receivable, net......…. 9.4% 115,302 8.7% 23,732
Title: Comparative Analysis 2
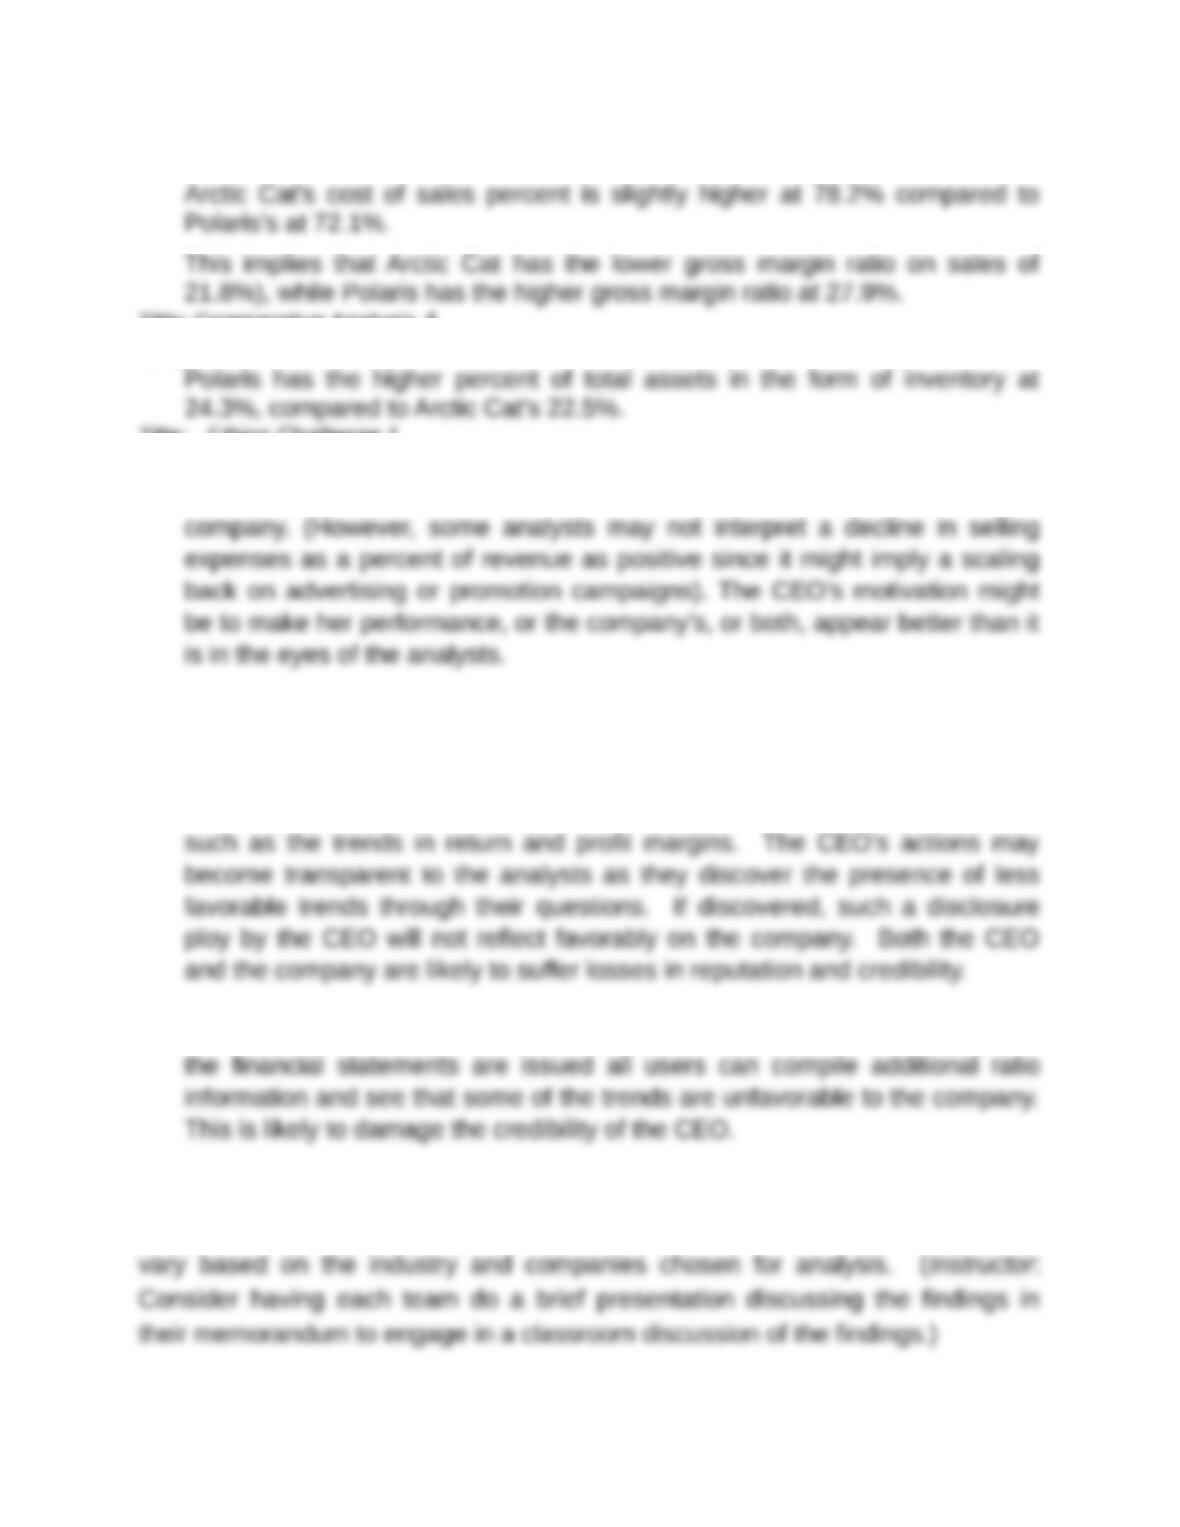
QA_Ori: Arctic Cat’s retained earnings make up a much greater percentage
of its total liabilities and equity (65.0%) vis-à-vis Polaris (26.2%).
QA_Edit: Arctic Cat’s retained earnings make up a much greater percentage of
its total liabilities and equity (65.0%) vis-à-vis Polaris (26.2%).
Title: Comparative Analysis 3
QA_Ori:
Title: Comparative Analysis 4
QA_Ori:
Title: Ethics Challenge 1
QA_Ori: The CEO appears to have selectively chosen from the 11 available
ratios to present only the ones that show trends that are favorable to the
Title: Ethics Challenge 2
QA_Ori:
The consequences of this action by the CEO might be mixed. It is likely that
the analysts will ask other questions that may reveal some negative trends
Even if the CEO is able to succeed with this strategy in the short term, once
Title: Communicating in Practice
QA_Ori: There is no set solution to this activity. Each team’s memorandum will
Title: Taking It to the Net
QA_Ori:
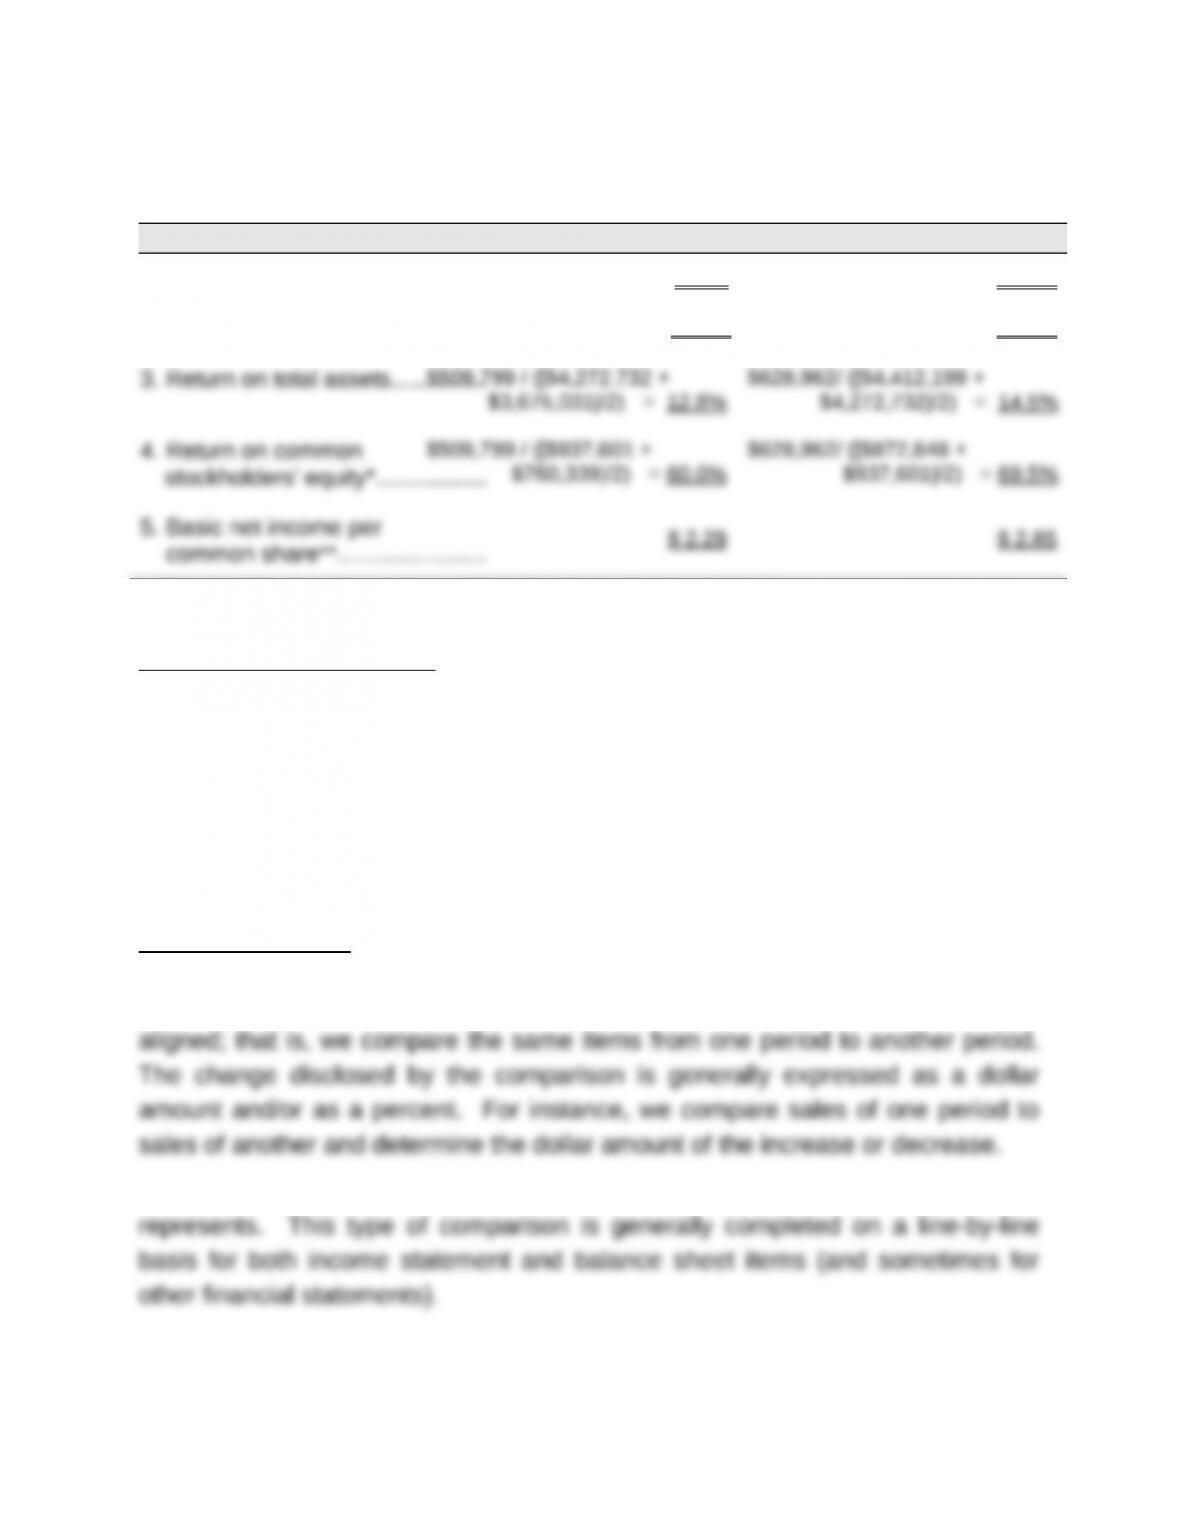
($ thousands) As of 12/31/2010 As of 12/31/2011
1. Profit margin ratio……………….
$509,799/$5,671,009 = 9.0% $628,962/$6,080,788 = 10.3%
2. Gross profit ratio…………………
$2,415,208/ $5,671,009 = 42.6% $2,531,892/$6,080,788 = 41.6%
*An acceptable alternative solution would be to include minority interest in equity.
**Taken from consolidated statement of income.
Analysis and Interpretation: Hershey’s performance generally improved in all
areas evaluated for the profitability metrics reported in the table above.
QA_Edit:
Title: Teamwork in Action 1
QA_Ori:
Team reports should look something like the following:
Horizontal Analysis
Horizontal analysis is comparing a company’s financial statement amounts
across time. We compare data from comparative statements that are horizontally
We also determine the percent of increase or decrease in sales that this change
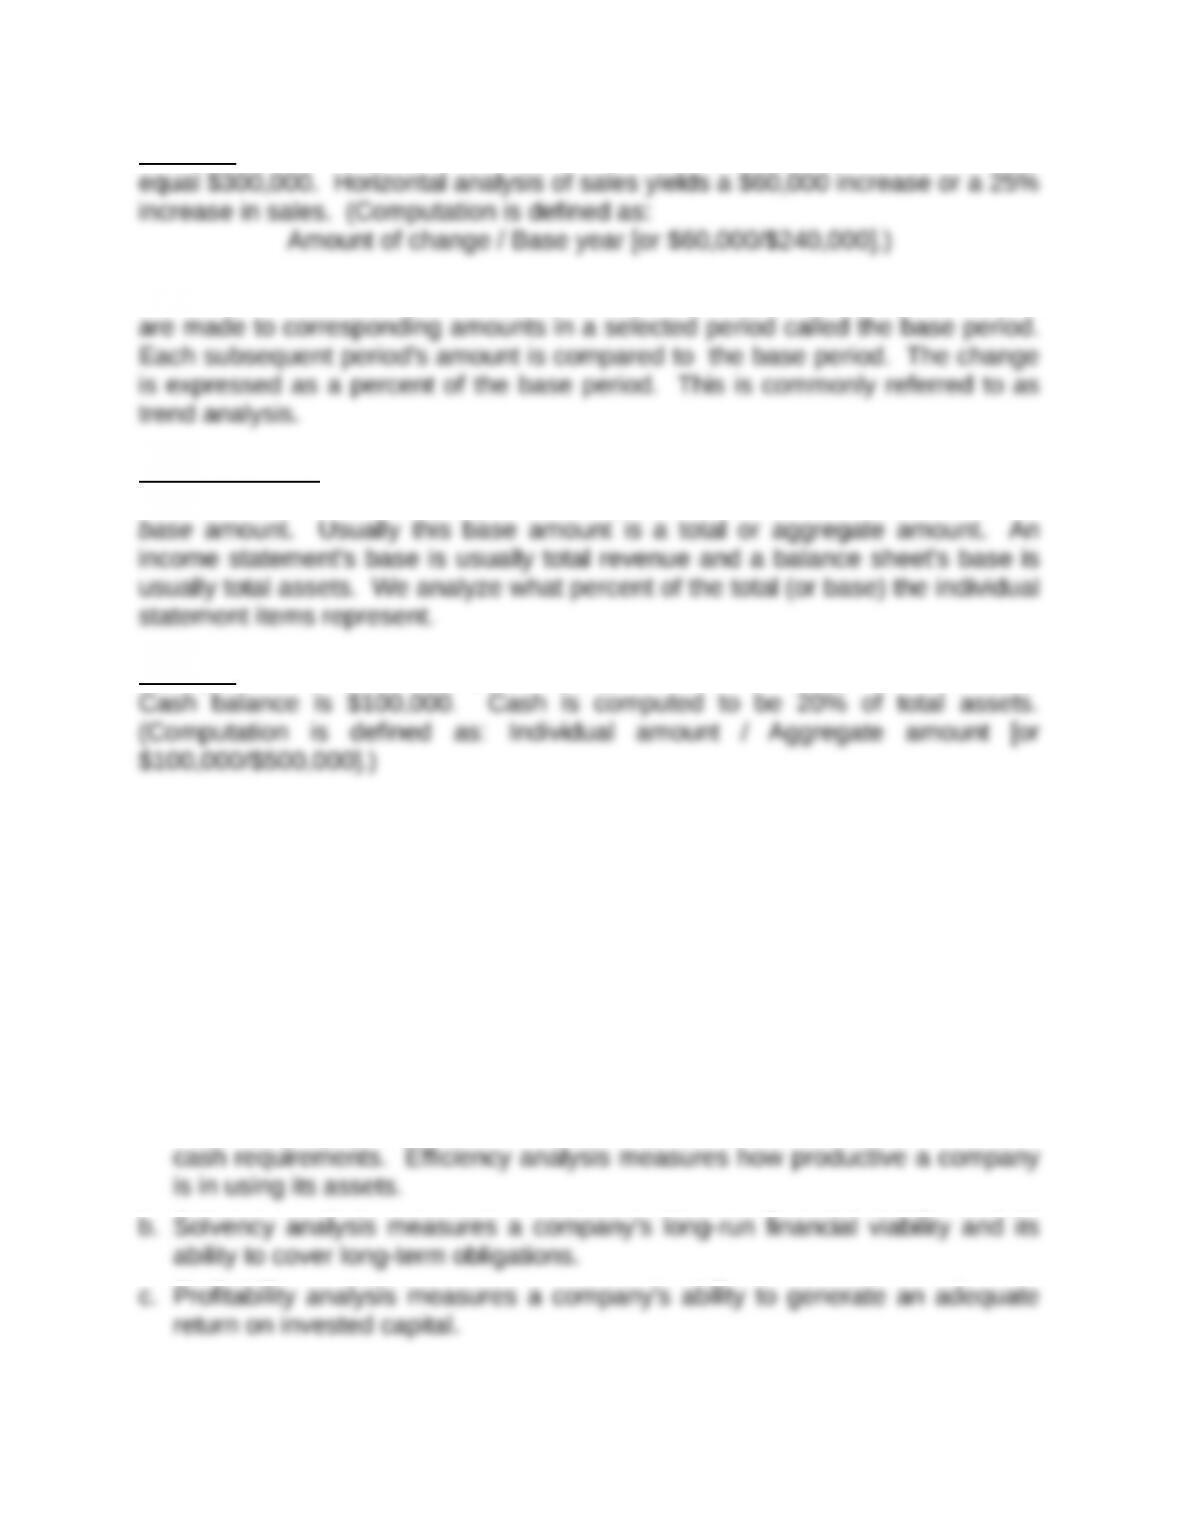

Example: Assume that prior year sales equal $240,000, and current year sales
If a horizontal comparison is made over a number of periods, the comparisons
Vertical Analysis
Vertical analysis is comparing a company’s financial statement amounts to a
Example: Total assets for the period being analyzed = $500,000 (base number).
QA_Edit:
Team reports should look something like the following:
Title: Teamwork in Action 2
QA_Ori:
Explanations of the four categories or areas of ratio analysis follow:
a. Liquidity analysis measures the availability of resources to meet short-term


Note: Students will select various ratios to illustrate these categories. Use Exhibit
17.16 to verify the category, measurement, and use of each ratio.
Title: Teamwork in Action 3
QA_Ori: Each team member presents results to the entire team.
QA_Edit: Results are presented to the entire team by each team member.
Title: Entrepreneurial Decision 1
QA_Ori: No. Although the current ratio improved over the three-year period,
Title: Entrepreneurial Decision 2
Title: Entrepreneurial Decision 3
QA_Ori: No. Sales are increasing and accounts receivable are turning more
Title: Entrepreneurial Decision 4
Title: Entrepreneurial Decision 5
QA_Ori: No. The percent of return on equity declines from 12.25% in 2010 to
9.75% in 2012.
QA_Edit: No. The percent of return on equity declines from 12.25% in 2010 to
9.75% in 2012.
Title: Entrepreneurial Decision 6
QA_Ori: The dollar amount of selling expenses increased in 2011 and
decreased sharply in 2012. Again assuming sales figures of $100 in 2010,

Title: Hitting the Road
QA_Ori:
One possible strategy to fulfill the requirements of this assignment is:
Assume that a $37,500 salary will be earned upon graduation at age 25. Also,
If the annual amount invested does not change and you earn 10% for 40 years,
One possible strategy to fulfill the requirements of this assignment is:
Title: Global Decision
QA_Ori:
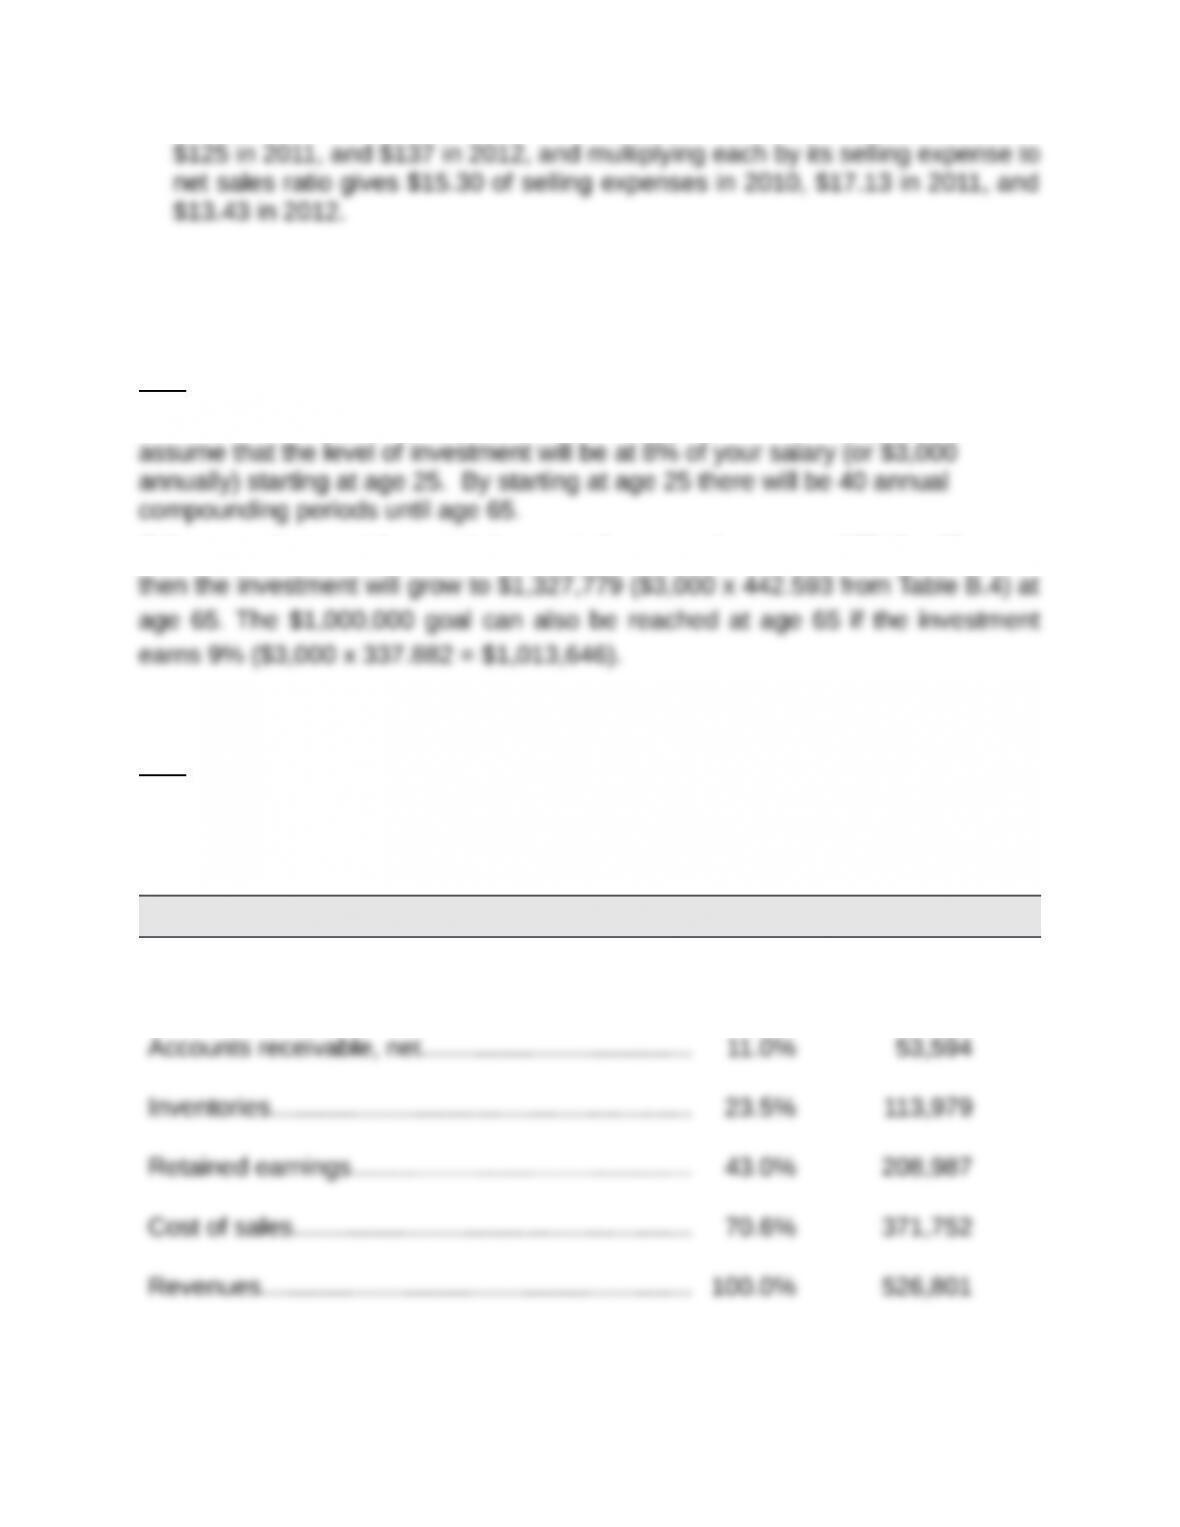
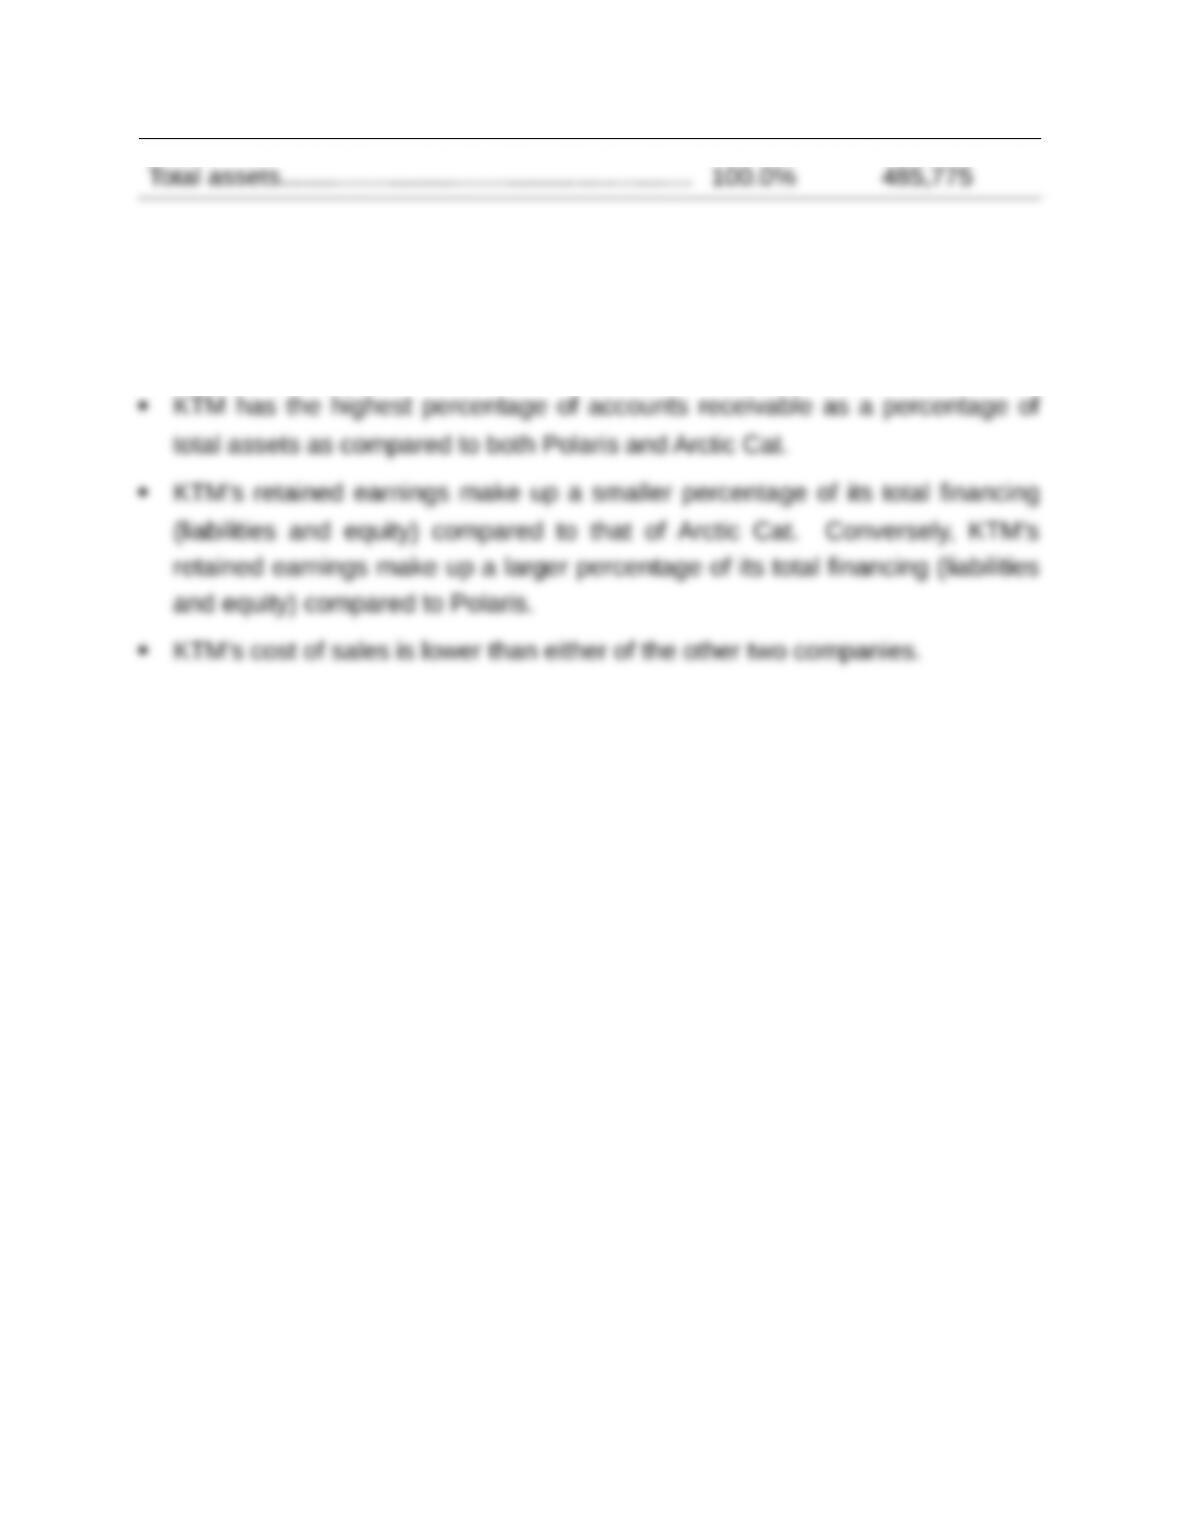
Key figures (Euro in thousands) KTM
Cash and equivalents……………………………………. 3.1% $ 14,962

Comparisons and comments:
KTM’s cash and equivalents is less than that of Polaris and Arctic Cat as a
percent of assets.