Fundamental Accounting Principles, 21st Edition
992
Exercise 17-14 (15 minutes)
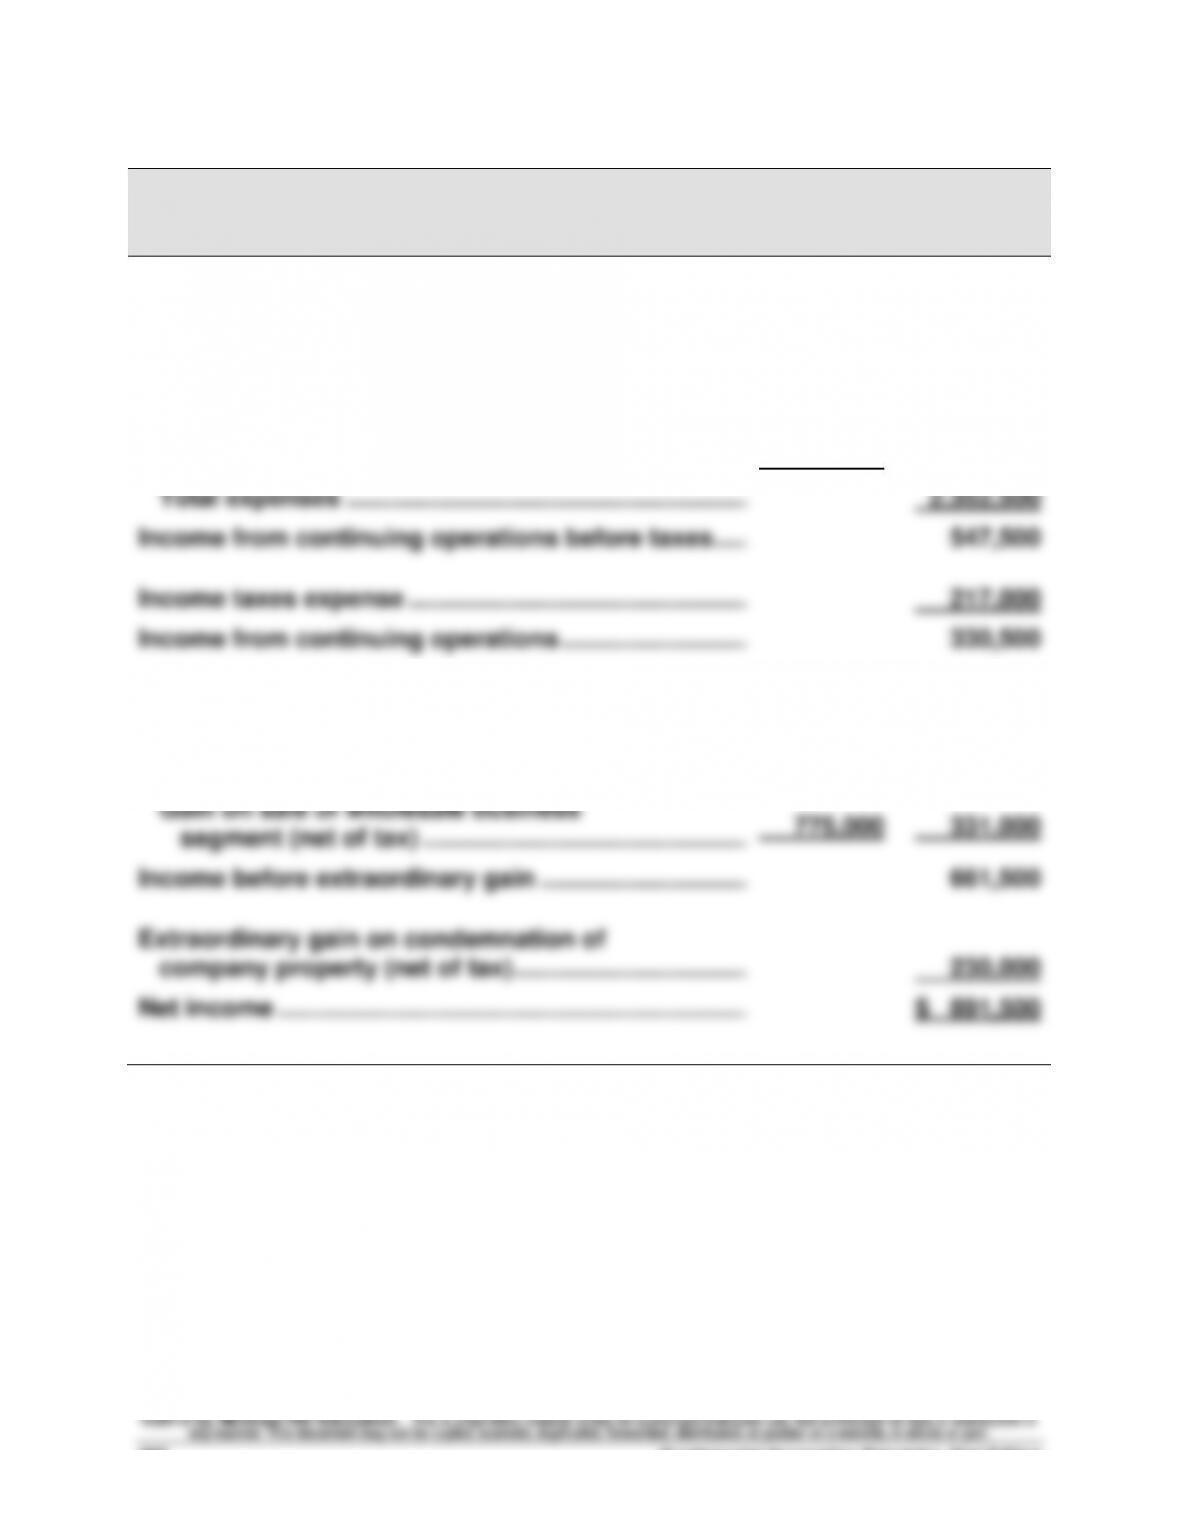
RANDA MERCHANDISING, INC.
Income Statement
For Year Ended December 31, 2013
Net sales ………………………………………………………………..
$2,900,000
Expenses
Cost of goods sold ……………………………………………...
$1,480,000
Salaries expense ………………………………………………...
640,000
Depreciation expense ………………………………………....
232,500
Total expenses …………………………………………………...
2,352,500
Income from continuing operations before taxes …....
547,500
Income taxes expense …………………………………………...
217,000
Income from continuing operations ………………………..
330,500
Discontinued segment
Loss from operating wholesale business
segment (net of tax) ………………………………………....
(444,000)
Gain on sale of wholesale business
segment (net of tax) ………………………………………....
775,000
331,000
Income before extraordinary gain …………………………..
661,500
Extraordinary gain on condemnation of
company property (net of tax) ……………………………...
230,000
Net income …………………………………………………………....
$ 891,500
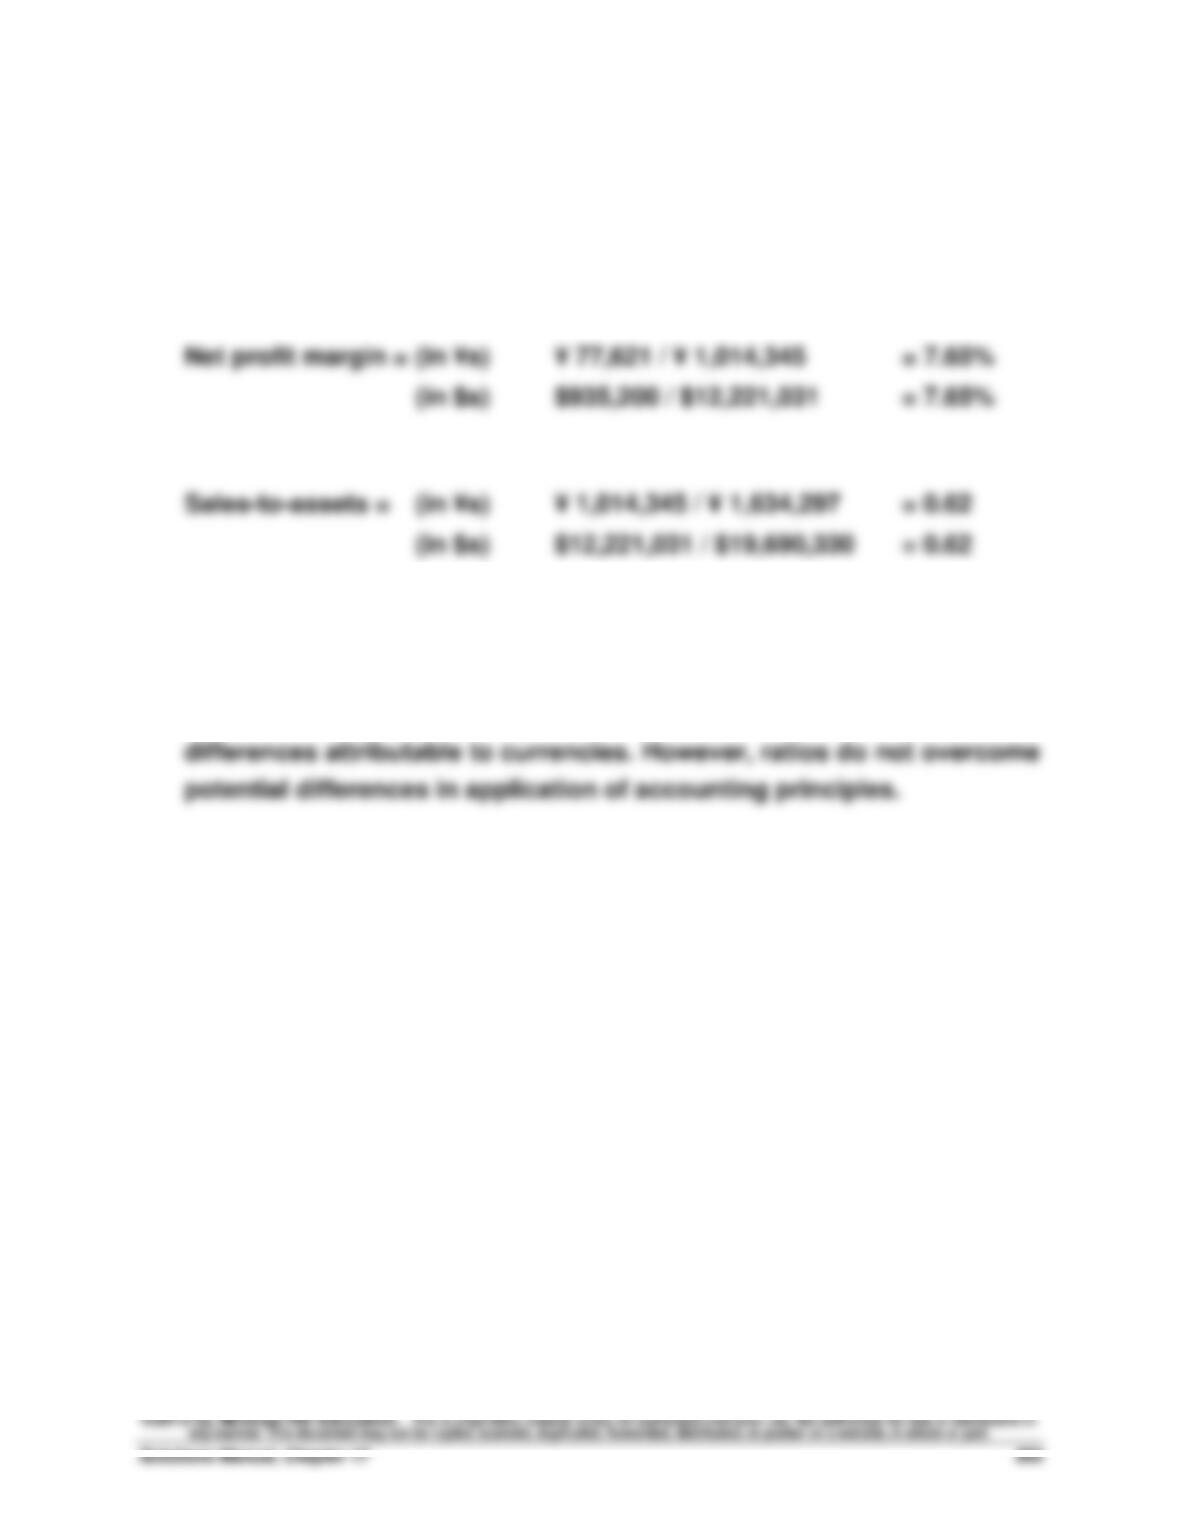
Exercise 17-15 (15 minutes)
1. Current ratio = (in ¥s) ¥ 1,468,706 / ¥ 333,301 = 4.41
(in $s) $17,695,254 / $4,015,683 = 4.41
2. The results in part 1 reveal that ratios can help us overcome
Fundamental Accounting Principles, 21st Edition
994
PROBLEM SET A
Problem 17-1A (60 minutes)
Part 1
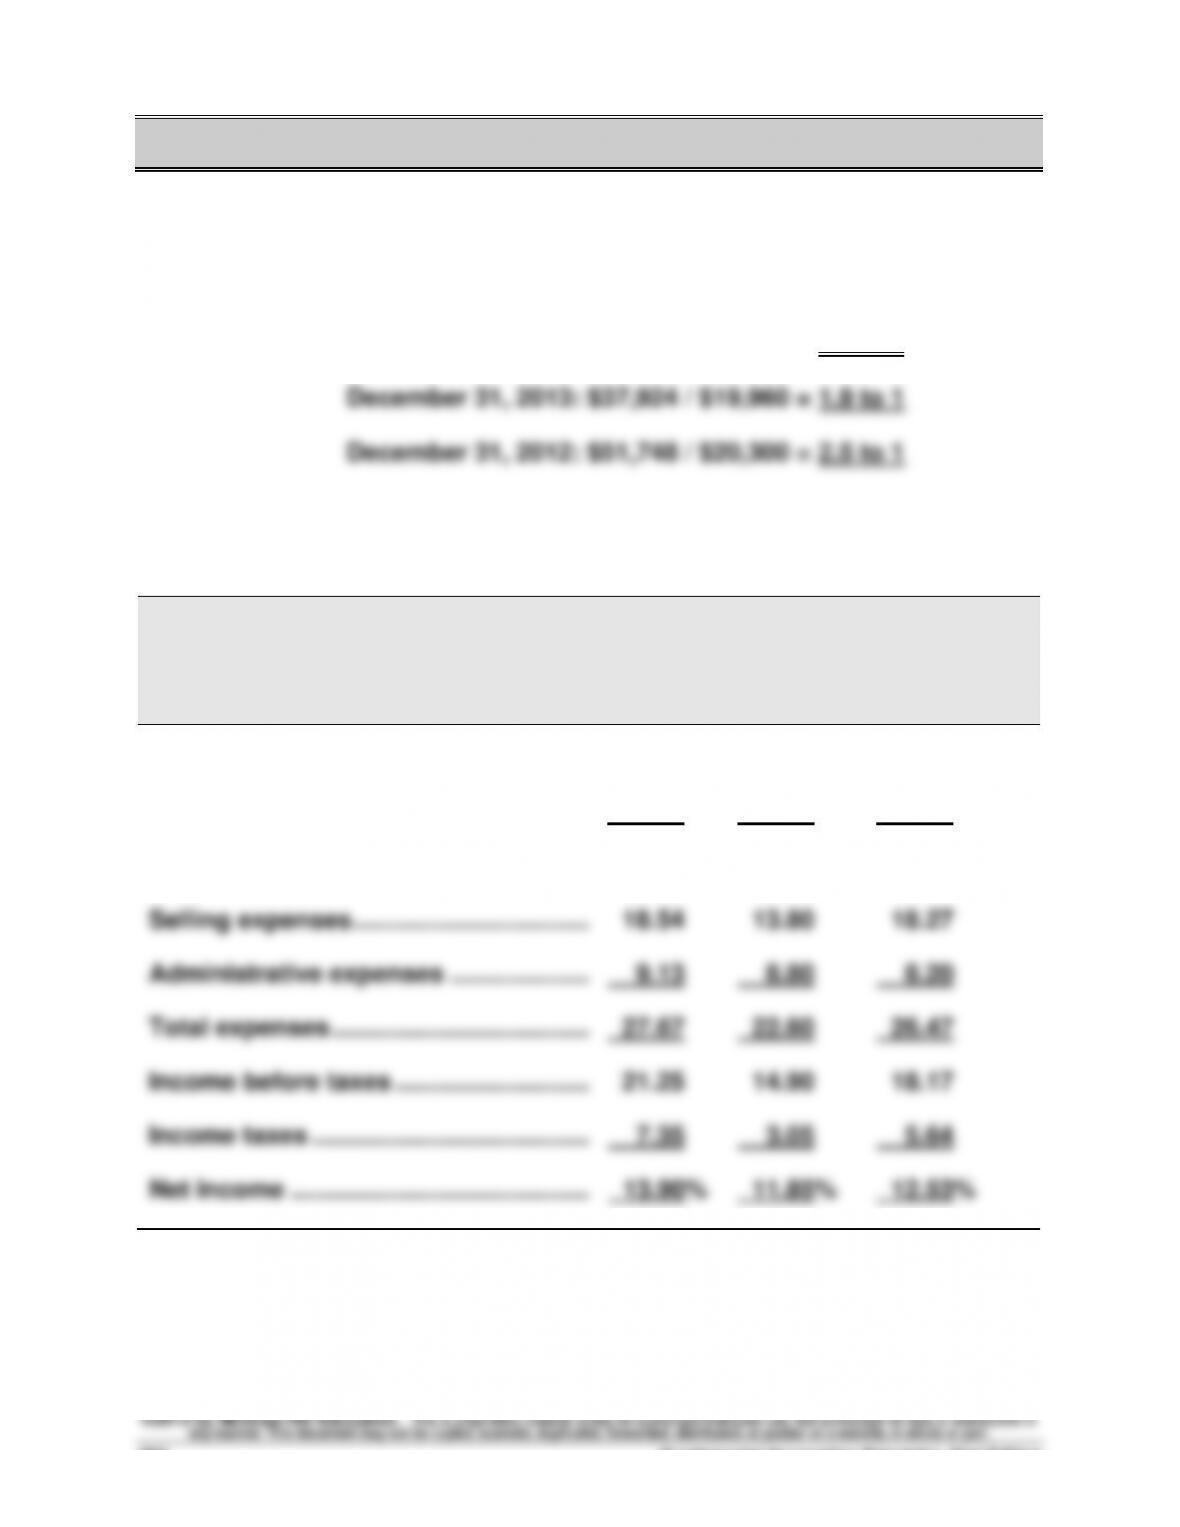
Current ratio: December 31, 2014: $52,390 / $22,800 = 2.3 to 1
Part 2
KORBIN COMPANY
Common-Size Comparative Income Statements
For Years Ended December 31, 2014, 2013, and 2012
2014
2013
2012
Sales ……………………………………………………
100.00%
100.00%
100.00%
Cost of goods sold …………………………..
51.08
62.50
55.36
Gross profit …………………………………………
48.92
37.50
44.64
Selling expenses …………………………….……
18.54
13.80
18.27
Administrative expenses ………………..……
9.13
8.80
8.20
Total expenses ……………………………….……
27.67
22.60
26.47
Income before taxes ……………………….….
21.25
14.90
18.17
Income taxes ………………………………….……
7.35
3.05
5.64
Net income …………………………………….……
13.90%
11.85%
12.53%
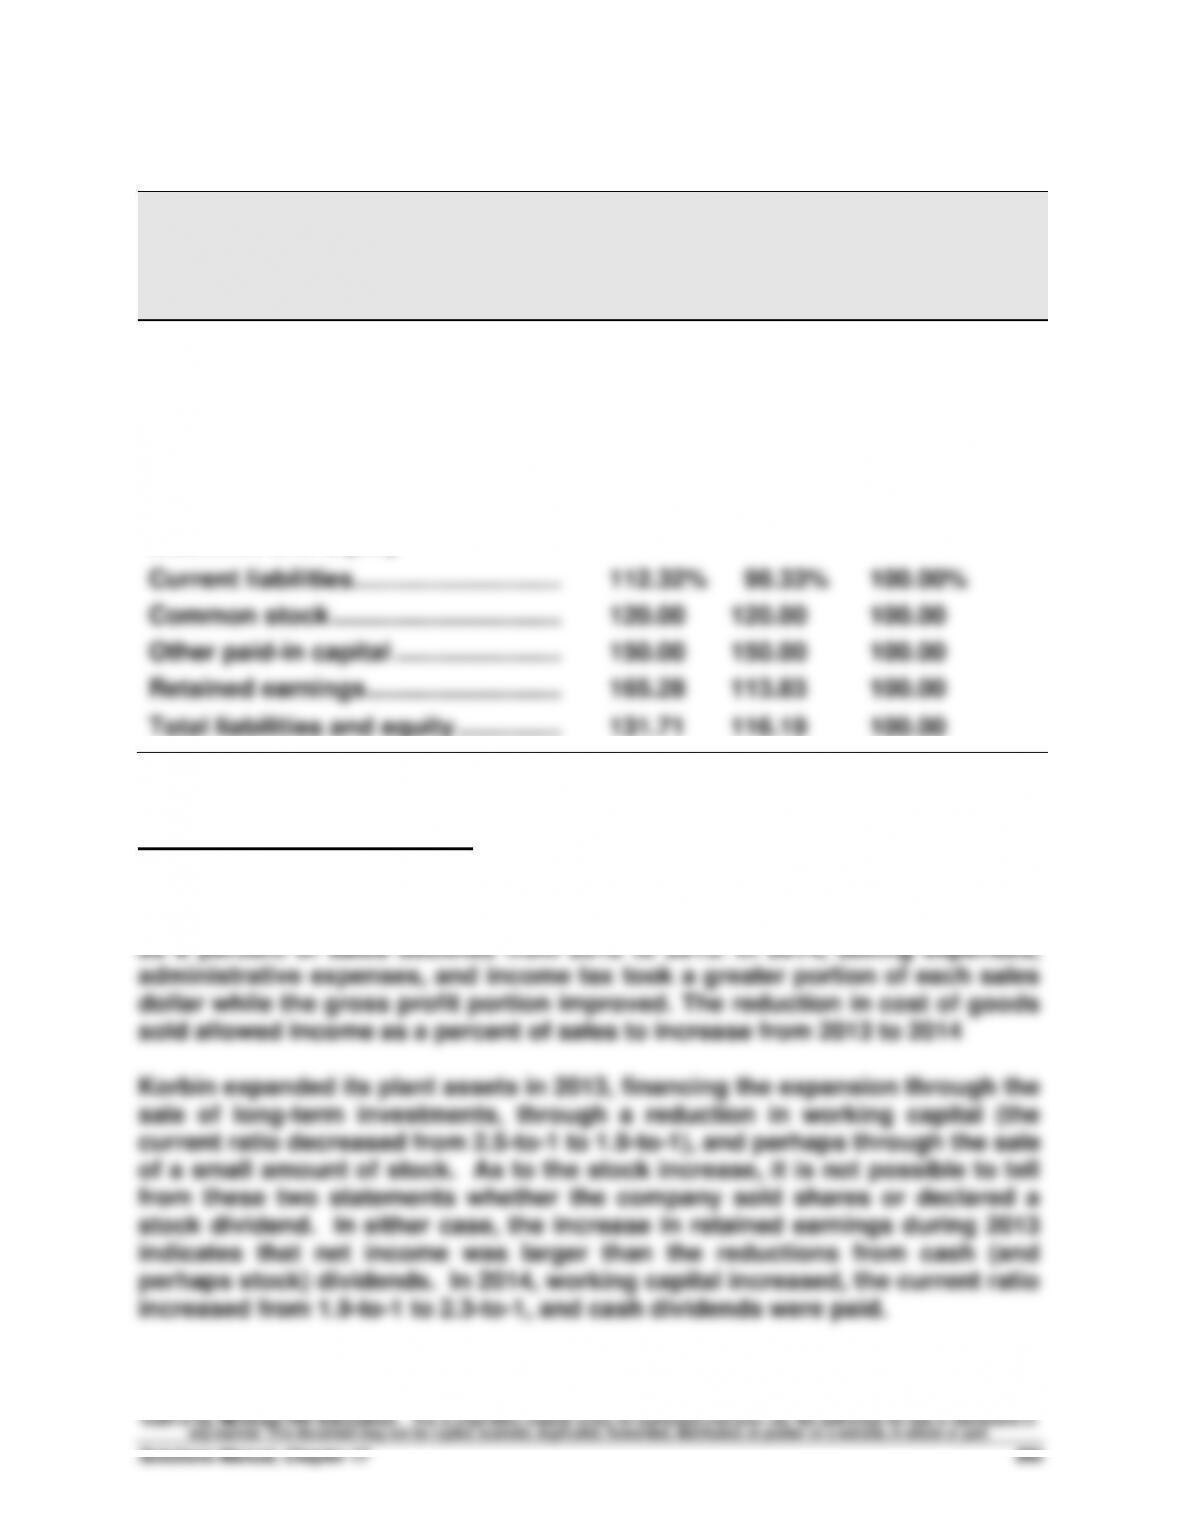
Problem 17-1A (Concluded)
Part 3
KORBIN COMPANY
Balance Sheet Data in Trend Percents
December 31, 2014, 2013, and 2012
2014
2013
2012
Assets
Current assets …………………………….
101.24%
73.29%
100.00%
Long-term investments ……………….
0.00
12.66
100.00
Plant assets, net………………………….
166.67
160.00
100.00
Total assets ………………………………..
131.71
116.19
100.00
Liabilities and Equity
Current liabilities…………………………
112.32%
98.33%
100.00%
Common stock …………………………...
120.00
120.00
100.00
Other paid-in capital ……………………
150.00
150.00
100.00
Retained earnings ……………………….
165.28
113.83
100.00
Total liabilities and equity ……………
131.71
116.19
100.00
Part 4
Significant relations revealed
Korbin’s selling expenses and income taxes consumed smaller portions of
each sales dollar in 2013 than 2012. However, cost of goods sold and
administrative expenses consumed a larger portion in 2013. Therefore, income
Problem 17-2A (120 minutes)
Part 1
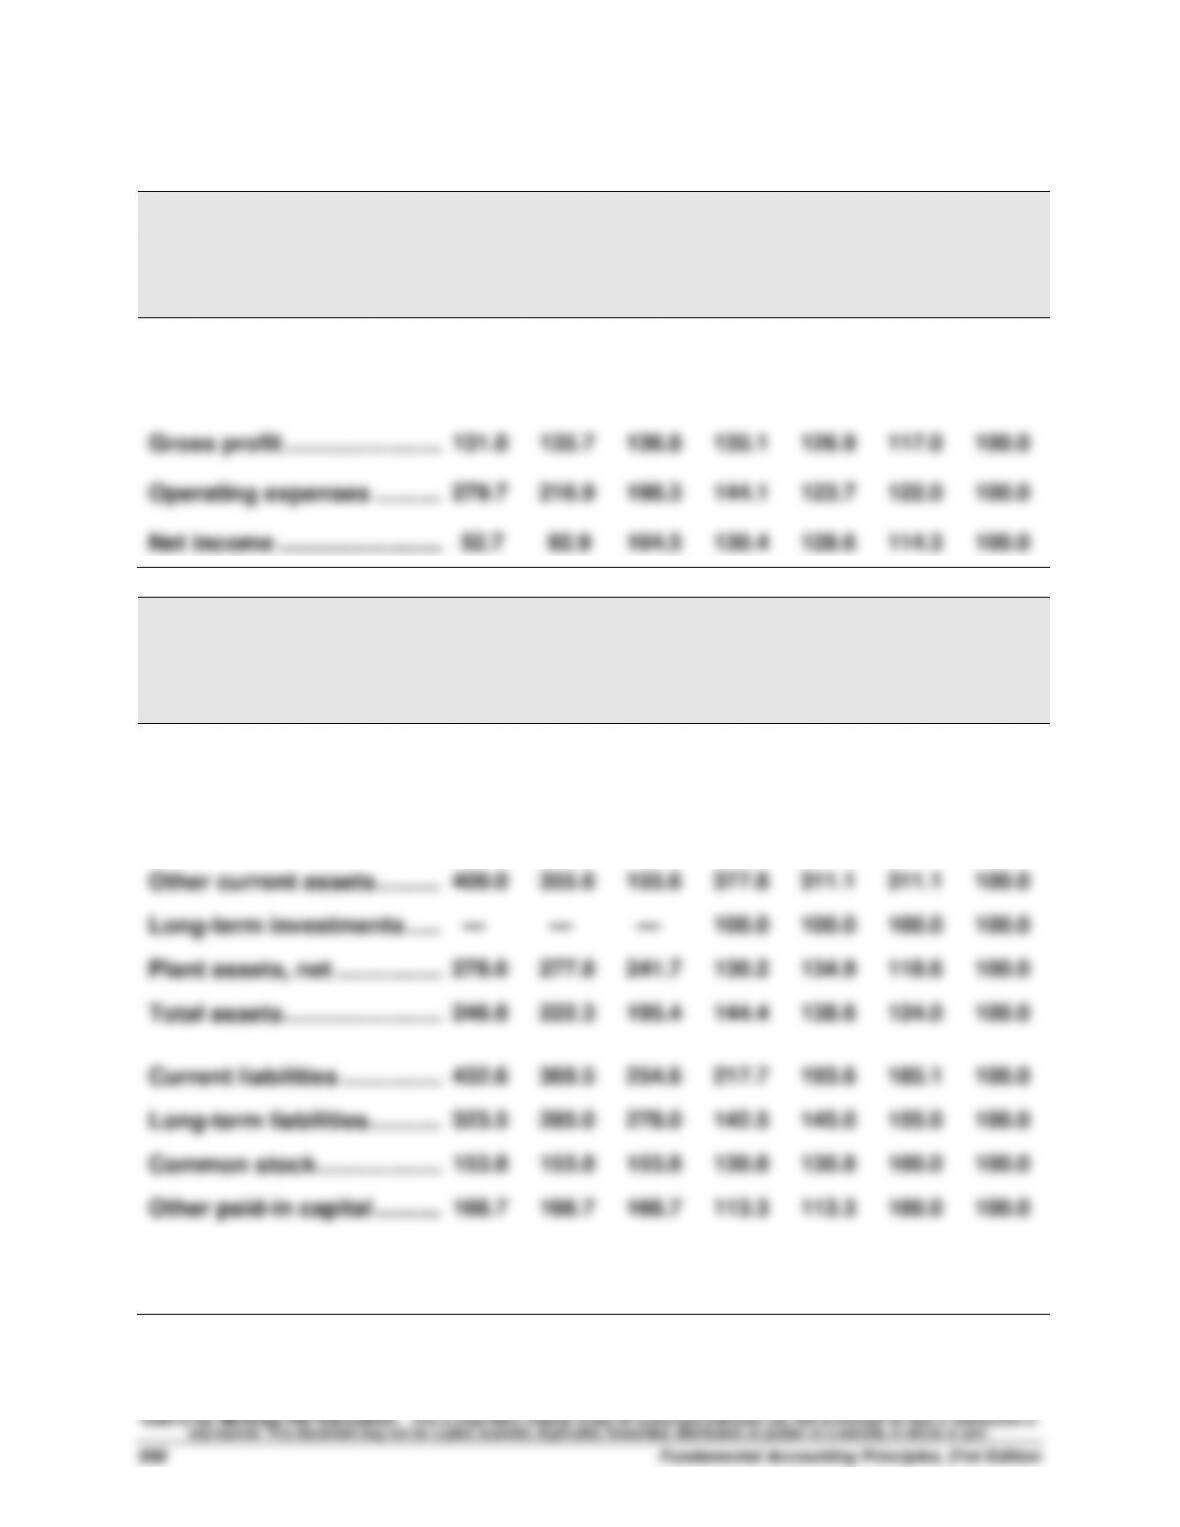
HAROUN COMPANY
Income Statement Trends
For Years Ended December 31, 2014-2008
2014
2013
2012
2011
2010
2009
2008
Sales ……………………………….
182.5%
161.2%
147.6%
136.2%
127.8%
119.6%
100.0%
Cost of goods sold …………..
212.6
176.1
153.9
136.9
128.3
121.2
100.0
Gross profit ……………………..
131.0
135.7
136.8
135.1
126.9
117.0
100.0
Operating expenses ………...
279.7
216.9
198.3
144.1
123.7
122.0
100.0
Net income ……………………...
52.7
92.9
104.5
130.4
128.6
114.3
100.0
HAROUN COMPANY
Balance Sheet Trends
December 31, 2014-2008
2014
2013
2012
2011
2010
2009
2008
Cash ………………………………..
65.2%
87.6%
92.1%
94.4%
98.9%
96.6%
100.0%
Accounts recble., net ……….
226.9
238.0
215.7
166.7
147.2
139.8
100.0
Merchandise inventory ……..
298.9
221.8
195.8
167.8
152.2
131.7
100.0
Other current assets ………...
400.0
355.6
155.6
377.8
311.1
311.1
100.0
Long-term investments …….
—
—
—
100.0
100.0
100.0
100.0
Plant assets, net ……………...
278.6
277.8
241.7
130.2
134.9
118.6
100.0
Total assets ……………………..
246.8
222.3
195.4
144.4
138.6
124.0
100.0
Current liabilities ……………..
432.6
369.5
254.6
217.7
193.6
185.1
100.0
Long-term liabilities ………….
323.5
285.0
278.0
142.5
145.0
155.0
100.0
Common stock ………………...
153.8
153.8
153.8
130.8
130.8
100.0
100.0
Other paid-in capital ………...
166.7
166.7
166.7
113.3
113.3
100.0
100.0
Retained earnings…………….
213.2
179.2
137.7
124.5
109.4
91.2
100.0
Total liabilities & equity …….
246.8
222.3
195.4
144.4
138.6
124.0
100.0
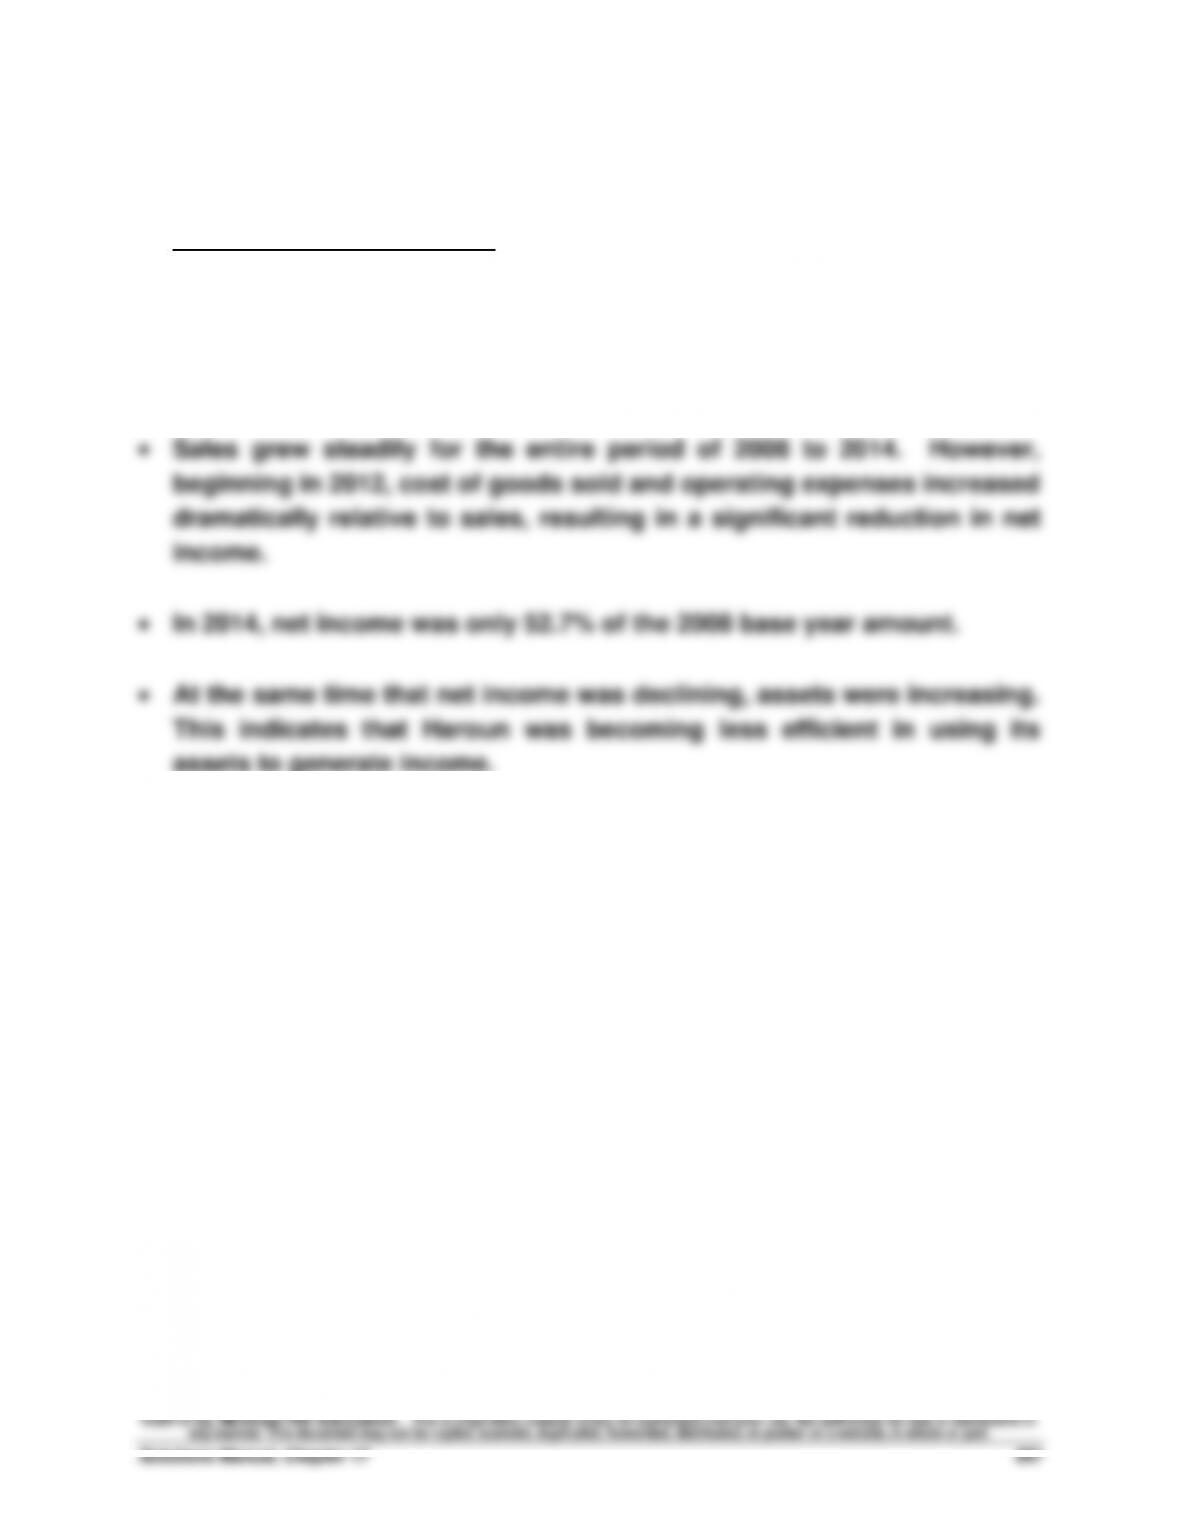
Problem 17-2A (concluded)
Part 2
Analysis and Interpretation
• The statements and the trend percent data indicate that the company
significantly expanded its plant assets in 2012. Prior to that time, the
company enjoyed increasing gross profit and net income.
assets to generate income.
• The short-term liquidity of the company continued to decline. Accounts
receivable did not change significantly for the period of 2012 to 2014,
but cash steadily declined and inventory sharply increased as did
current liabilities.
Fundamental Accounting Principles, 21st Edition
998
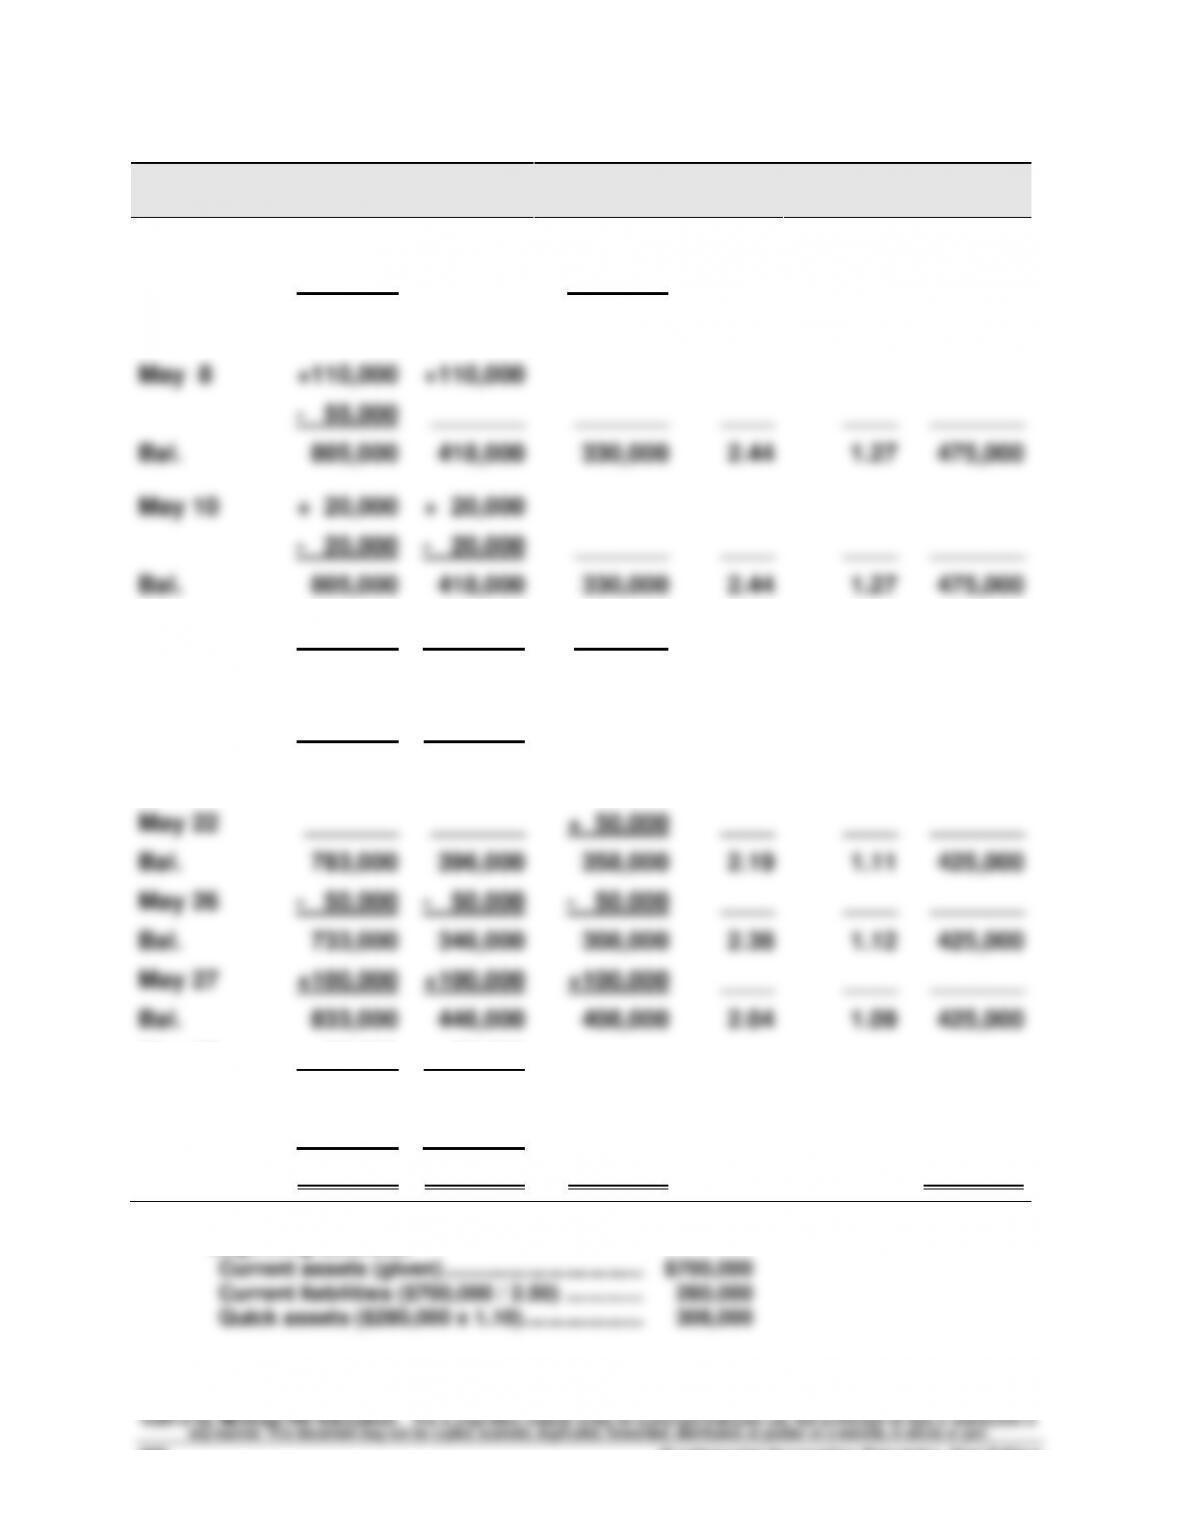
Problem 17-3A (60 minutes)
Trans-
action
Current
Assets
Quick
Assets
Current
Liabilities
Current
Ratio
Acid-Test
Ratio
Working
Capital
Beginning*
$700,000
$308,000
$280,000
2.50
1.10
$420,000
May 2
+ 50,000
_______
+ 50,000
____
____
_______
Bal.
750,000
308,000
330,000
2.27
0.93
420,000
May 8
+110,000
+110,000
– 55,000
_______
_______
____
____
_______
Bal.
805,000
418,000
330,000
2.44
1.27
475,000
May 10
+ 20,000
+ 20,000
– 20,000
– 20,000
_______
____
____
_______
Bal.
805,000
418,000
330,000
2.44
1.27
475,000
May 15
– 22,000
– 22,000
– 22,000
____
____
_______
Bal.
783,000
396,000
308,000
2.54
1.29
475,000
May 17
+0
+0
_______
____
____
_______
Bal.
783,000
396,000
308,000
2.54
1.29
475,000
May 22
_______
_______
+ 50,000
____
____
_______
Bal.
783,000
396,000
358,000
2.19
1.11
425,000
May 26
– 50,000
– 50,000
– 50,000
____
____
_______
Bal.
733,000
346,000
308,000
2.38
1.12
425,000
May 27
+100,000
+100,000
+100,000
____
____
_______
Bal.
833,000
446,000
408,000
2.04
1.09
425,000
May 28
+ 80,000
+ 80,000
________
____
____
_______
Bal.
913,000
526,000
408,000
2.24
1.29
505,000
May 29
– 180,000
– 180,000
________
____
____
_______
Bal.
$733,000
$346,000
$408,000
1.80
0.85
$325,000
*Beginning balances
Current assets (given) ……………………………………..
$700,000
Current liabilities ($700,000 / 2.50) ………….………..
280,000
Quick assets ($280,000 x 1.10) ………………..………..
308,000
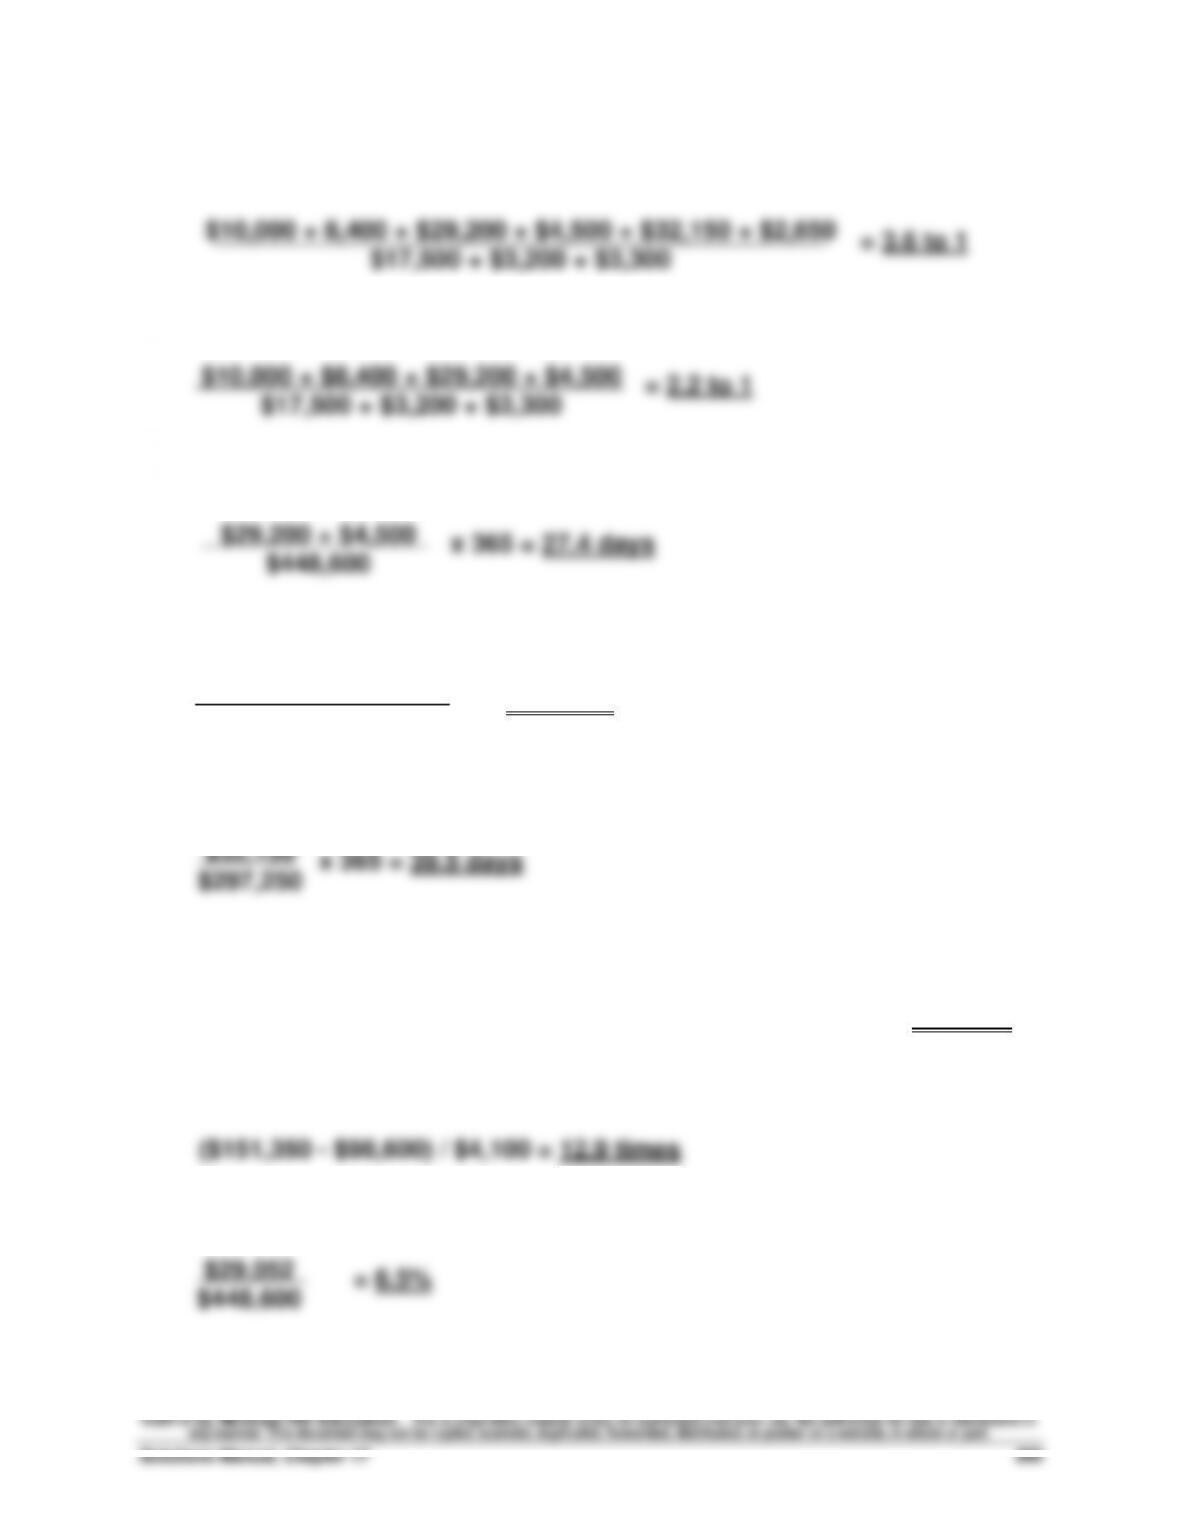
Problem 17-4A (50 minutes)
1. Current ratio
2. Acid-test ratio
3. Days’ sales uncollected
4. Inventory turnover
= 7.3 times
5. Days’ sales in inventory
6. Debt–to-equity ratio
($17,500 + $3,200 + $3,300 + $63,400) / ($90,000 + $62,800) = 0.57 to 1
7. Times interest earned
8. Profit margin ratio
$17,500 + $3,200 + $3,300
$297,250
($48,900 + $32,150)/2
$32,150
Problem 17-4A (Concluded)
9. Total asset turnover
10. Return on total assets
11. Return on common stockholders’ equity
Problem 17-5A (60 minutes)
Part 1
Barco Company
Kyan Company
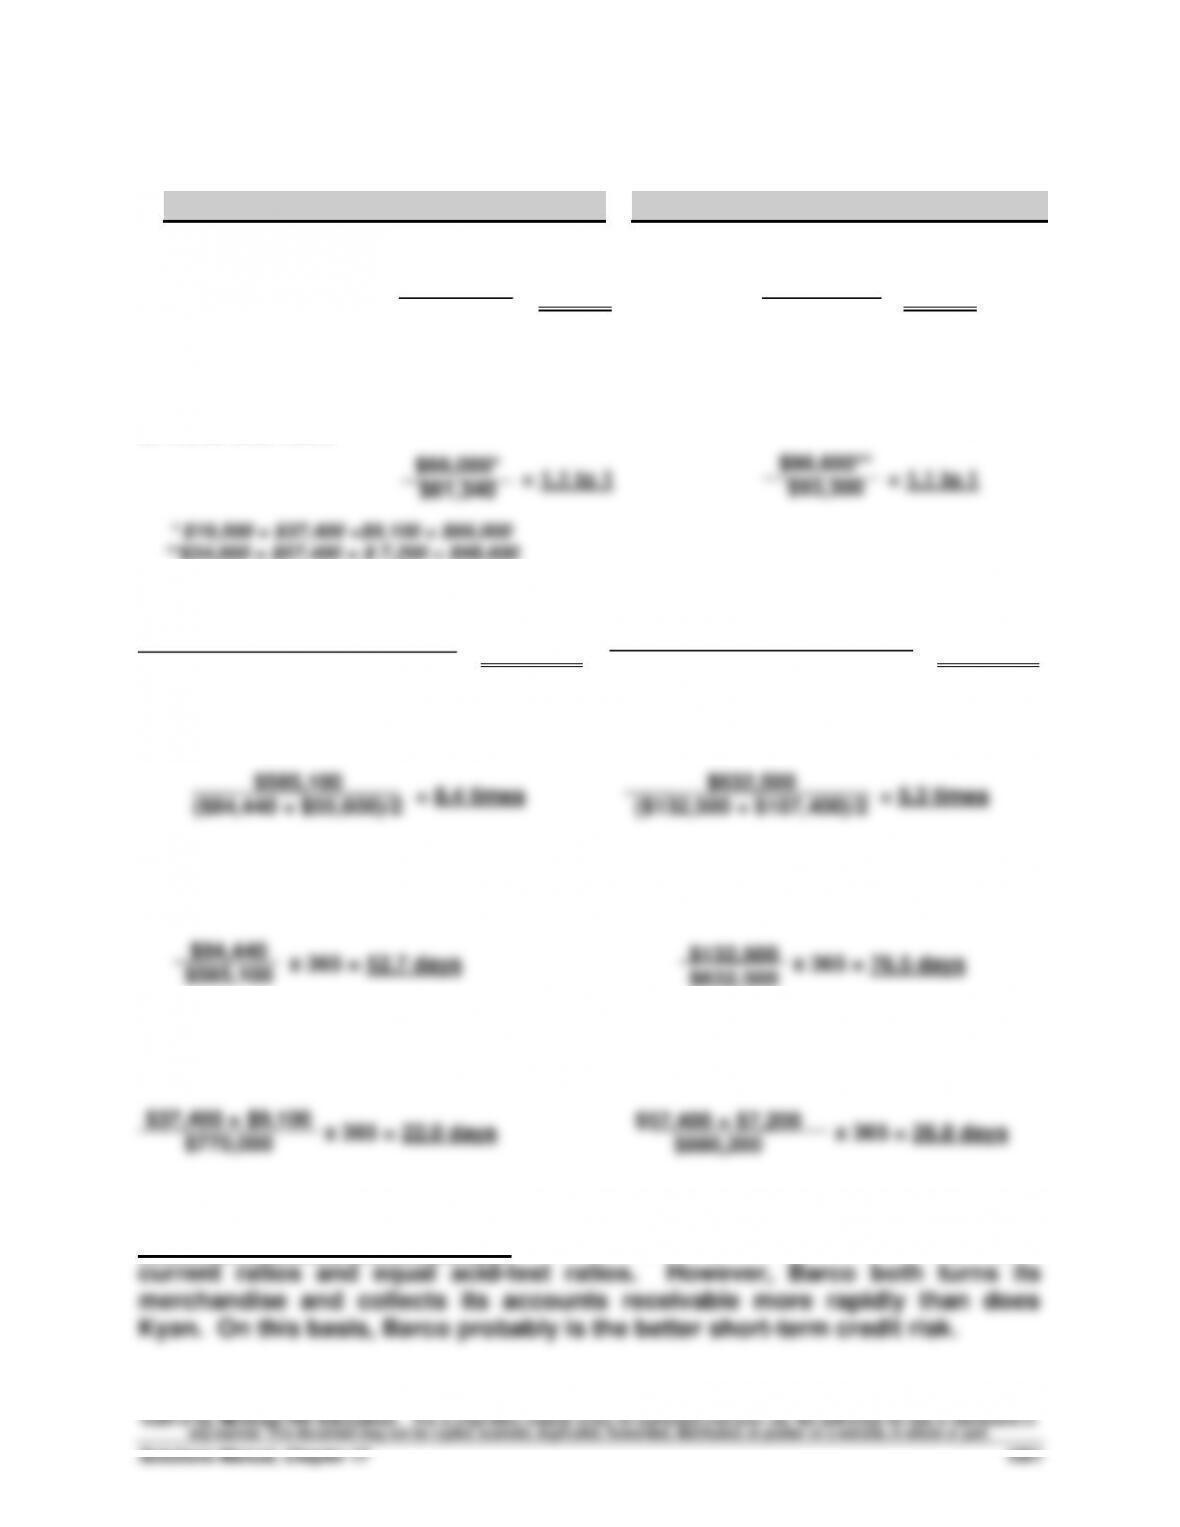
a. Current ratio
= 2.5 to 1
= 2.6 to 1
* $19,500 + $37,400 + $9,100 + $84,440 + $5,000 = $155,440
**$34,000 + $57,400 + $7,200 + $132,500 + $6,950 = $238,050
b. Acid-test ratio
= 1.1 to 1
= 1.1 to 1
**$34,000 + $57,400 + $ 7,200 = $98,600
c. Accounts receivable turnover
= 20.2 times = 14.8 times
d. Inventory turnover
e. Days’ sales in inventory
f. Days’ sales uncollected
Short-term credit risk analysis: Barco and Kyan have essentially equal
$770,000
($37,400 + $9,100 + $29,800)/2
$585,100
$880,200
($57,400 + $7,200 + $54,200)/2
$155,440*
$61,340
$66,000*
$61,340
$238,050**
$93,300
$98,600**
$93,300
$632,500
Problem 17-5A (Concluded)
Part 2
Barco Company
Kyan Company
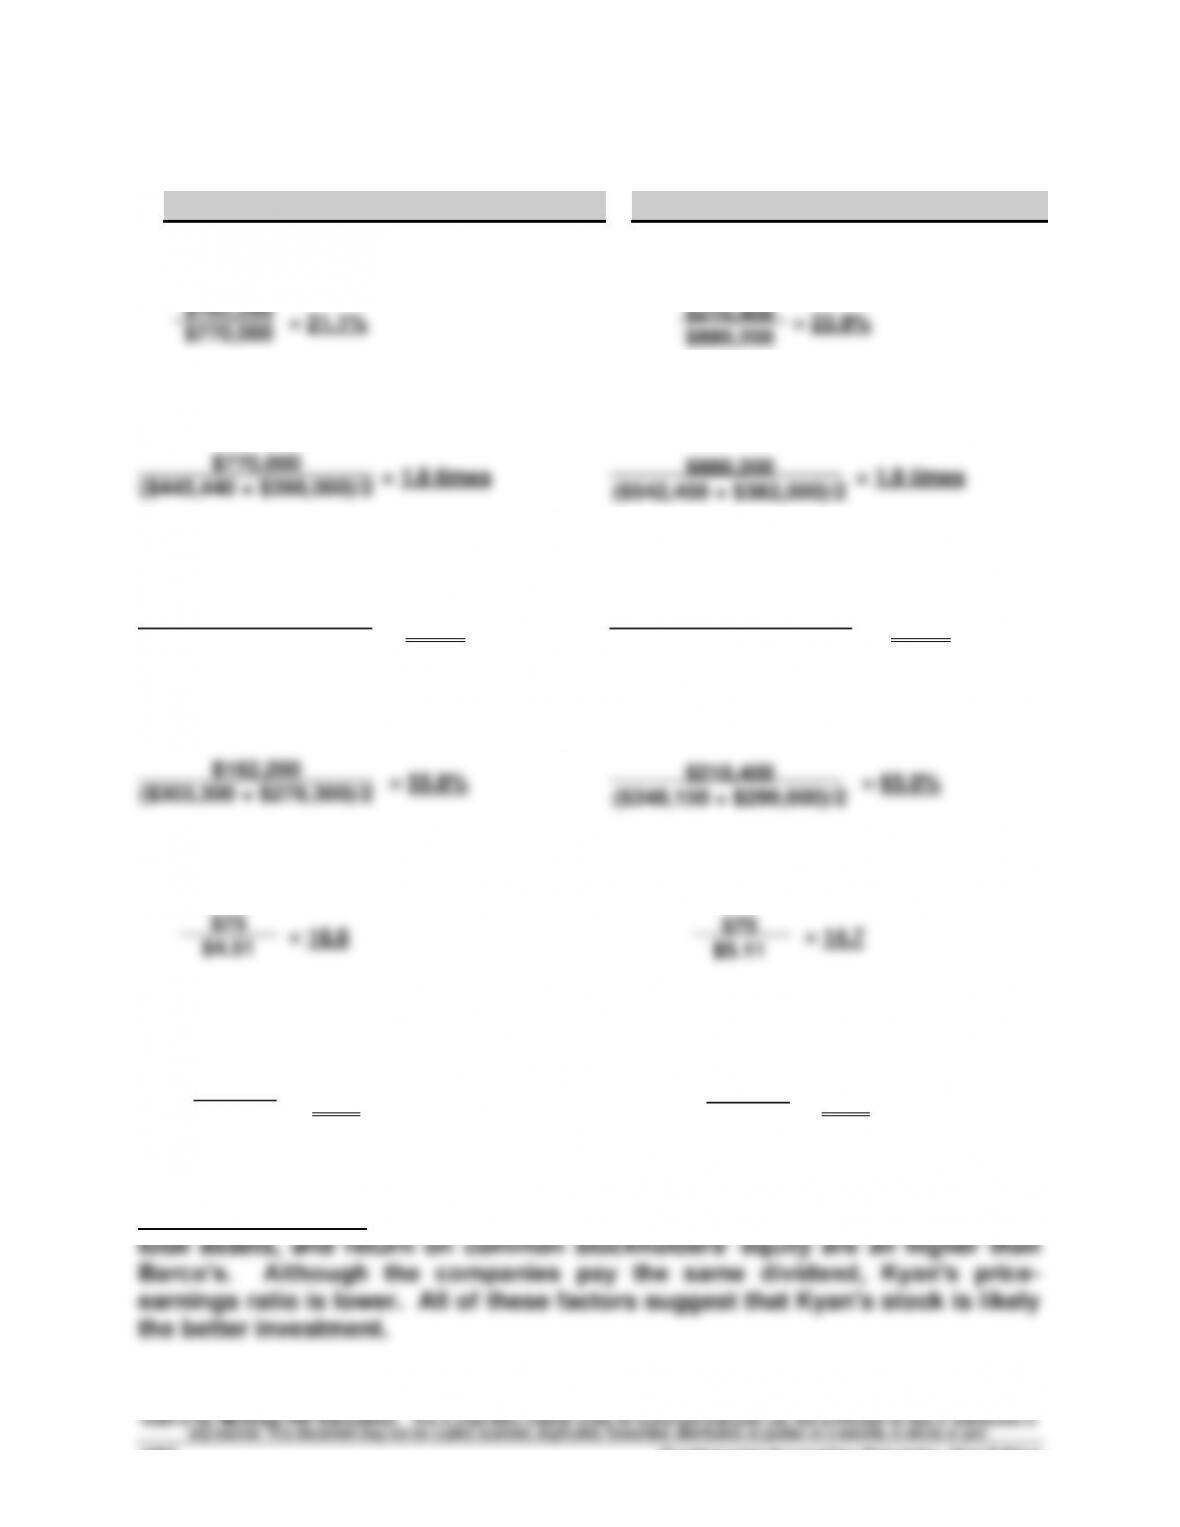
a. Profit margin ratio
b. Total asset turnover
c. Return on total assets
= 38.5% = 45.5%
d. Return on common stockholders’ equity
e. Price-earnings ratio
f. Dividend yield
= 5.1% = 5.1%
Investment analysis: Kyan’s profit margin ratio, total asset turnover, return on
$162,200
$770,000
($445,440 + $398,000)/2
$162,200
($445,440 + $398,000)/2
$3.80
$75
$210,400
$880,200
($542,450 + $382,500)/2
$210,400
($542,450 + $382,500)/2
$3.80
$75
Problem 17-6AA (60 minutes)
Part 1
Effect of income taxes (debits or losses in parentheses)
Pretax
30% Tax
Effect
After-Tax
i. Loss from operating a discontinued segment …………..
(18,250)
(5,475)
(12,775)
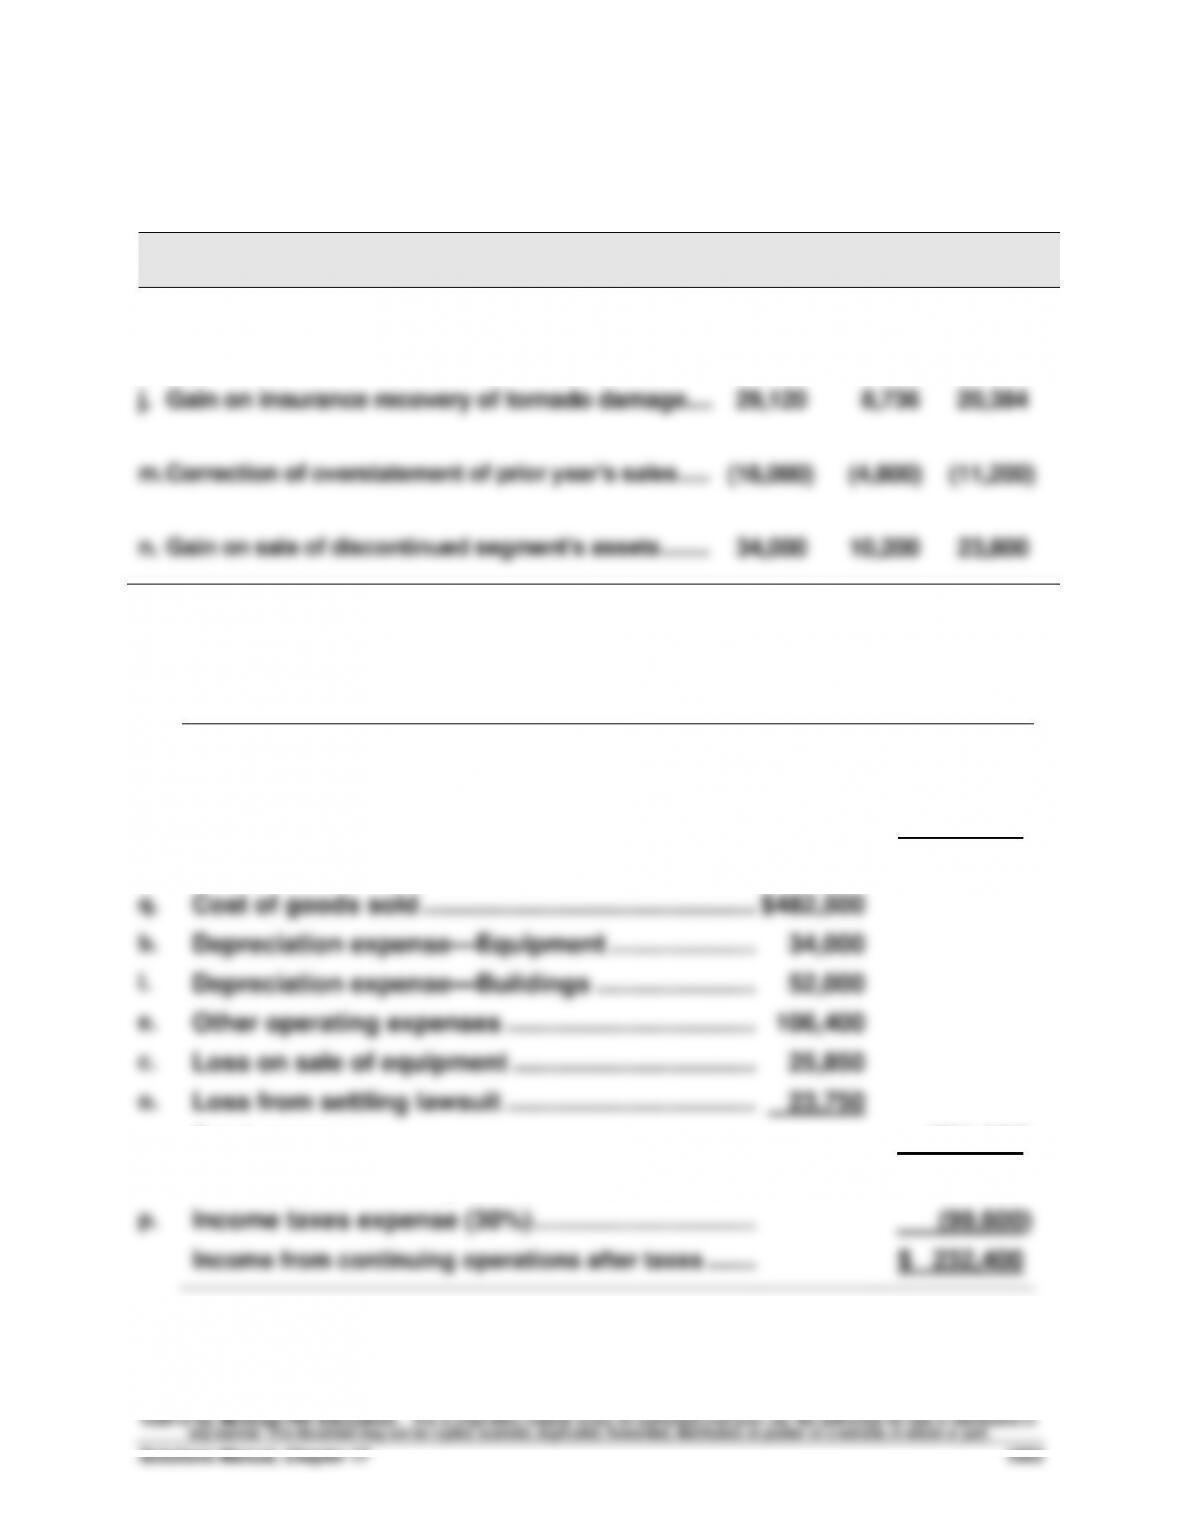
j. Gain on insurance recovery of tornado damage …...
29,120
8,736
20,384
m. Correction of overstatement of prior year’s sales ……..
(16,000)
(4,800)
(11,200)
n. Gain on sale of discontinued segment’s assets ………..
34,000
10,200
23,800
Part 2 Income from continuing operations (and its components)
k.
Net sales ………………………………………………………...
$ 998,500
a.
Interest revenue ……………………………………………...
14,000
g.
Gain from settling lawsuit ………………………………..
44,000
Total revenues and gains ………………………………..
1,056,500
q.
Cost of goods sold ………………………………………….
$482,500
b.
Depreciation expense—Equipment ………………….
34,000
l.
Depreciation expense—Buildings …………………...
52,000
e.
Other operating expenses ……………………………….
106,400
c.
Loss on sale of equipment ……………………………...
25,850
o.
Loss from settling lawsuit …………………………..…..
23,750
Total expenses ………………………………………………..
(724,500)
Income from continuing operations before taxes …..
332,000
p.
Income taxes expense (30%) …………………………..
(99,600)
Income from continuing operations after taxes ……..
$ 232,400
Fundamental Accounting Principles, 21st Edition
1004
Problem 17-6AA (Concluded)
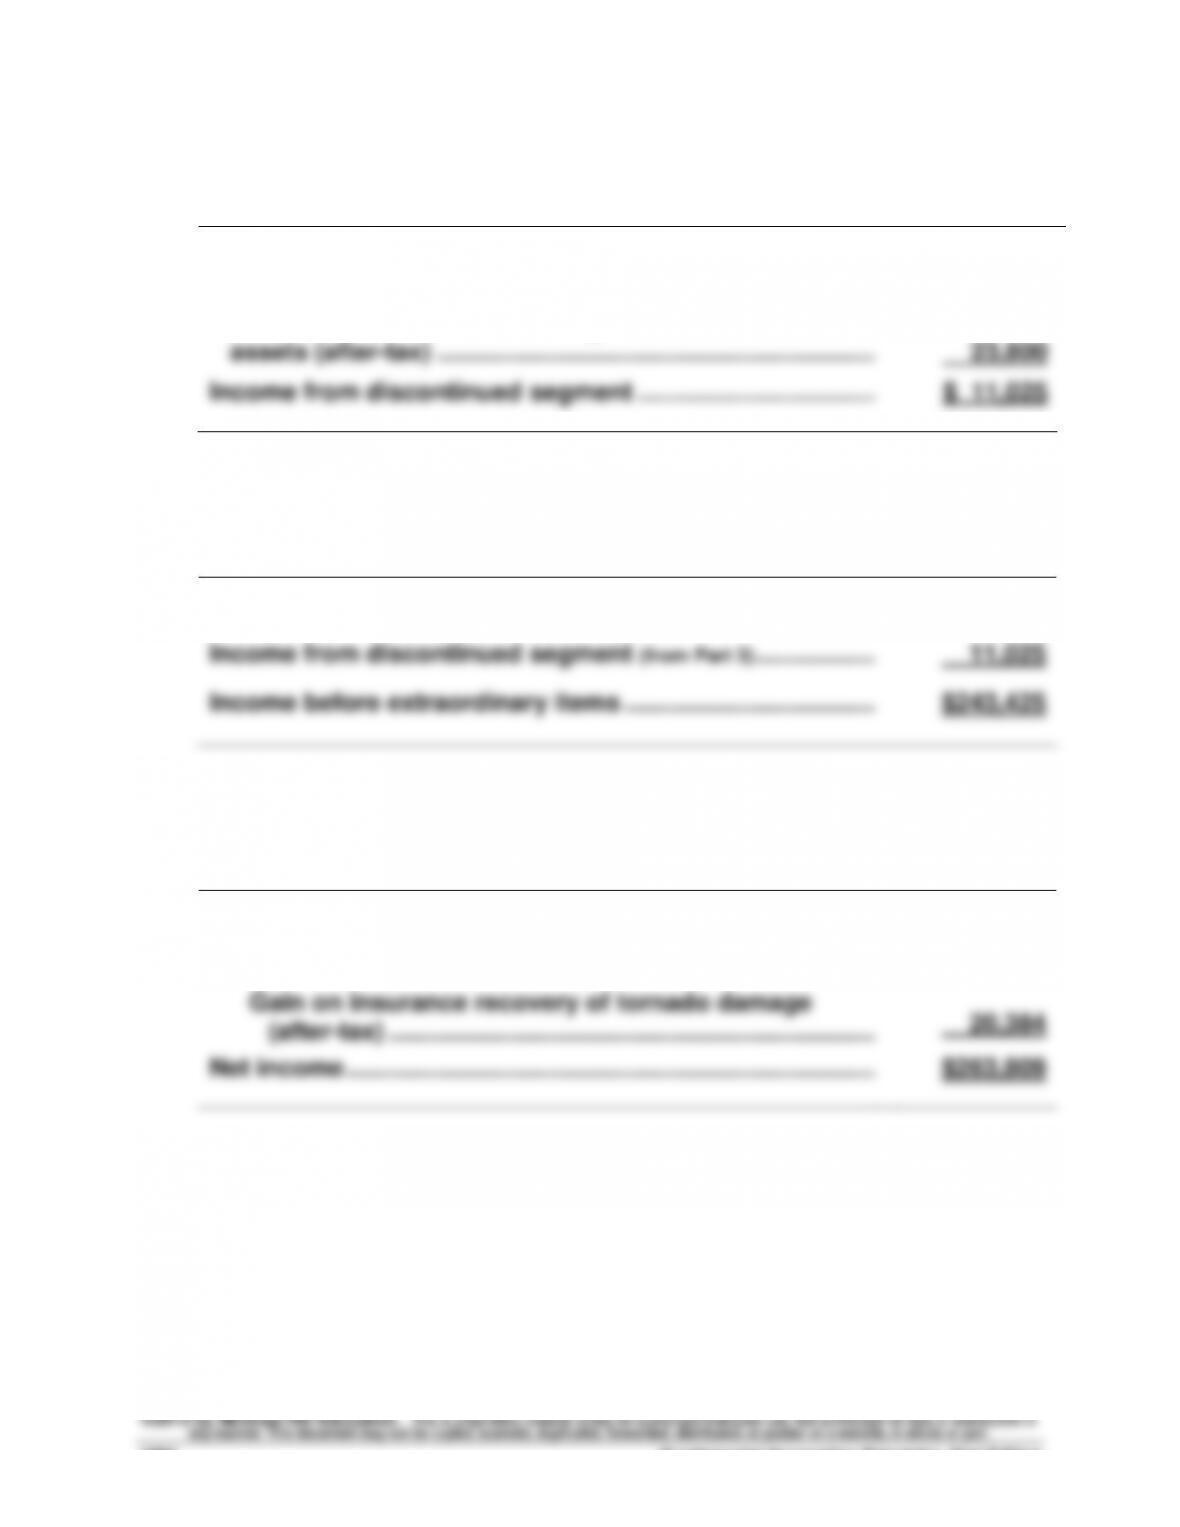
Part 3 Income from discontinued segment
i.
Loss from operating a discontinued
segment (after-tax) …………………………………………………….…
$ (12,775)
n.
Gain on sale of discontinued segment’s
assets (after-tax) ……………………………………………………….
23,800
Income from discontinued segment ……………………………..…………………..
$ 11,025
Part 4 Income before extraordinary items
Income from continuing oper. after taxes (from Part 2) …………………………..
$232,400
Income from discontinued segment (from Part 3) …………………………..
11,025
Income before extraordinary items ……………………………….…………………..
$243,425
Part 5 Net income
Income before extraordinary items ……………………………….…………………..
$243,425
j.
Extraordinary item
Gain on insurance recovery of tornado damage
(after-tax) ……………………………………………………………..…………………..
20,384
Net income …………………………………………………………………..……………….
$263,809
PROBLEM SET B
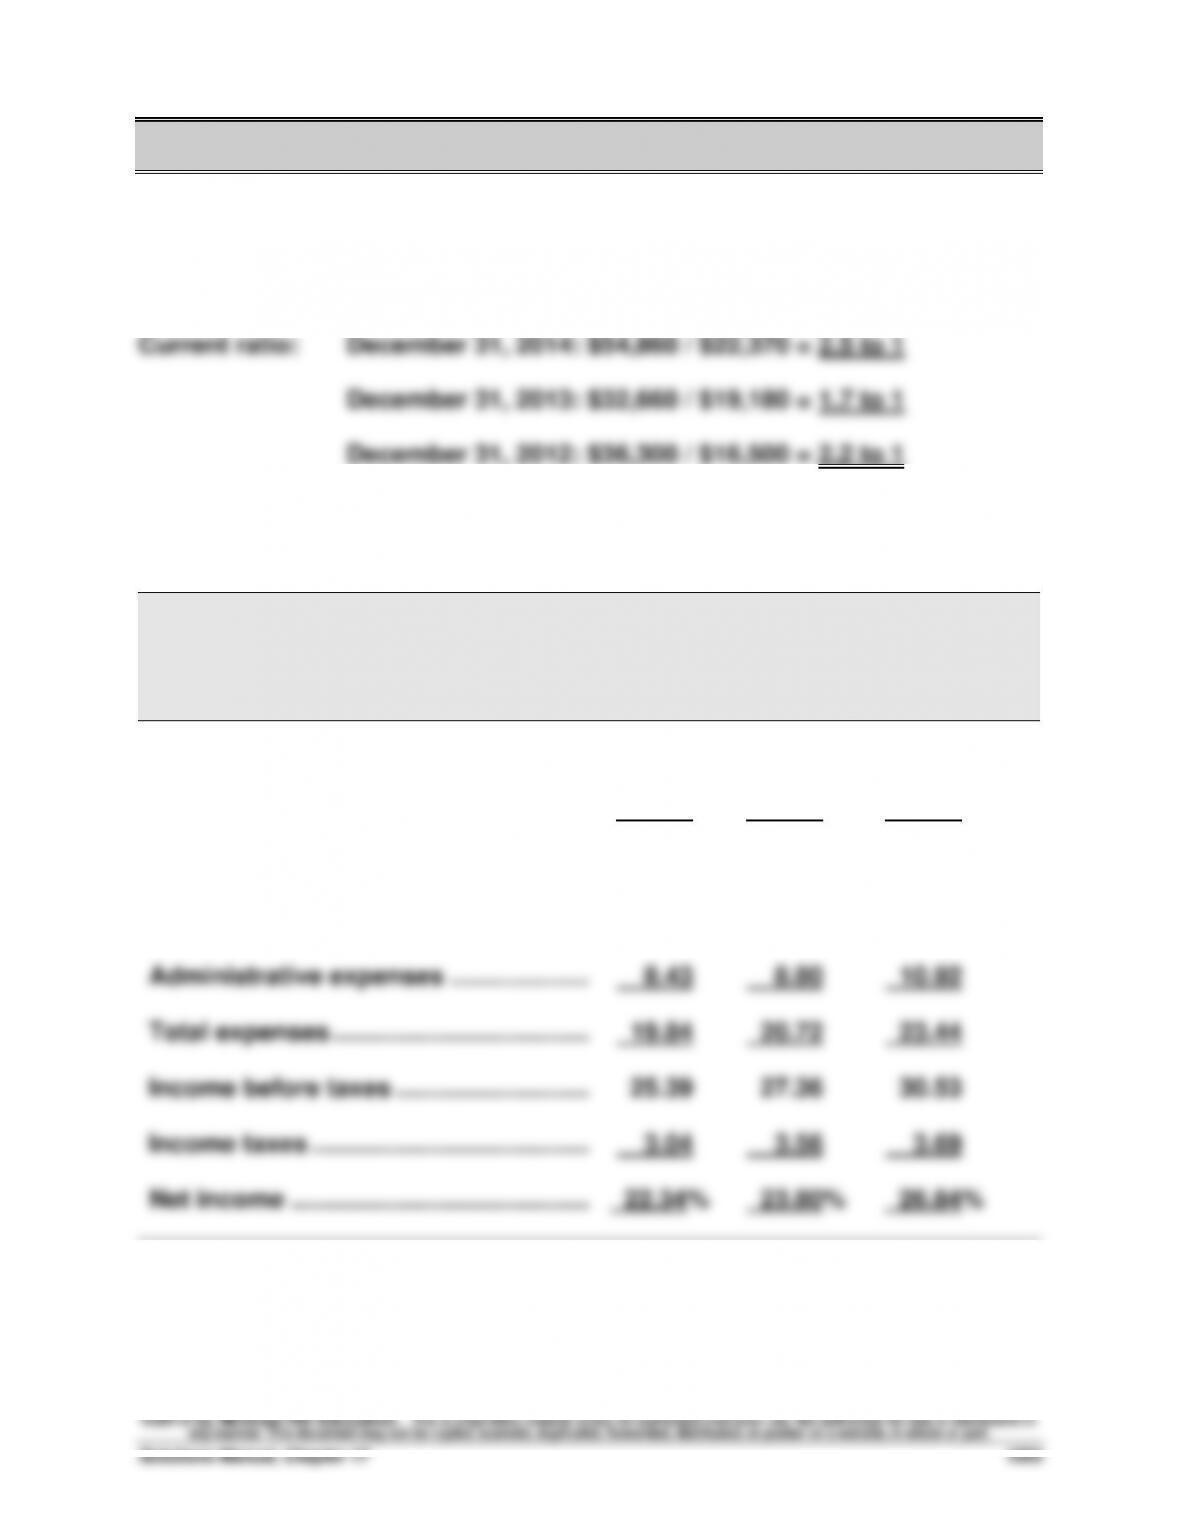
Problem 17-1B (60 minutes)
Part 1
Part 2
BLUEGRASS CORPORATION
Common-Size Comparative Income Statements
For Years Ended December 31, 2014, 2013, and 2012
2014
2013
2012
Sales ……………………………………………………
100.00%
100.00%
100.00%
Cost of goods sold …………………………..
54.77
51.91
46.04
Gross profit …………………………………………
45.23
48.09
53.96
Selling expenses …………………………….……
11.41
11.92
12.52
Administrative expenses ………………..……
8.43
8.80
10.92
Total expenses ……………………………….……
19.84
20.72
23.44
Income before taxes ……………………….….
25.39
27.36
30.53
Income taxes ………………………………….……
3.04
3.56
3.69
Net income …………………………………….……
22.34%
23.80%
26.84%
* Some totals do not reconcile due to rounding.
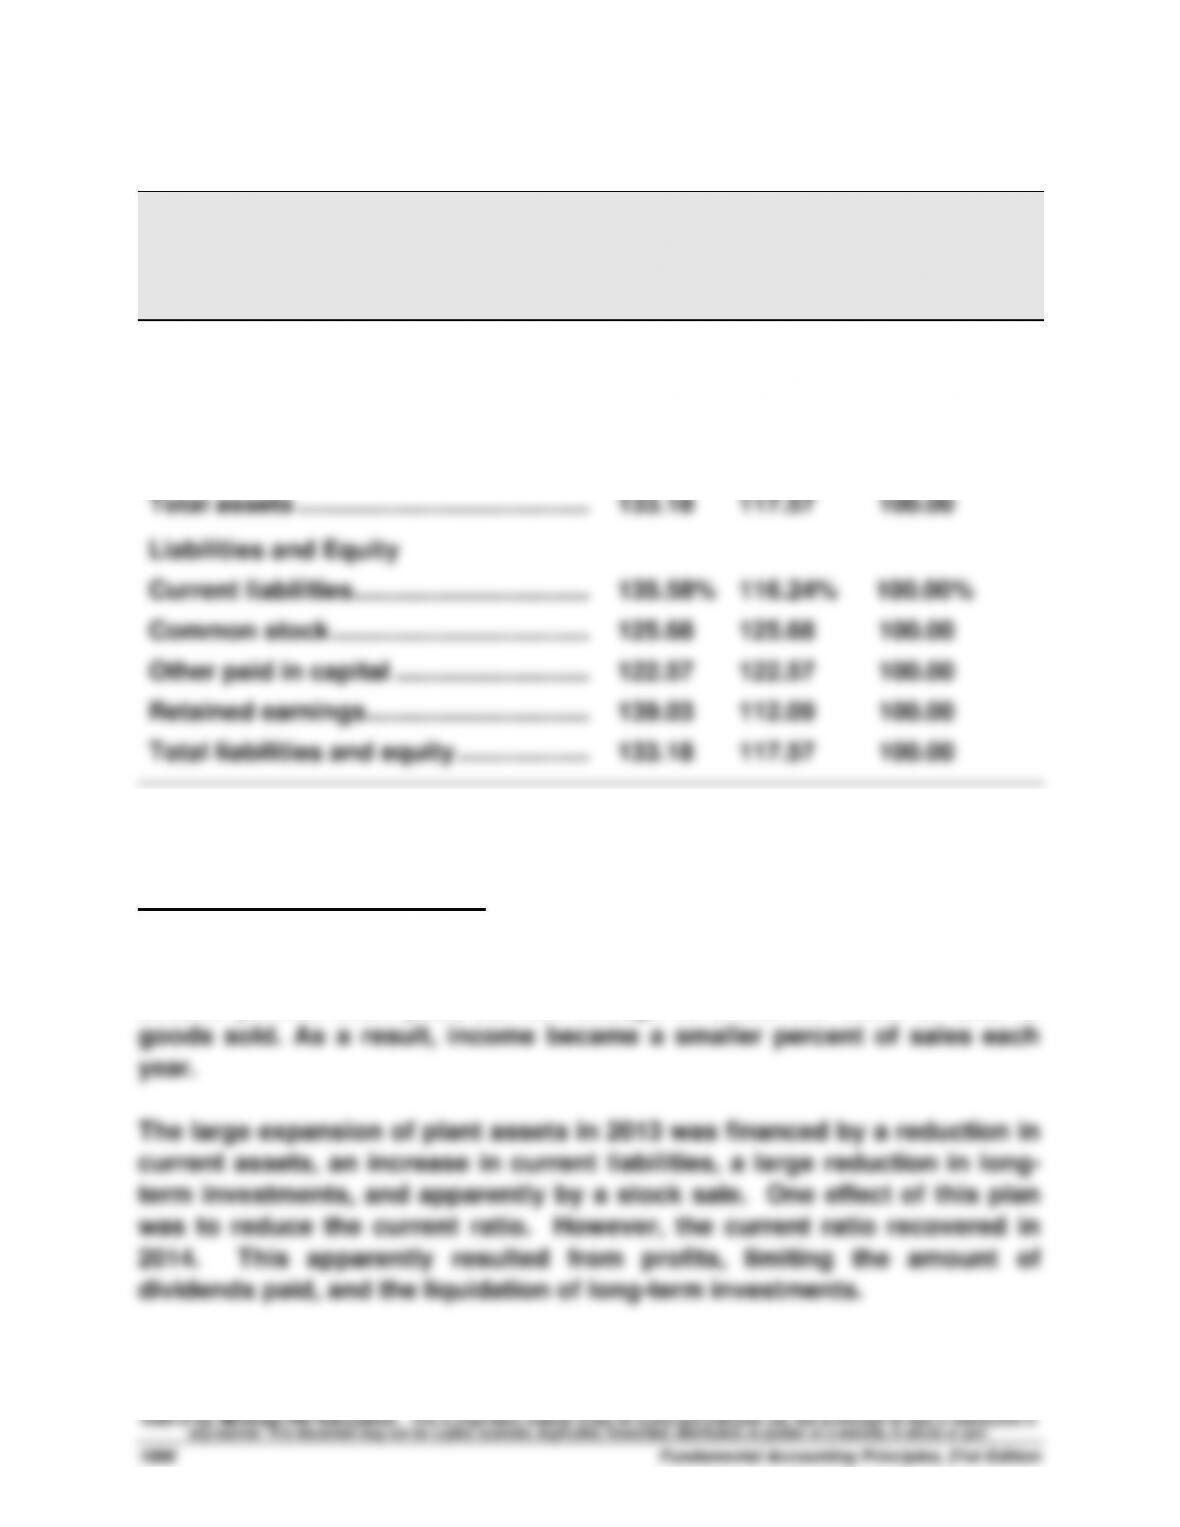
Problem 17-1B (Concluded)
Part 3
BLUEGRASS CORPORATION
Balance Sheet Data in Trend Percents
December 31, 2014, 2013, and 2012
2014
2013
2012
Assets
Current assets ………………………………..……
151.13%
89.97%
100.00%
Long-term investments …………………..……
0.00
16.04
100.00
Plant assets …………………………………………
142.80
143.87
100.00
Total assets …………………………………………
133.18
117.57
100.00
Liabilities and Equity
Current liabilities…………………………….……
135.58%
116.24%
100.00%
Common stock ……………………………….……
125.68
125.68
100.00
Other paid in capital ……………………….….
122.57
122.57
100.00
Retained earnings …………………………..
139.03
112.09
100.00
Total liabilities and equity ……………….……
133.18
117.57
100.00
Part 4
Significant relations revealed
Bluegrass’s cost of goods sold took a larger percent of sales each year.
Selling and administrative expenses and income taxes took a somewhat
smaller portion each year, but not enough to offset the effect of cost of