Student Name:
Class:
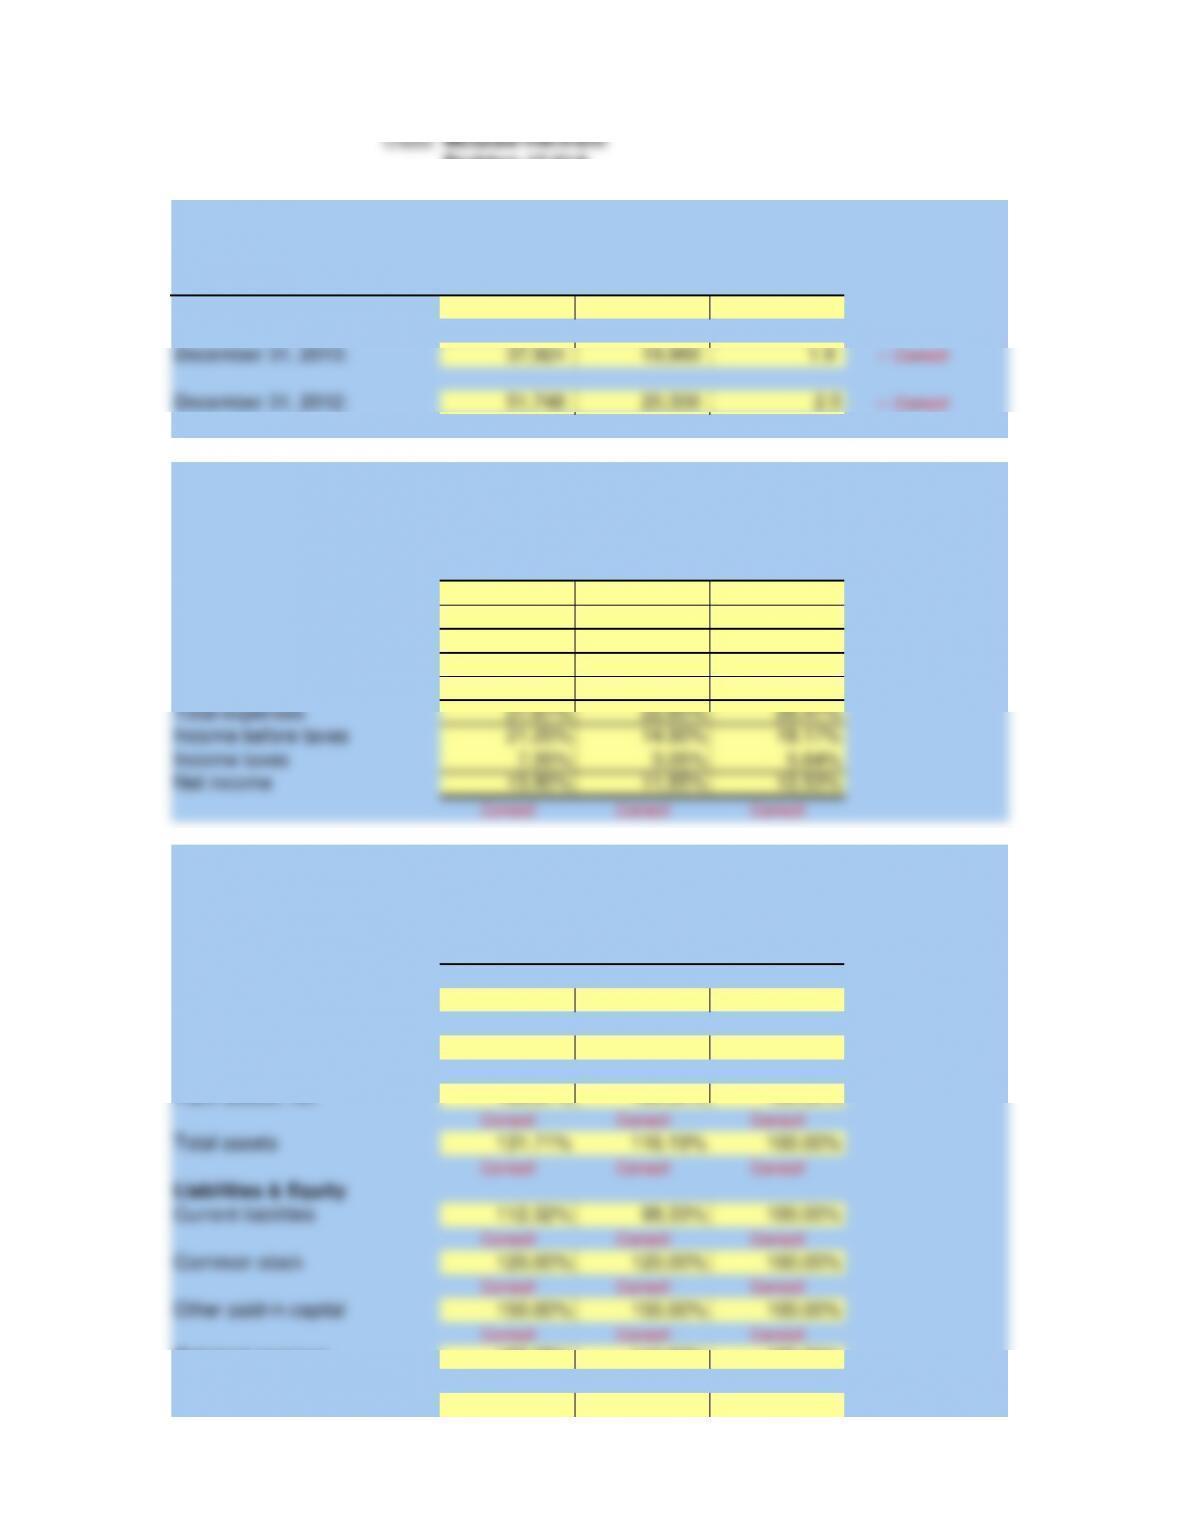
Assets Liabilities Ratio
52,390$ 22,800$ 2.3 «- Correct!
37,924 19,960 1.9 «- Correct!
51,748 20,300 2.5 «- Correct!
2014 2013 2012
100.00% 100.00% 100.00%
51.08% 62.50% 55.36%
48.92% 37.50% 44.64%
18.54% 13.80% 18.27%
9.13% 8.80% 8.20%
27.67% 22.60% 26.47%
21.25% 14.90% 18.17%
7.35% 3.05% 5.64%
13.90% 11.85% 12.53%
Correct! Correct! Correct!
2014 2013 2012
101.24% 73.29% 100.00%
Correct! Correct! Correct!
0.00% 12.66% 100.00%
Correct! Correct! Correct!
166.67% 160.00% 100.00%
Correct! Correct! Correct!
131.71% 116.19% 100.00%
Correct! Correct! Correct!
112.32% 98.33% 100.00%
Common stock
Other paid-in capital
Retained earnings
Total liabilities and equity
Current Ratios
KORBIN COMPANY
December 31, 2014:
December 31, 2013:
Total expenses
Income before taxes
December 31, 2012:
Sales
For Years Ended December 31, 2014, 2013, and 2012
KORBIN COMPANY
Cost of goods sold
Total assets
Liabilities & Equity
Current liabilities
Problem 17-01A
McGraw-Hill/Irwin
Instructor
Income taxes
Net income
Assets
Current assets
Long-term investments
Plant assets, net
Gross profit
Selling expenses
Administrative expenses

Correct! Correct! Correct!
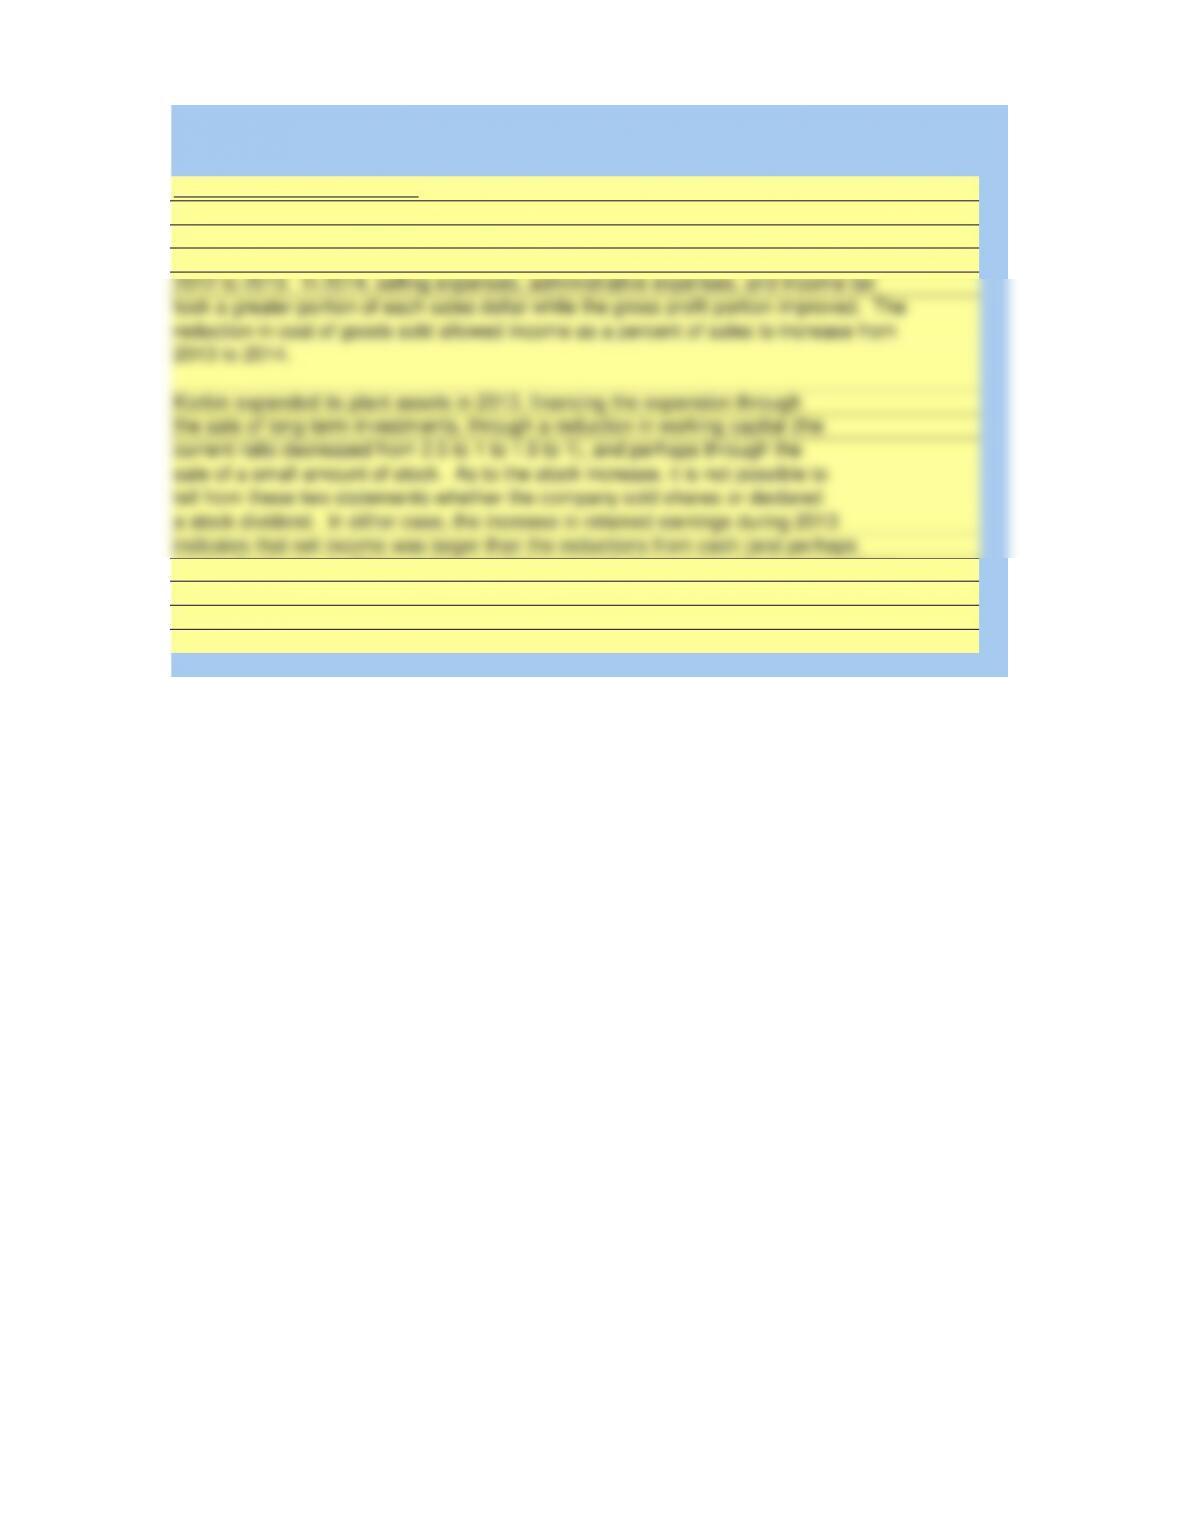
Part 4: Comment on any significant relations revealed
by the ratios and percents computed.
Significant relations revealed
Korbin’s selling expenses and income taxes consumed smaller portions of each sales
consumed a larger portion in 2013. Therefore, income as a percent of sales declined from
2012 to 2013. In 2014, selling expenses, administrative expenses, and income tax
took a greater portion of each sales dollar while the gross profit portion improved. The
reduction in cost of goods sold allowed income as a percent of sales to increase from
2013 to 2014.
Korbin expanded its plant assets in 2013, financing the expansion through
the sale of long-term investments, through a reduction in working capital (the
current ratio decreased from 2.5 to 1 to 1.9 to 1), and perhaps through the
sale of a small amount of stock. As to the stock increase, it is not possible to
tell from these two statements whether the company sold shares or declared
a stock dividend. In either case, the increase in retained earnings during 2013
indicates that net income was larger than the reductions from cash (and perhaps
stock) dividends. In 2014, working capital increased, the current ratio increased from
1.9-to-1 to 2.3-to-1, and cash dividends were paid.
dollar in 2013 than 2012. However, cost of goods sold and administrative expenses
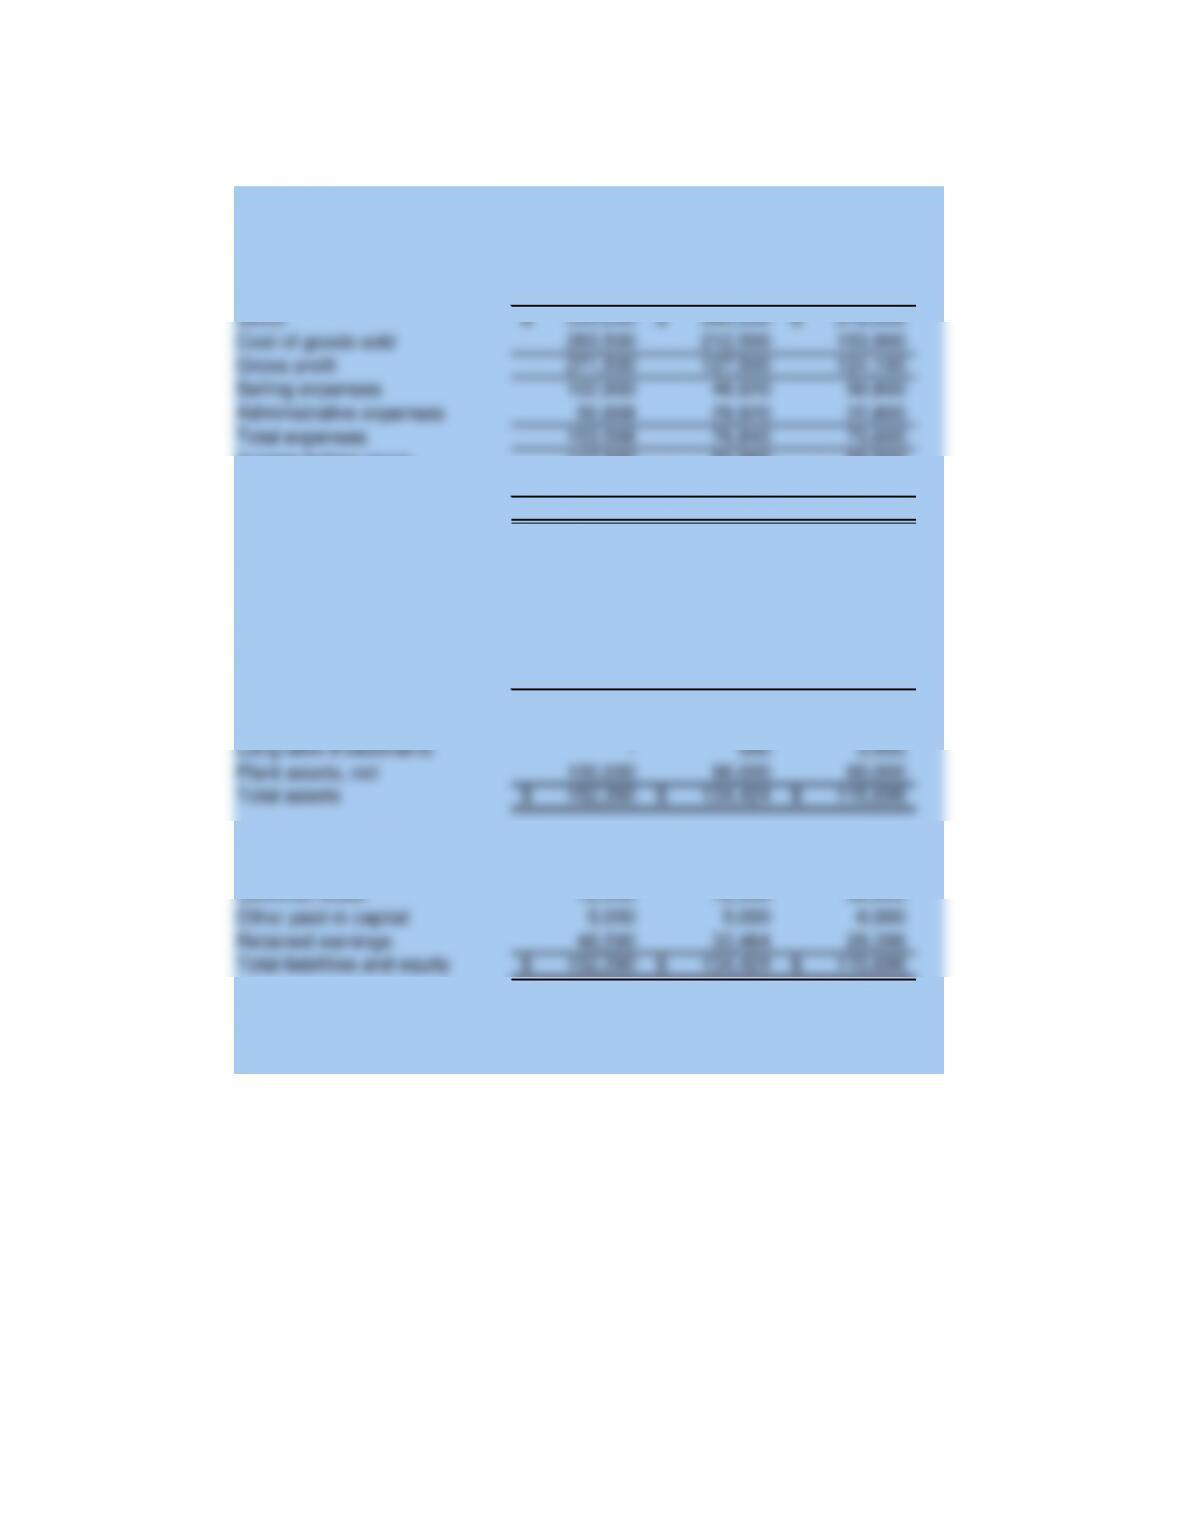
2014 2013 2012
555,000$ 340,000$ 278,000$
283,500 212,500 153,900
271,500 127,500 124,100
102,900 46,920 50,800
50,668 29,920 22,800
153,568 76,840 73,600
117,932 50,660 50,500
40,800 10,370 15,670
77,132$ 40,290$ 34,830$
2014 2013 2012
52,390$ 37,924$ 51,748$
– 500 3,950
152,390$ 134,424$ 115,698$
Plant assets, net
Total assets
Liabilities and Equity
Current liabilities
72,000 72,000 60,000
9,000 9,000 6,000
48,590 33,464 29,398
152,390$ 134,424$ 115,698$
131.71%
Cost of goods sold
Gross profit
Given Data P17-01A:
For Years Ended December 31, 2014, 2013, and 2012
Comparative Income Statements
KORBIN COMPANY
Sales
Selling expenses
Administrative expenses
Total expenses
Income before taxes
Income taxes
Net income
December 31, 2014, 2013, and 2012
Comparative Balance Sheets
KORBIN COMPANY
Assets
Current assets
Long-term investments
Check figure:
(3) 2014, Total assets trend
Common stock
Other paid-in capital
Retained earnings
Total liabilities and equity
Student Name:
Class:
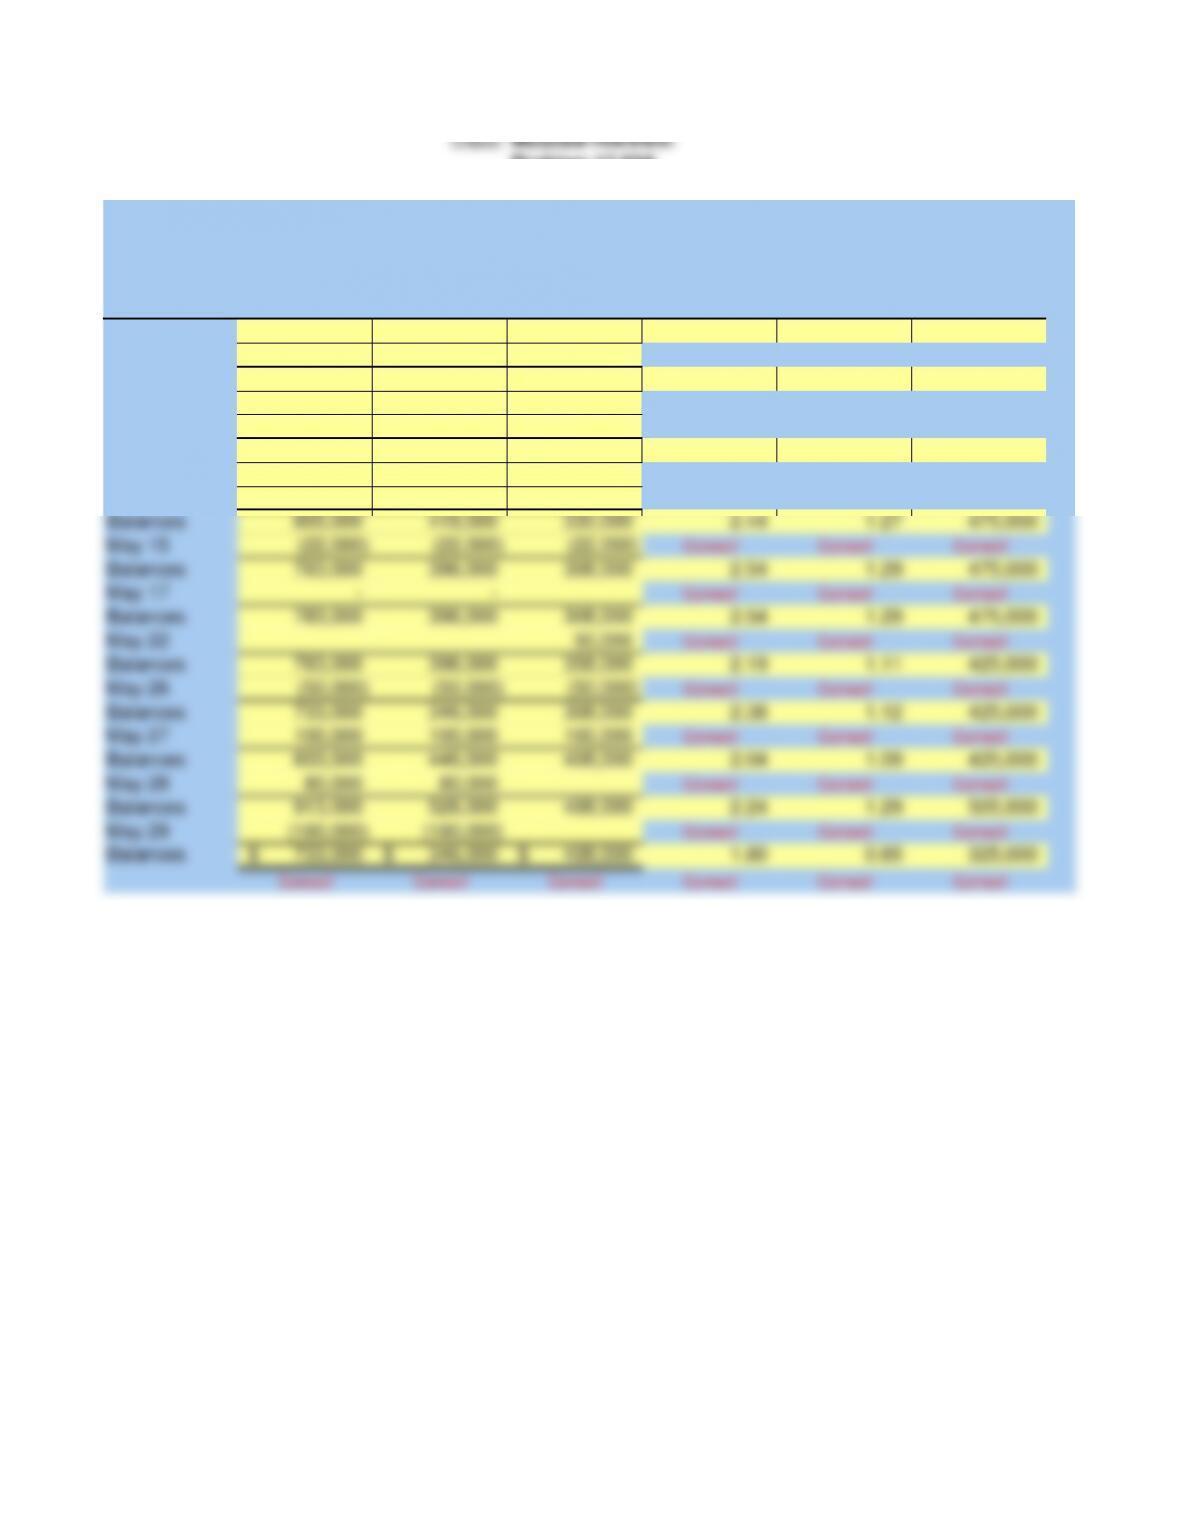
Current Quick Current Current Acid-Test Working
Transaction Assets Assets Liabilities Ratio Ratio Capital
Beginning 700,000$ 308,000$ 280,000$ 2.50 1.10 420,000
May 2 50,000 50,000 Correct! Correct! Correct!
Balances 750,000 308,000 330,000 2.27 0.93 420,000
May 8 110,000 110,000 Correct! Correct! Correct!
(55,000)
Balances 805,000 418,000 330,000 2.44 1.27 475,000
May 10 20,000 20,000 Correct! Correct! Correct!
(20,000) (20,000)
Balances 805,000 418,000 330,000 2.44 1.27 475,000
May 15 (22,000) (22,000) (22,000) Correct! Correct! Correct!
Balances 783,000 396,000 308,000 2.54 1.29 475,000
May 17 – – Correct! Correct! Correct!
Balances 783,000 396,000 308,000 2.54 1.29 475,000
May 22 50,000 Correct! Correct! Correct!
Balances 783,000 396,000 358,000 2.19 1.11 425,000
May 26 (50,000) (50,000) (50,000) Correct! Correct! Correct!
Balances 733,000 346,000 308,000 2.38 1.12 425,000
May 27 100,000 100,000 100,000 Correct! Correct! Correct!
Balances 833,000 446,000 408,000 2.04 1.09 425,000
May 28 80,000 80,000 Correct! Correct! Correct!
Balances 913,000 526,000 408,000 2.24 1.29 505,000
May 29 (180,000) (180,000) Correct! Correct! Correct!
Balances 733,000$ 346,000$ 408,000$ 1.80 0.85 325,000
Correct! Correct! Correct! Correct! Correct! Correct!
Instructor
Ratios and Working Capital
PLUM CORPORATION
Problem 17-03A
McGraw-Hill/Irwin
700,000$
2.50
1.10
May 2 50,000$
May 8 55,000$
110,000$
May 10 20,000$
May 15 22,000$
May 17 5,000$
May 22 1$
50,000
May 26 ?
May 27 100,000$
May 28 80,000$
May 29 180,000$
May 22: 2.19
1.11
May 29: 1.80
325,000$
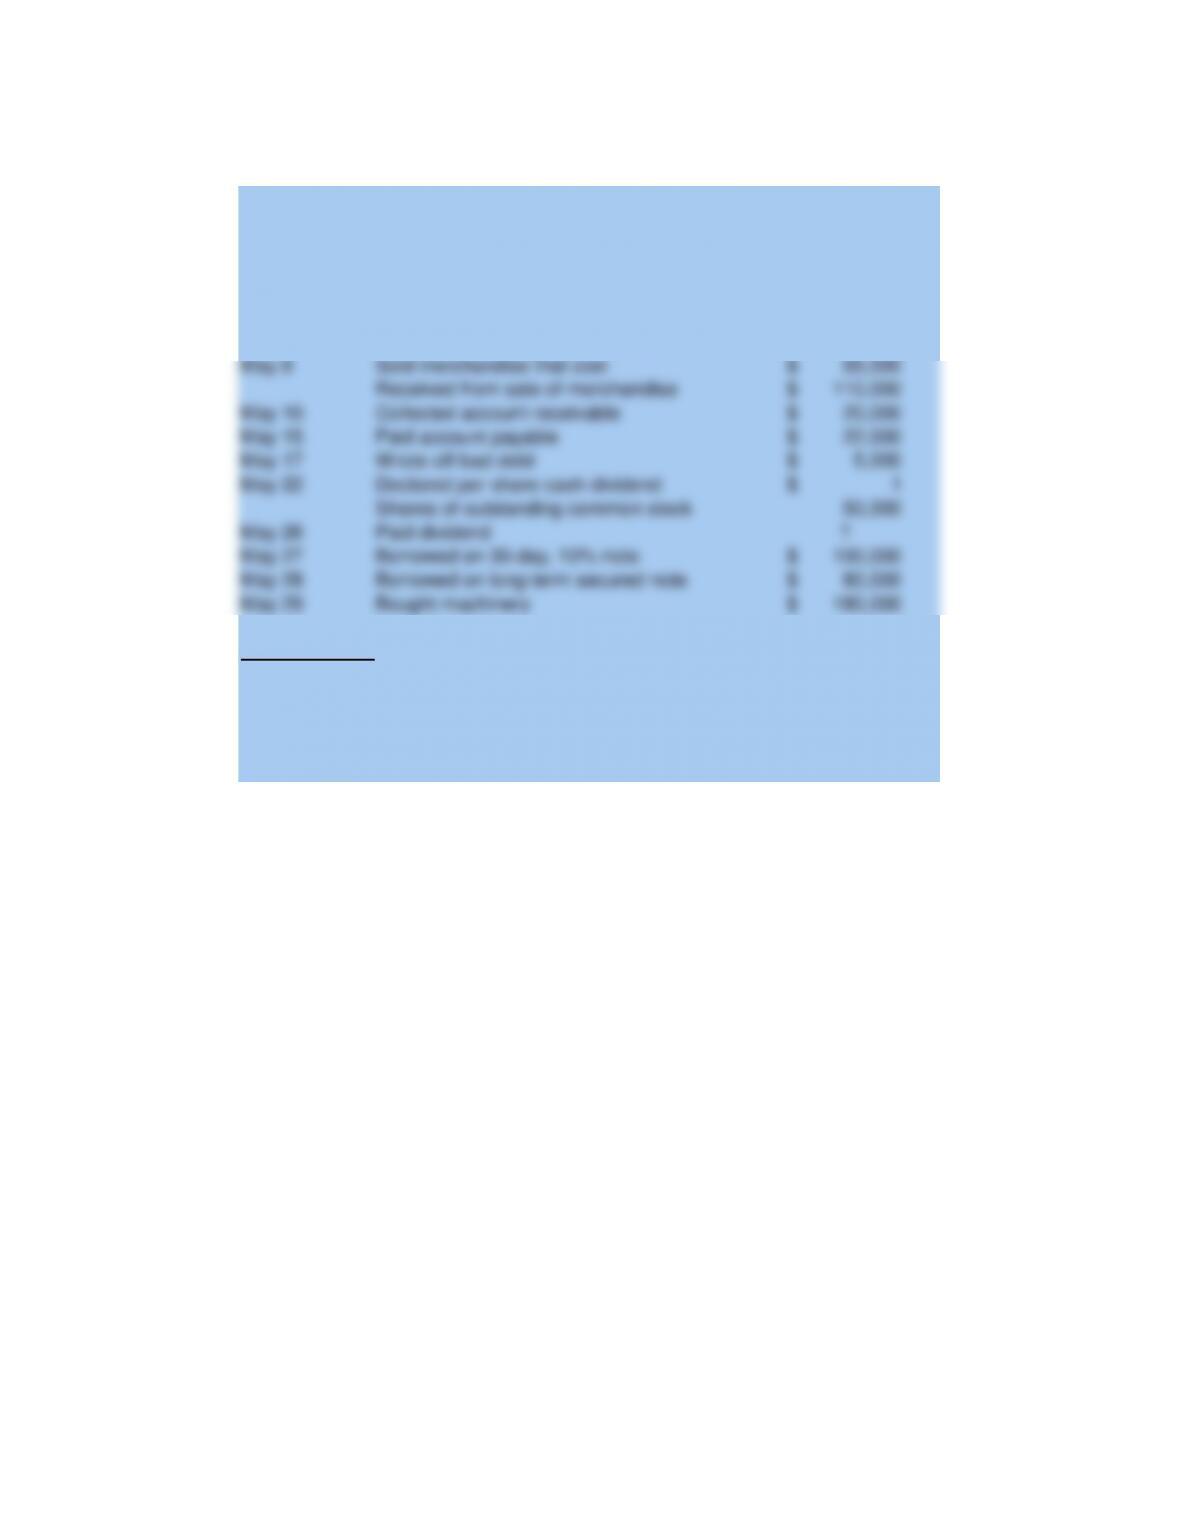
Purchased merchandise on credit
PLUM CORPORATION
Given Data P17-03A:
Current assets, beginning of May
Current ratio, beginning of May
Acid-test ratio, beginning of May
Sold merchandise that cost
Received from sale of merchandise
Collected account receivable
Paid account payable
Wrote off bad debt
Declared per share cash dividend
Shares of outstanding common stock
Paid dividend
Borrowed on 30-day, 10% note
Borrowed on long-term secured note
Bought machinery
Current ratio
Acid-test
Current ratio
Working capital
Check figures:
Student Name:
Class:
3.6 to 1
Correct!
2.2 to 1
Correct!
27.4 days
Correct!
7.3 times
Correct!
39.5 days
Correct!
0.57 to 1
Correct!
12.9 times
Correct!
6.5%
Correct!
2.1 times
Correct!
13.5%
Correct!
21.9%
Correct!
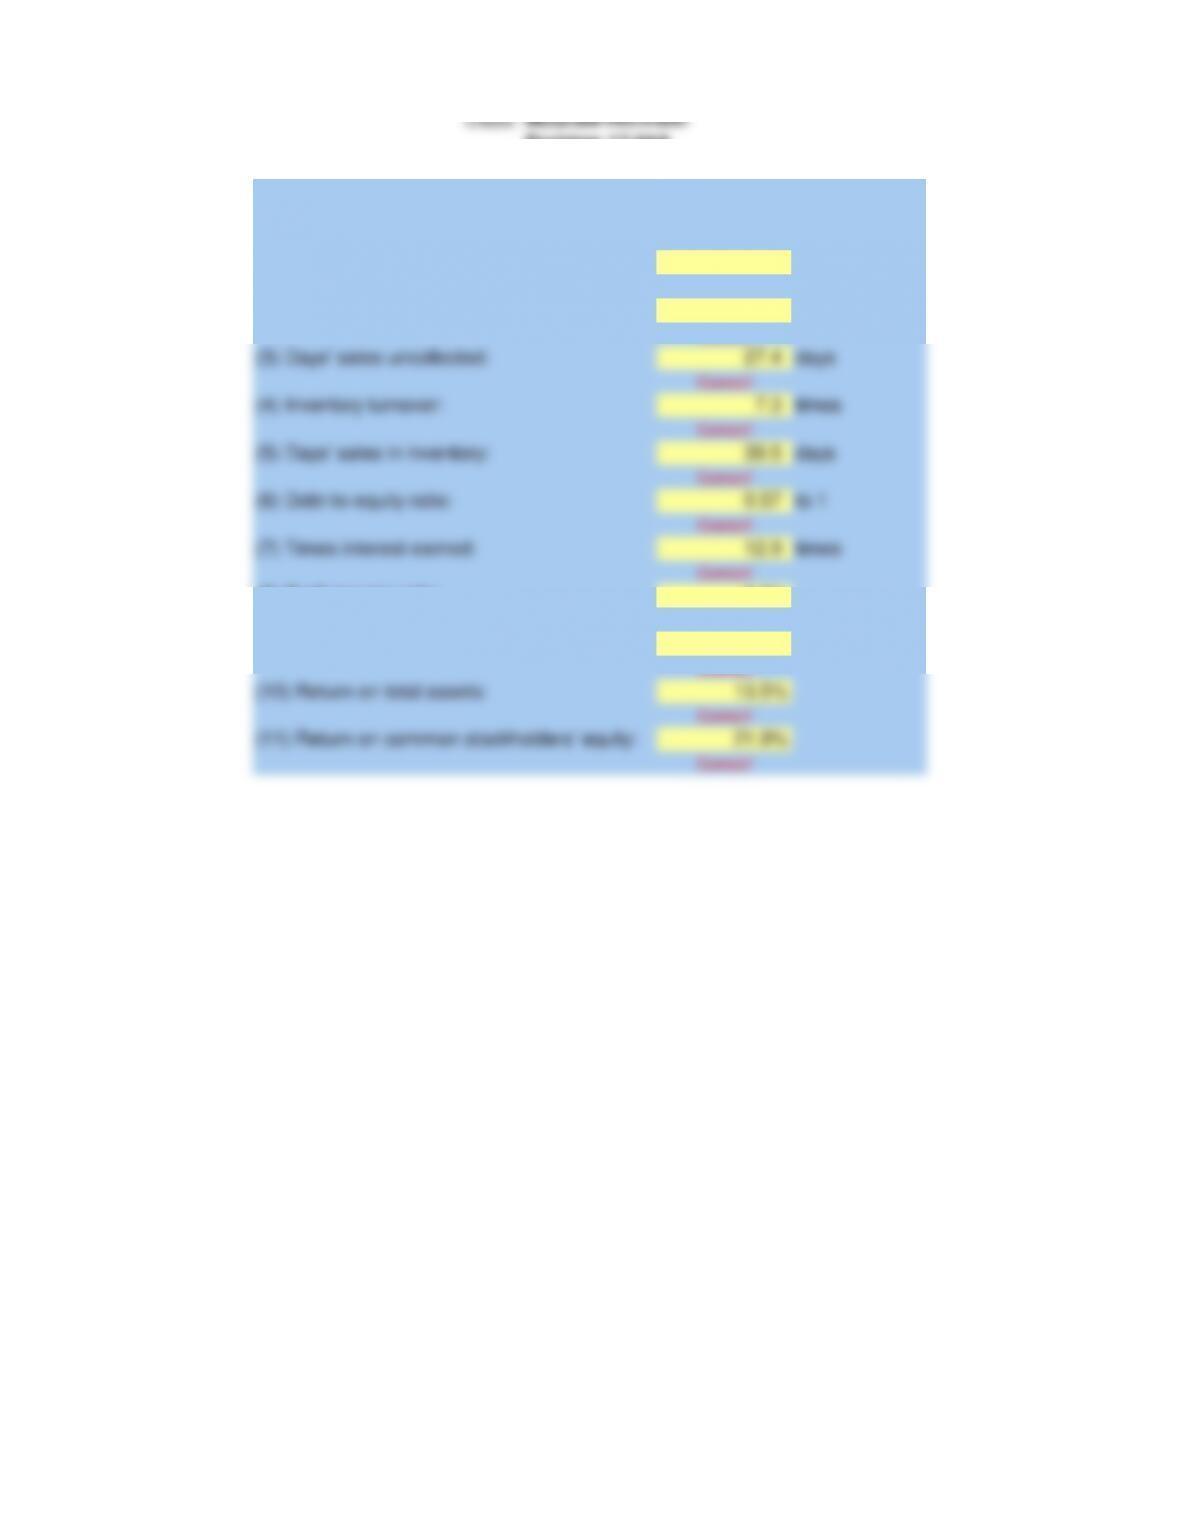
(1) Current ratio:
Problem 17-04A
McGraw-Hill/Irwin
Instructor
Ratios
CABOT CORPORATION
(7) Times interest earned:
(2) Acid-test ratio:
(3) Days’ sales uncollected:
(4) Inventory turnover:
(5) Days’ sales in inventory:
(6) Debt-to-equity ratio:
(11) Return on common stockholders’ equity:
(8) Profit margin ratio:
(9) Total asset turnover:
(10) Return on total assets:
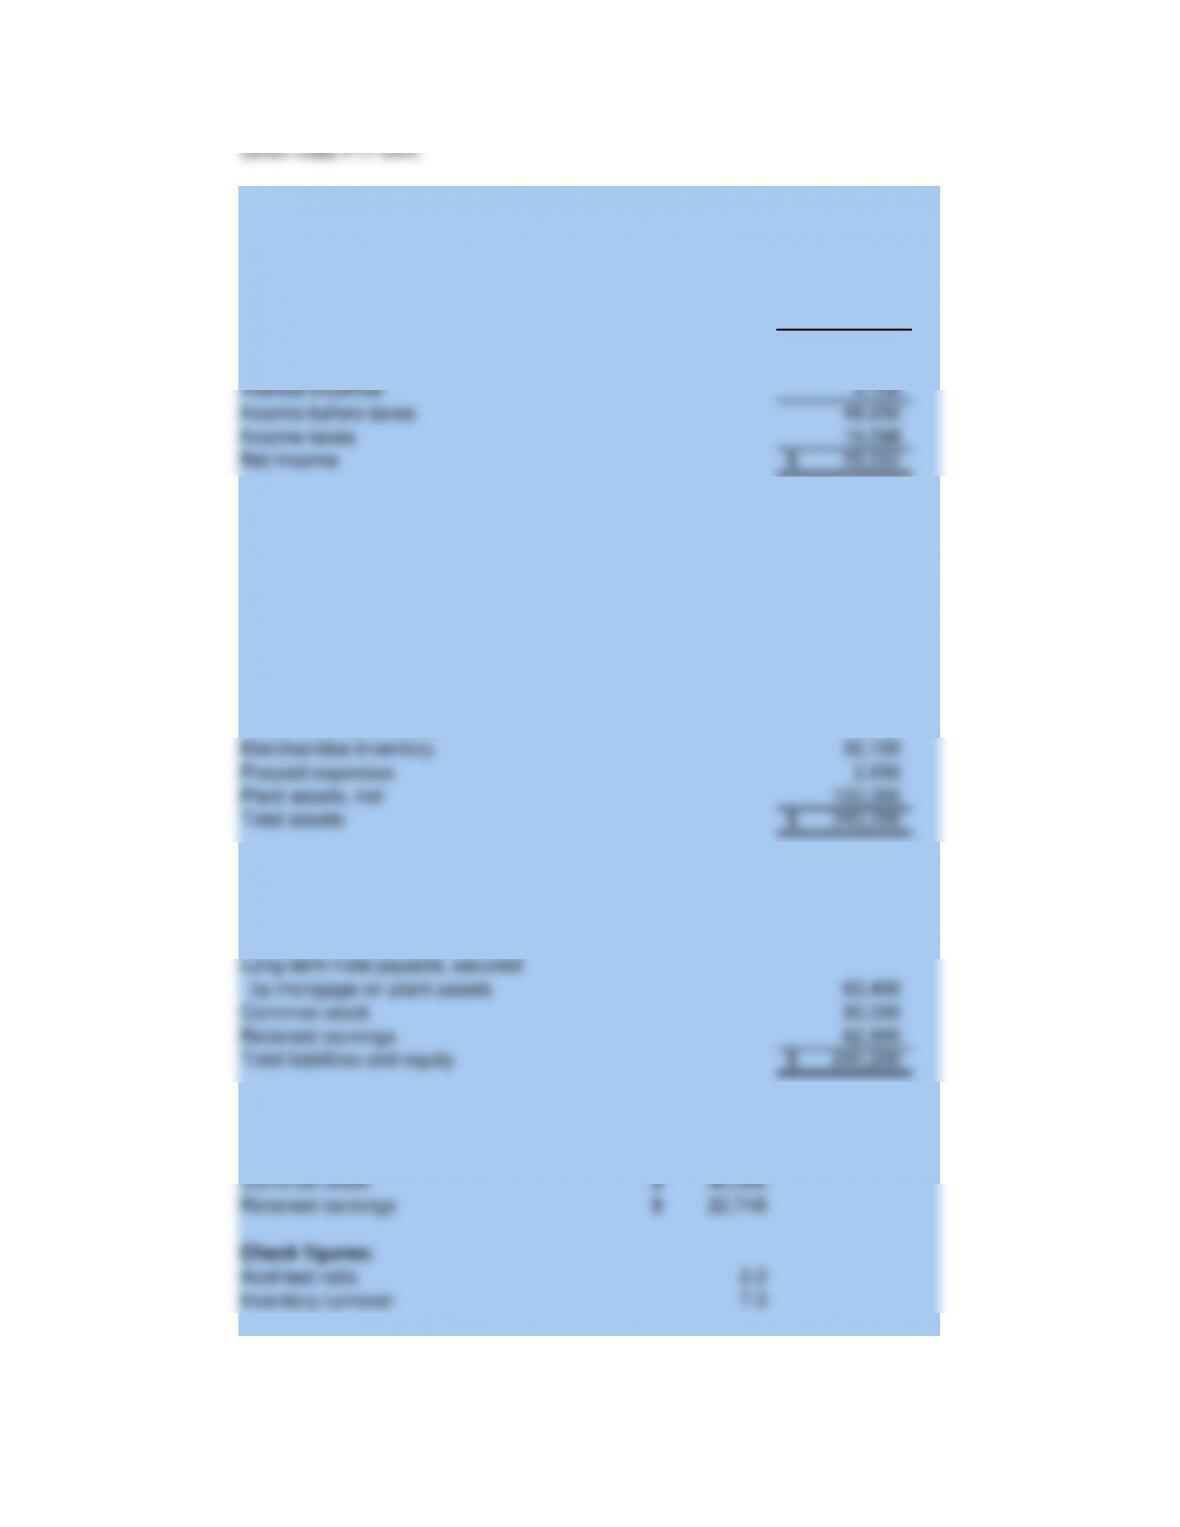
448,600$
297,250
151,350
98,600
4,100
48,650
19,598
29,052$
Prepaid expenses
Cash
Short-term investments
Accounts receivable, net
Notes receivable (trade)
Merchandise inventory
Plant assets, net
Accounts payable
Accrued wages payable
Income taxes payable
Long-term note payable, secured
by mortgage on plant assets
Common stock
Retained earnings
Acid-test ratio
Inventory turnover
Inventory
Total assets
Common stock
Retained earnings
Gross profit
Given Data P17-04A:
For Year Ended December 31, 2013
Income Statement
CABOT CORPORATION
Sales
Cost of goods sold
Operating expenses
Interest expense
Income before taxes
Income taxes
Net income
Balance Sheet
CABOT CORPORATION