Chapter 9 – Short-Term Profit Planning: Cost-Volume-Profit (CVP) Analysis
9-61
9-47 CVP Analysis, Activity-Based Costing (ABC) (30 min)
1. Total fixed overhead cost, including setup cost, is equal to $6,000,000 (i.e.,
$40/unit × 150,000 units).
Setup costs are $300 per setup (given). Under the current production plan
there are 3,000 setups, so total setup costs must be $900,000 (3,000 ×
$300).
Thus, the total fixed manufacturing costs for the current plan, other than
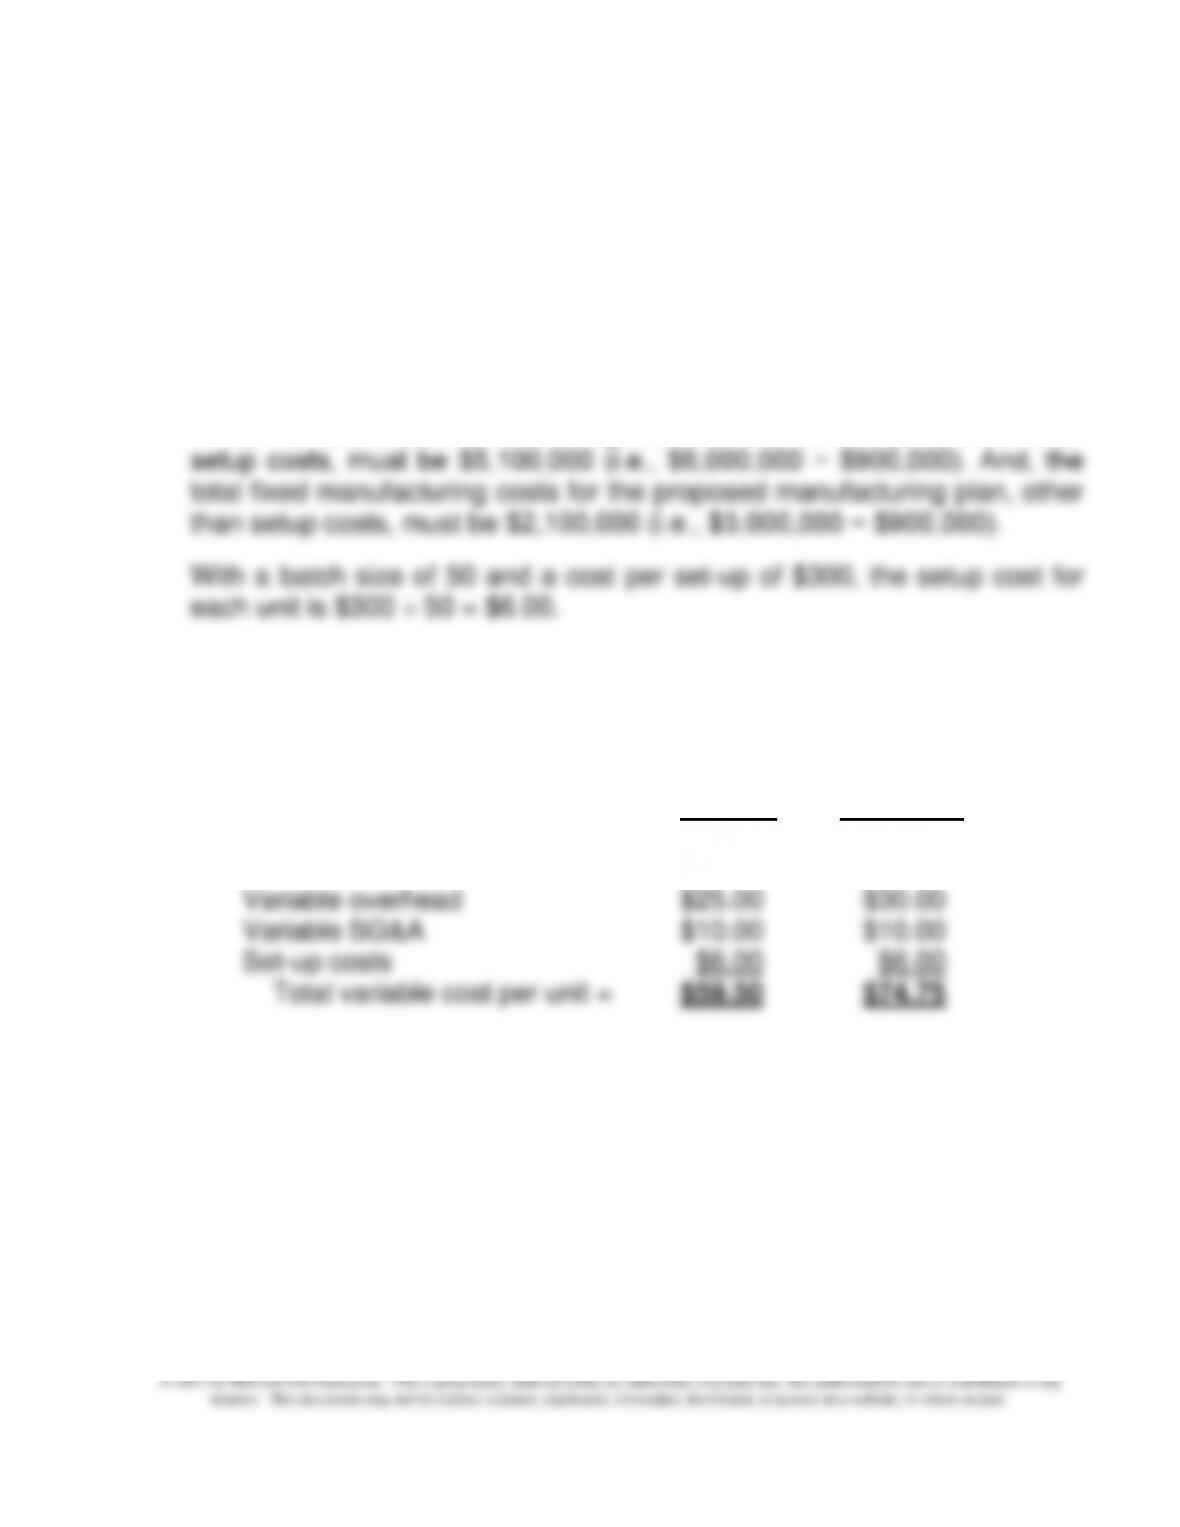
Therefore, under the current production plan, total variable costs per unit
are $59.50 (including setup costs), while under the proposed
manufacturing plan the variable cost per unit is $74.75 (including setup
costs), as follows:
Current Proposed
Materials and purchased parts $6.00 $15.00
Direct labor $12.50 $13.75
Chapter 9 – Short-Term Profit Planning: Cost-Volume-Profit (CVP) Analysis
9-62
9-47 (Continued-1)
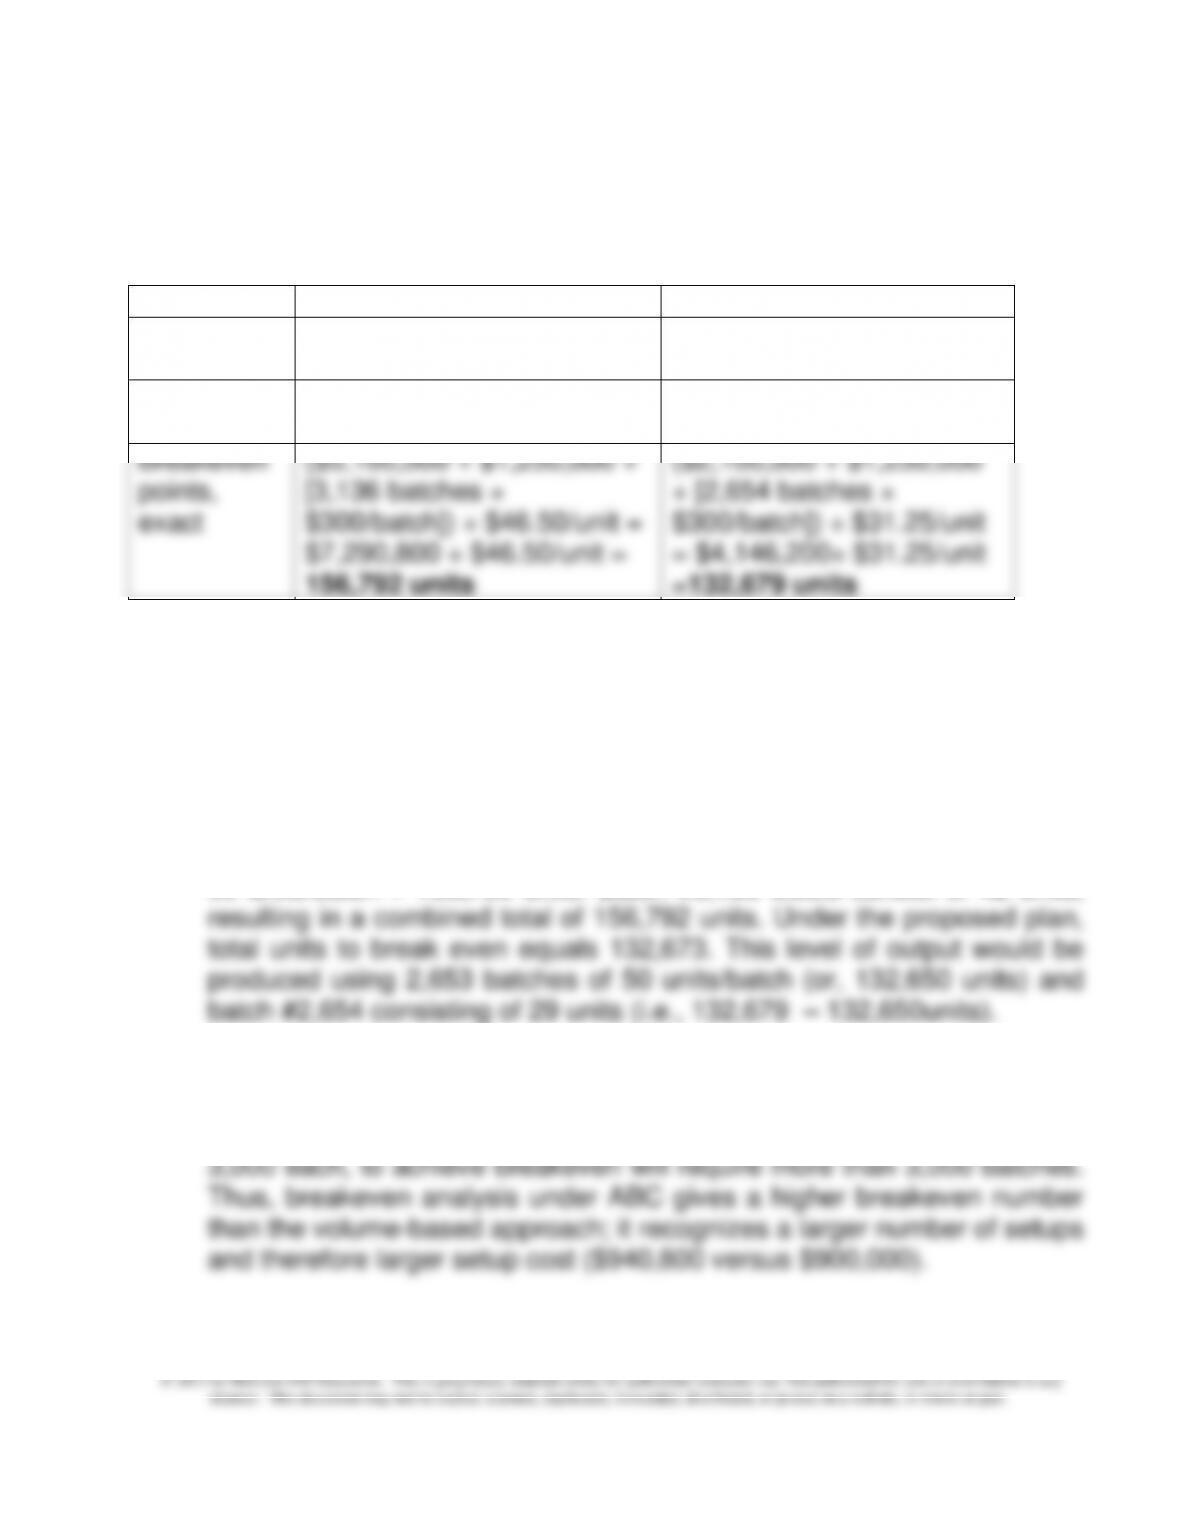
The ABC breakeven points can be determined as follows:
Current Plan
Proposed Plan
Contribution
Margin
$100 − $59.50 = $40.50
$100 − $74.75 = $25.25
Breakeven
points
($5,100,000 + $1,250,000) ÷
$40.50 = 156,790 units
($2,100,000+$1,250,000) ÷
$25.25 = 132,673 units
Breakeven
points,
exact
($5,100,000 + $1,250,000 +
[3,136 batches ×
$300/batch]) ÷ $46.50/unit =
$7,290,800 ÷ $46.50/unit =
156,792 units
($2,100,000 + $1,250,000
+ [2,654 batches ×
$300/batch]) ÷ $31.25/unit
= $4,146,200÷ $31.25/unit
=132,679 units
Notes:
1. In the “breakeven, exact” calculations above, total batch-level costs
are added to the numerator (at the rate of $300 per batch), while being
excluded from the denominator (i.e., $6/unit).
2. For the current plan, all batches but the last batch (#3,136) are of 50
units. Thus, under the current plan we would produce 3,135 batches @
50 units/batch = 156,750 units. Batch #3,136 would consist of 42 units,
3. Note that the breakeven point for the current manufacturing plan is
above the current operating level of 150,000 units. Also, since the
operating level of 150,000 is based on the assumption of 50 batches of
Chapter 9 – Short-Term Profit Planning: Cost-Volume-Profit (CVP) Analysis
9-63
9-47 (Continued-2)
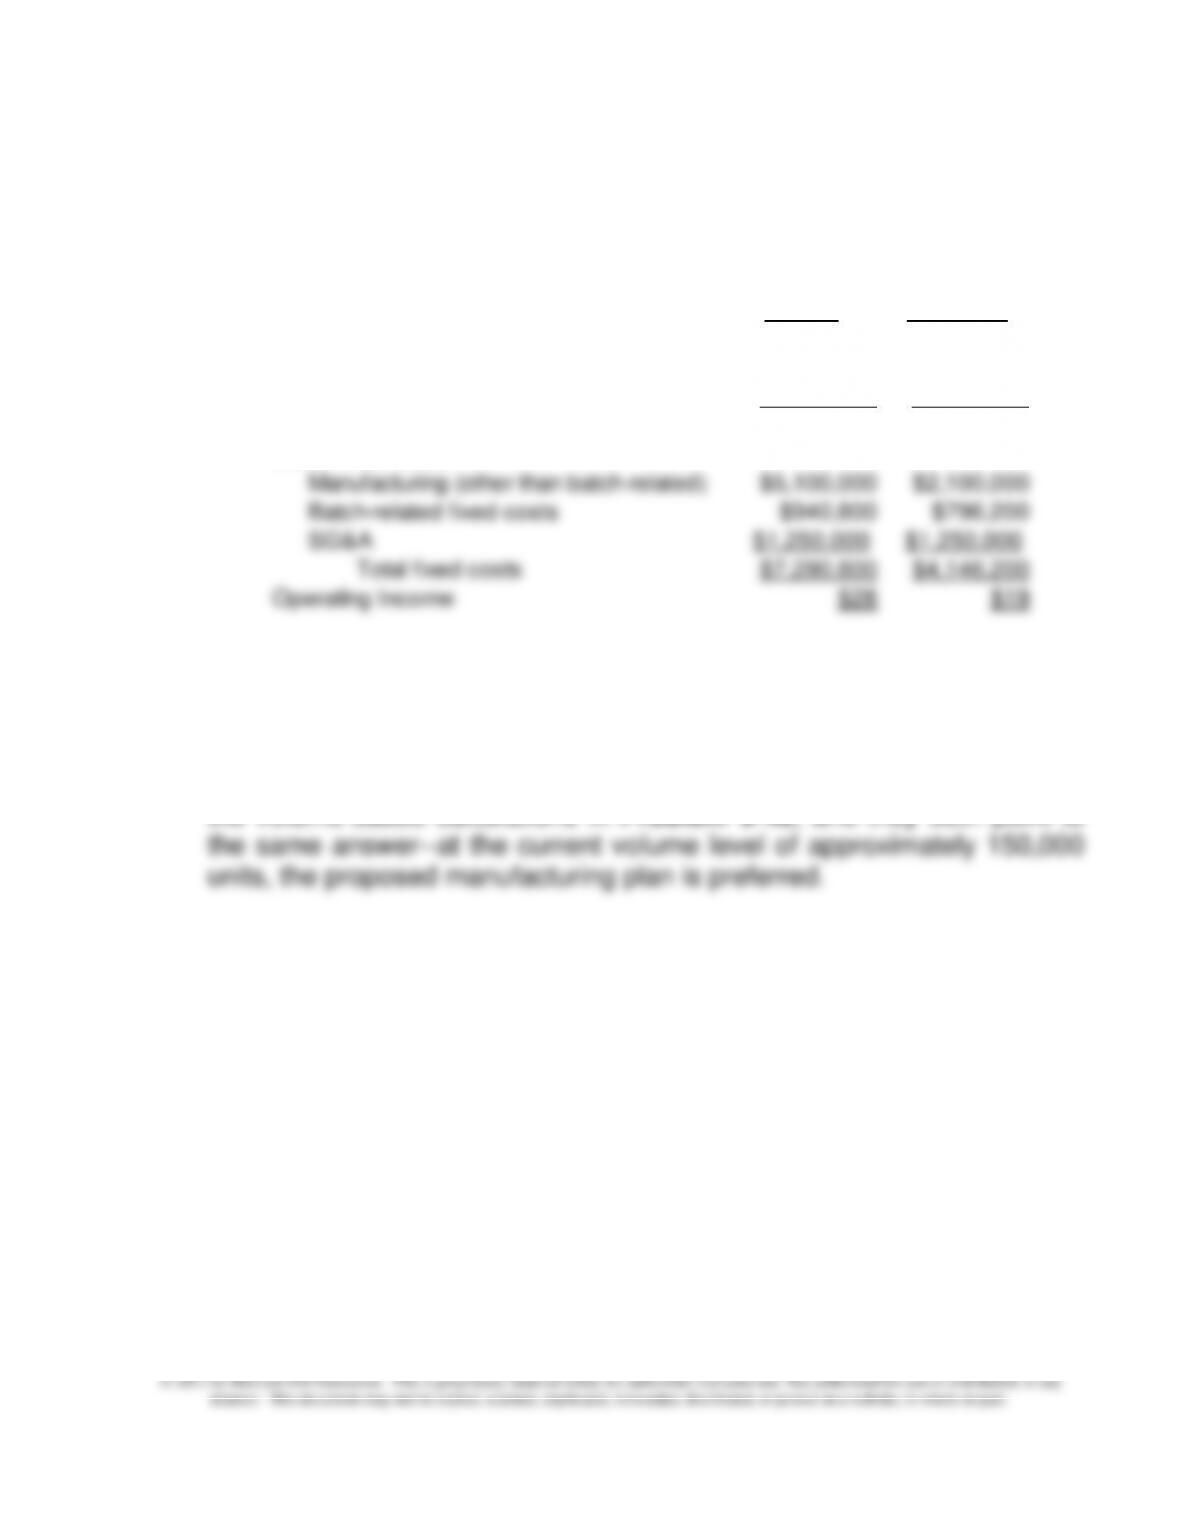
2. Contribution Income Statements, Exact Breakeven Points:
Current Proposed
Sales volume (in units) 156,792 132,679
Sales (at $100/unit) $15,679,200 $13,267,900
Less: Variable Costs(@ $53.50 and $68.75)
$8,388,372 $9,121,681
Contribution margin $7,290,828 $4,146,219
Less: Fixed costs
Manufacturing (other than batch-related) $5,100,000 $2,100,000
Batch-related fixed costs $940,800 $796,200
SG&A $1,250,000 $1,250,000
Total fixed costs $7,290,800 $4,146,200
Operating Income $28 $19
Note: the differences between the above-listed operating figures and $0
(breakeven point) are attributable to rounding up the exact breakeven
point to a whole number.
3. The ABC costing breakeven calculations do not differ much from that for
the volume-based calculations in Problem 9–46, and they both point to
Chapter 9 – Short-Term Profit Planning: Cost-Volume-Profit (CVP) Analysis
9-64
9-48 Multiple-Product CVP Analysis; Sensitivity Analysis (75-90 min)
1. Contribution margin per unit = subscription price − variable costs
Weekly Subscriptions:
Mailing $0.60 per issue × 52 = $ 31.20 per subscription
Commission $ 3.00 per subscription
Administrative $ 1.50 per subscription
Monthly Subscriptions:
Mailing $0.60 per issue× 12 = $ 7.20 per subscription
Commission $ 3.00 per subscription
Administrative $ 1.50 per subscription
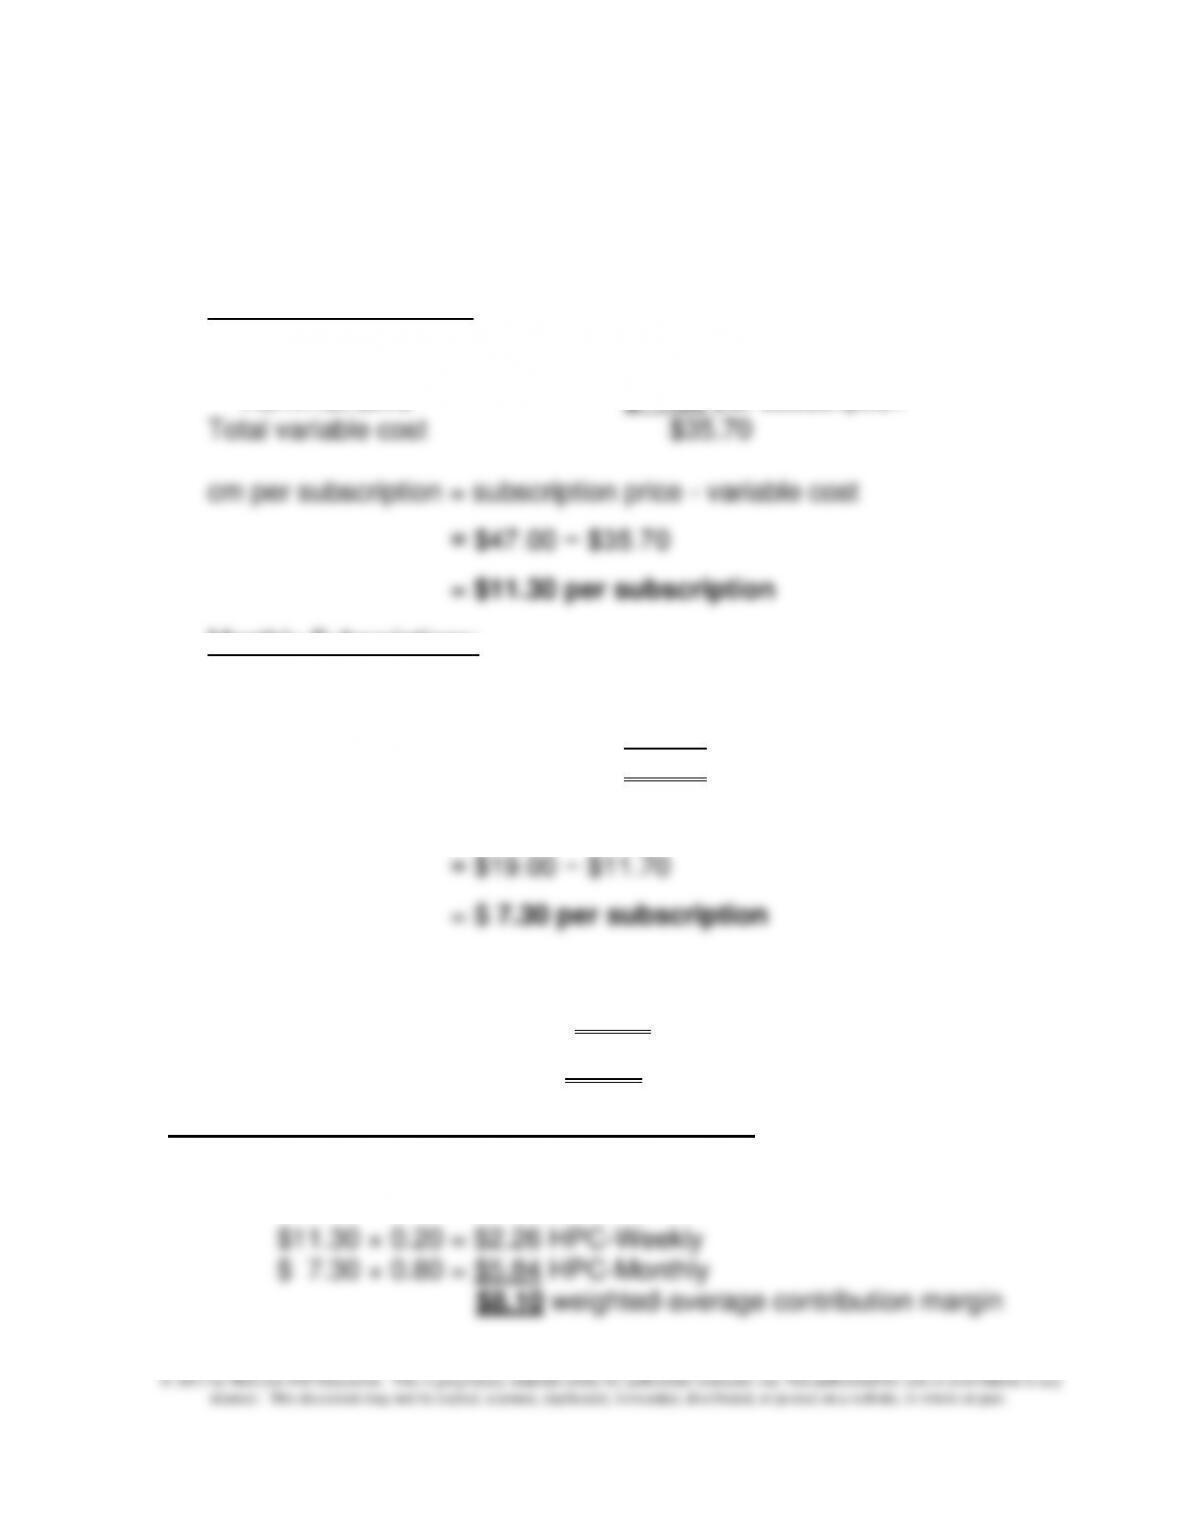
Total Variable Cost $11.70
cm per subscription = subscription price − variable cost
2. Contribution Margin Ratio (CMR) = cm per unit ÷ subscription price
Weekly: $11.30 ÷ $47.00 = 24.0%
Monthly: $ 7.30 ÷ $19.00 = 38.4%
3. Breakeven in total sales units (# of subscriptions)
Weighted-average cm per unit = ∑ (cm/unit)(weight)i, i = 1,2
Chapter 9 – Short-Term Profit Planning: Cost-Volume-Profit (CVP) Analysis
9-48 (Continued-1)
Overall breakeven point = F ÷ weighted-average contribution margin/unit
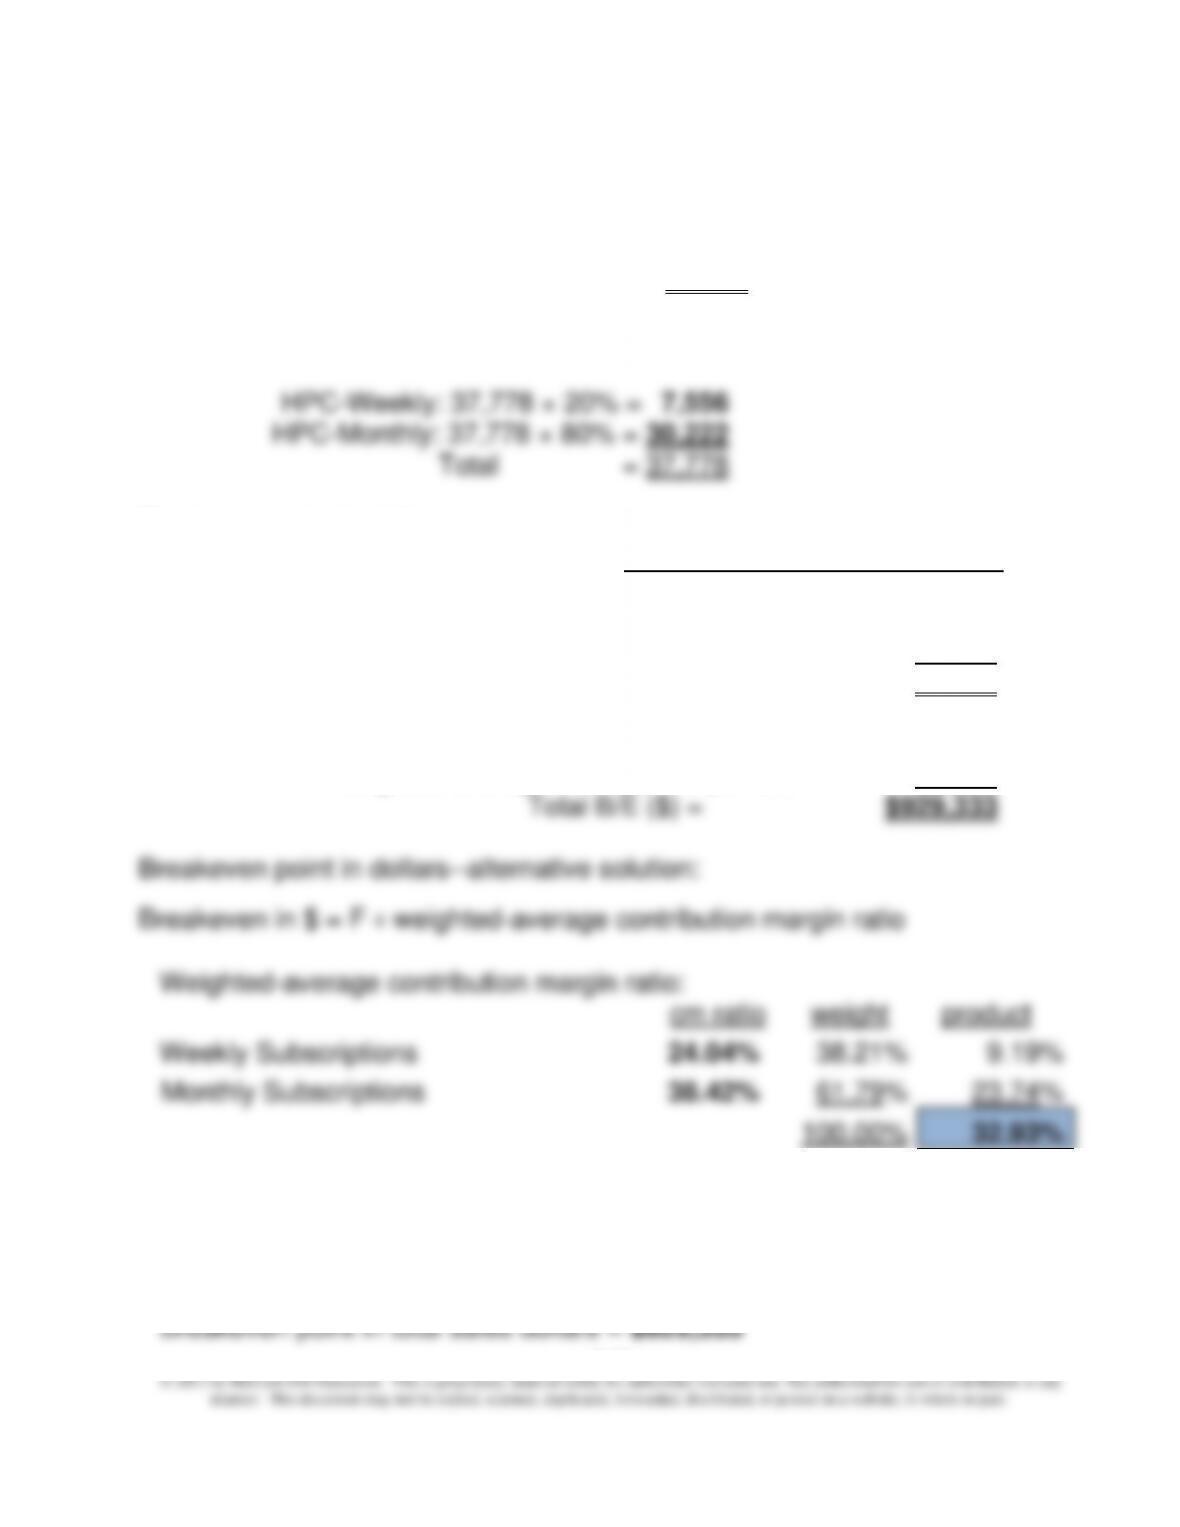
= $306,000 ÷ $8.10/subscription = 37,778 subscriptions
Breakdown into individual products:
Breakeven point in dollars:
Weight Selling Price Product
Wtd.-avg. selling price/unit:
Weekly Subscriptions 20% $47.00 $9.40
Monthly Subscriptions 80% $19.00 $15.20
100% $24.60
Breakeven ($):
Total breakeven units (subscriptions) 37,778
× weighted-average selling price per unit $24.60
Chapter 9 – Short-Term Profit Planning: Cost-Volume-Profit (CVP) Analysis
9-66
9-48 (Continued-2)
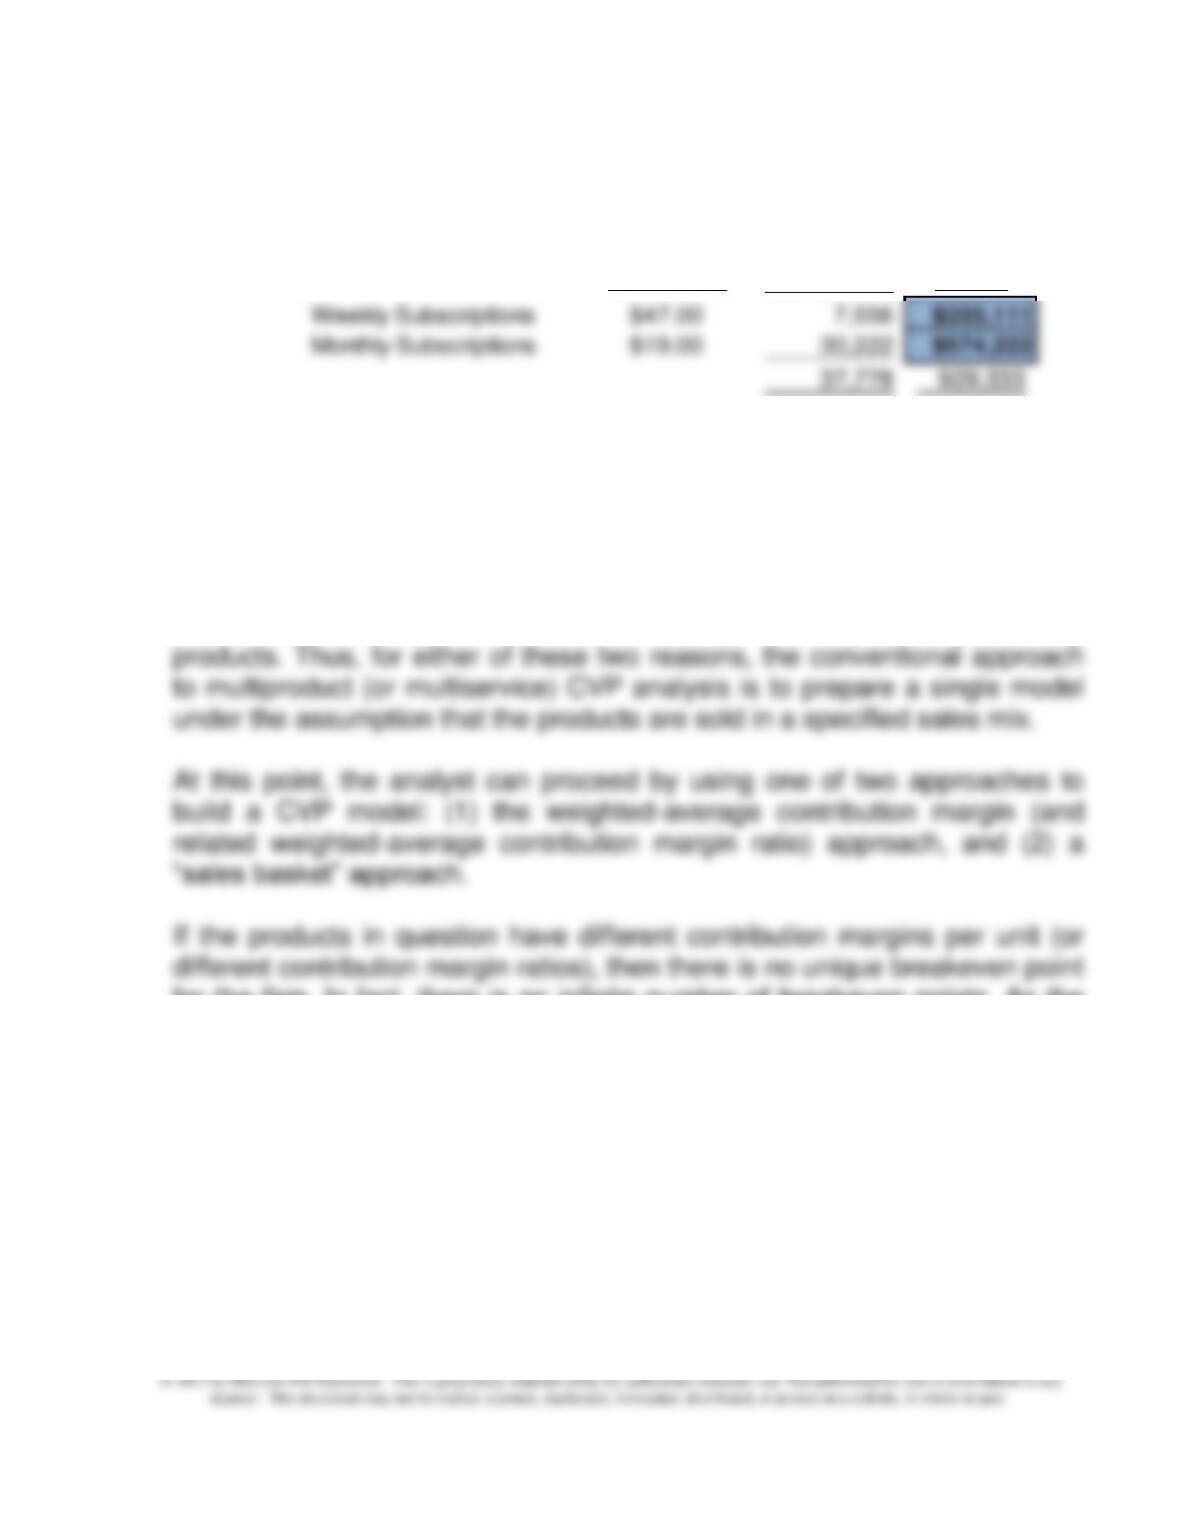
Breakdown of sales, by product:
Sales mix, in terms of dollars: Sales Price Units Dollars
Weekly Subscriptions $47.00 7,556 $355,111
Monthly Subscriptions $19.00 30,222 $574,222
37,778 929,333
4. “For the multiproduct (or multiservice) firm, there is no breakeven point
independent of the sales mix assumption.”
One option for multiproduct CVP analysis is to trace and/or allocate total
fixed costs across the products and then prepare a separate CVP model for
each product. Regardless of the ability to allocate such costs across
products, this approach fails to capture demand interdependencies among
for the firm. In fact, there is an infinite number of breakeven points. As the
assumed sales mix changes, so too will the breakeven point for the firm.
The breakeven point moves in response to shifts in the sales mix: as the
mix shifts to more profitable products, the breakeven point decreases, and
vice versa. Thus, “for the multiproduct firm, there is no breakeven point
independent of the sales mix assumption.” The only exception to this rule is
when each product has the same contribution margin per unit, which is
considered a trivial case.
Chapter 9 – Short-Term Profit Planning: Cost-Volume-Profit (CVP) Analysis
9-67
9-48 (Continued-3)
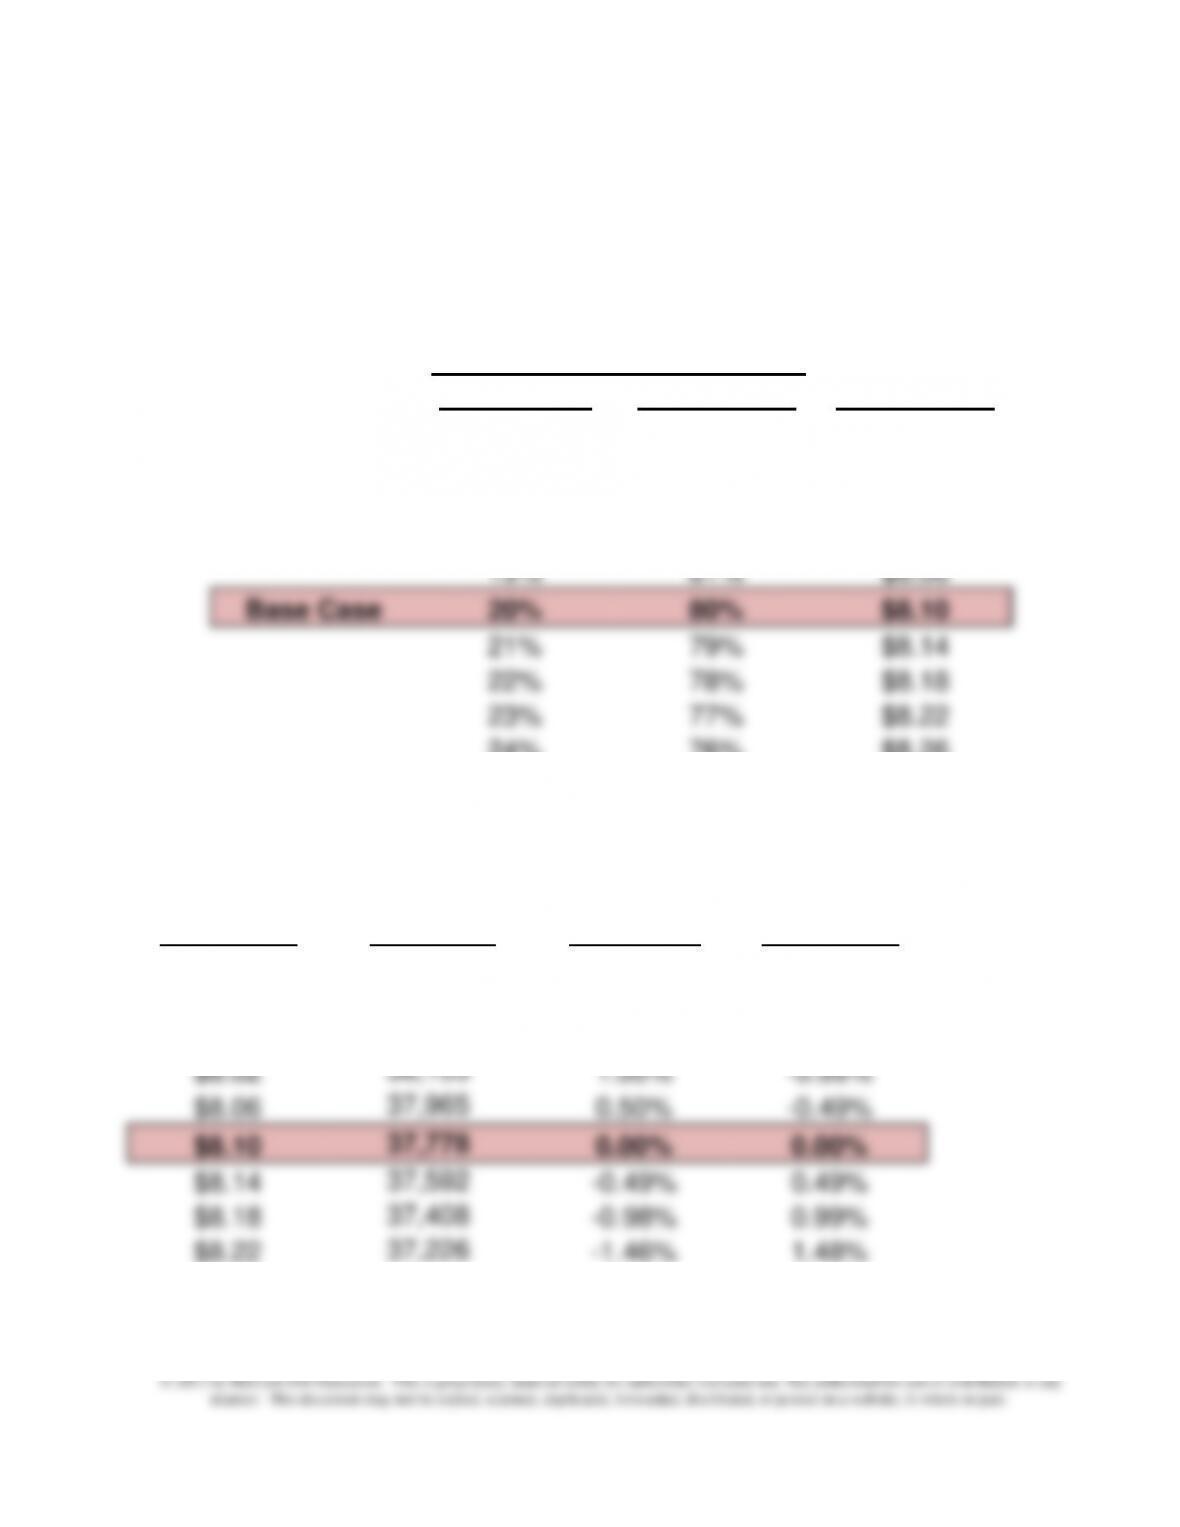
5. Sensitivity analysis table: what happens to the breakeven point as the sales
mix changes (in increments of 1%), from 15% to 25% for HPC Weekly? Of
what value to management is this type of analysis?
Weighted-
Average
Contribution
Margin/Unit
B/E (units)
B/E %
Change from
Base Case
% Change in
Weighted-
Avg. CM/Unit
(from base)
$7.90
38,734
2.53%
-2.47%
$7.94
38,539
2.02%
-1.98%
$7.98
38,346
1.50%
-1.48%
$8.02
38,155
1.00%
-0.99%
$8.06
37,965
0.50%
-0.49%
$8.10
37,778
0.00%
0.00%
$8.14
37,592
-0.49%
0.49%
$8.18
37,408
-0.98%
0.99%
$8.22
37,226
-1.46%
1.48%
$8.26
37,046
-1.94%
1.98%
$8.30
36,867
-2.41%
2.47%
Sales Mix (based on units sold)
Weighted-
HPC Weekly
HPC Monthly
Avg. CM/Unit
15%
85%
$7.90
16%
84%
$7.94
17%
83%
$7.98
18%
82%
$8.02
19%
81%
$8.06
Base Case
20%
80%
$8.10
21%
79%
$8.14
22%
78%
$8.18
23%
77%
$8.22
24%
76%
$8.26
25%
75%
$8.30
Chapter 9 – Short-Term Profit Planning: Cost-Volume-Profit (CVP) Analysis
9-68
9-48 (Continued-4)
The above data table provides the results of a sensitivity analysis.
Specifically, we are looking at the sensitivity of the breakeven point to the
assumption regarding sales mix for the two products. Based on the above
results management will form a judgment as to the sensitivity of the B/E
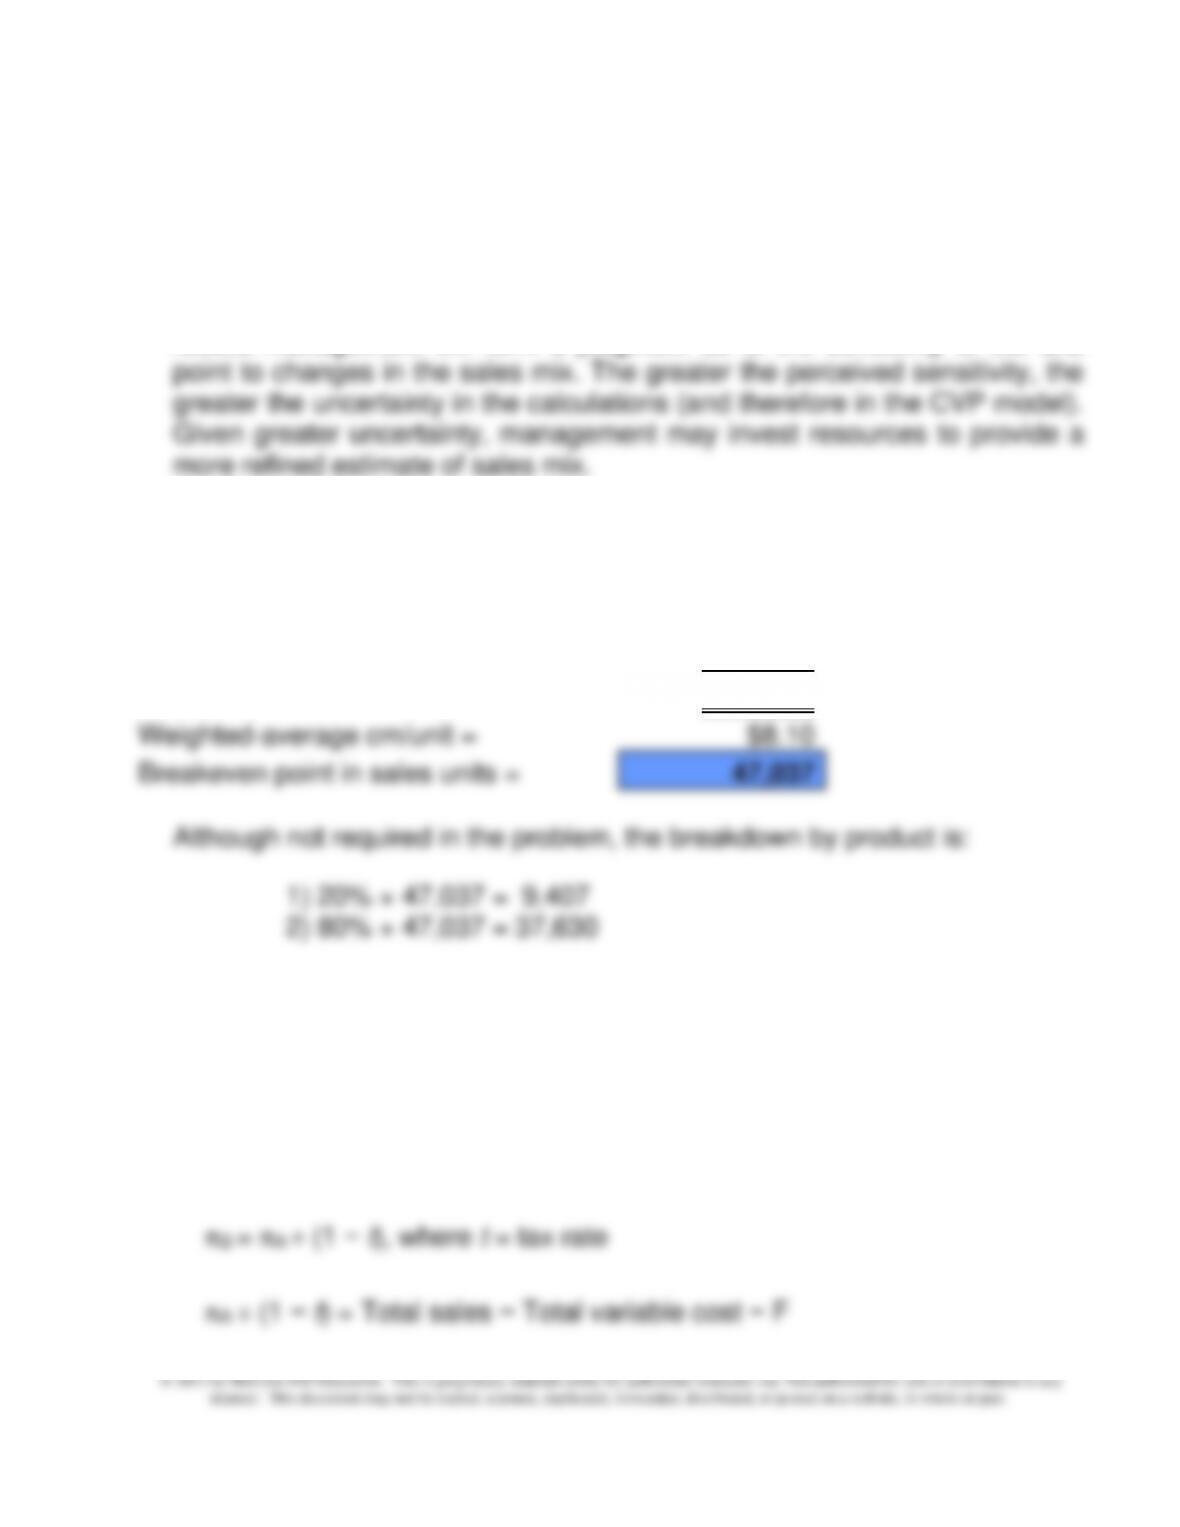
6. Given the assumed sales mix (20%:80%), the required sales volume (in total
units) to generate a before-tax profit, πB, of $ 75,000 is 47,037 units:
Targeted before-tax profit target, πB =
$75,000
Fixed Costs (F) =
$306,000
F + πB =
$381,000
Weighted-average cm/unit =
$8.10
Breakeven point in sales units =
47,037
Although not required in the problem, the breakdown by product is:
1) 20% × 47,037 = 9,407
2) 80% × 47,037 = 37,630
7. Given the assumed sales mix, what is the required sales volume (in total
units) to generate an after-tax profit, πA, equal to 10% of sales dollars?
Let Q = the required sales volume (in units) to achieve the profit objective
πB= Total sales − Total variable cost − Total fixed cost (F)
πB = πA ÷ (1 − t), where t = tax rate
πA ÷ (1 − t) = Total sales − Total variable cost − F
Chapter 9 – Short-Term Profit Planning: Cost-Volume-Profit (CVP) Analysis
9-69
9-48 (Continued-5)
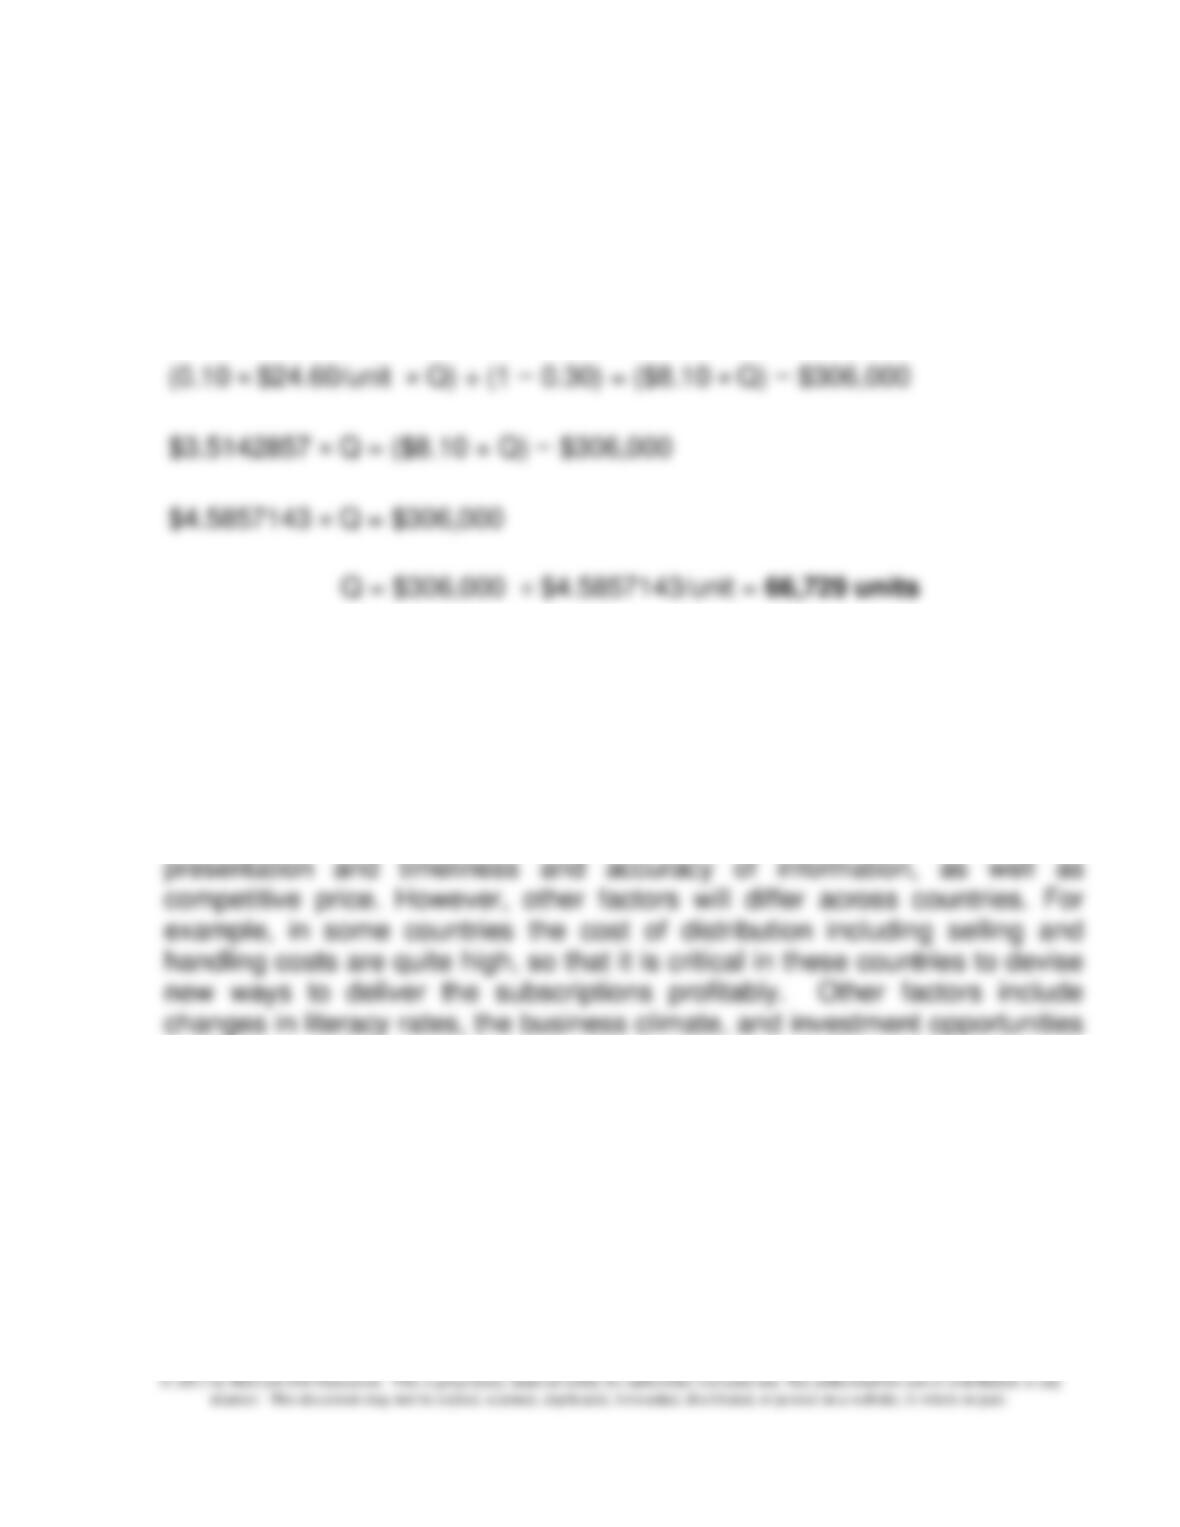
(0.10 × (sp/unit × Q)) ÷ (1 − t) = Total contribution margin − F
(0.10 × (sp/unit × Q)) ÷ (1 − t) = (cm per unit × Q) − F
(0.10 × $24.60/unit × Q) ÷ (1 − 0.30) = ($8.10 × Q) − $306,000
$3.5142857 × Q = ($8.10 × Q) − $306,000
$4.5857143 × Q = $306,000
Q = $306,000 ÷ $4.5857143/unit = 66,729 units
8. The point of this question is to get the students started thinking about the
competitive context in which the firm operates. There are many different
relevant points that could be made. If the discussion is slow to start, ask
them to think about what a firm like HPC must do to be competitive.
There are a number of critical success factors that are likely to be important
for both domestic and foreign subscriptions. These would include quality of
in different countries.
Chapter 9 – Short-Term Profit Planning: Cost-Volume-Profit (CVP) Analysis
9-70
9-49 CVP Analysis; Strategy; Sensitivity Analysis (75-90 min)
1.
Selling price per unit
$600
$600
Less: variable cost per unit:
Materials and purchased parts
180
195
Direct labor
55
63
Variable overhead
70
80
Variable GSA per unit
25
25
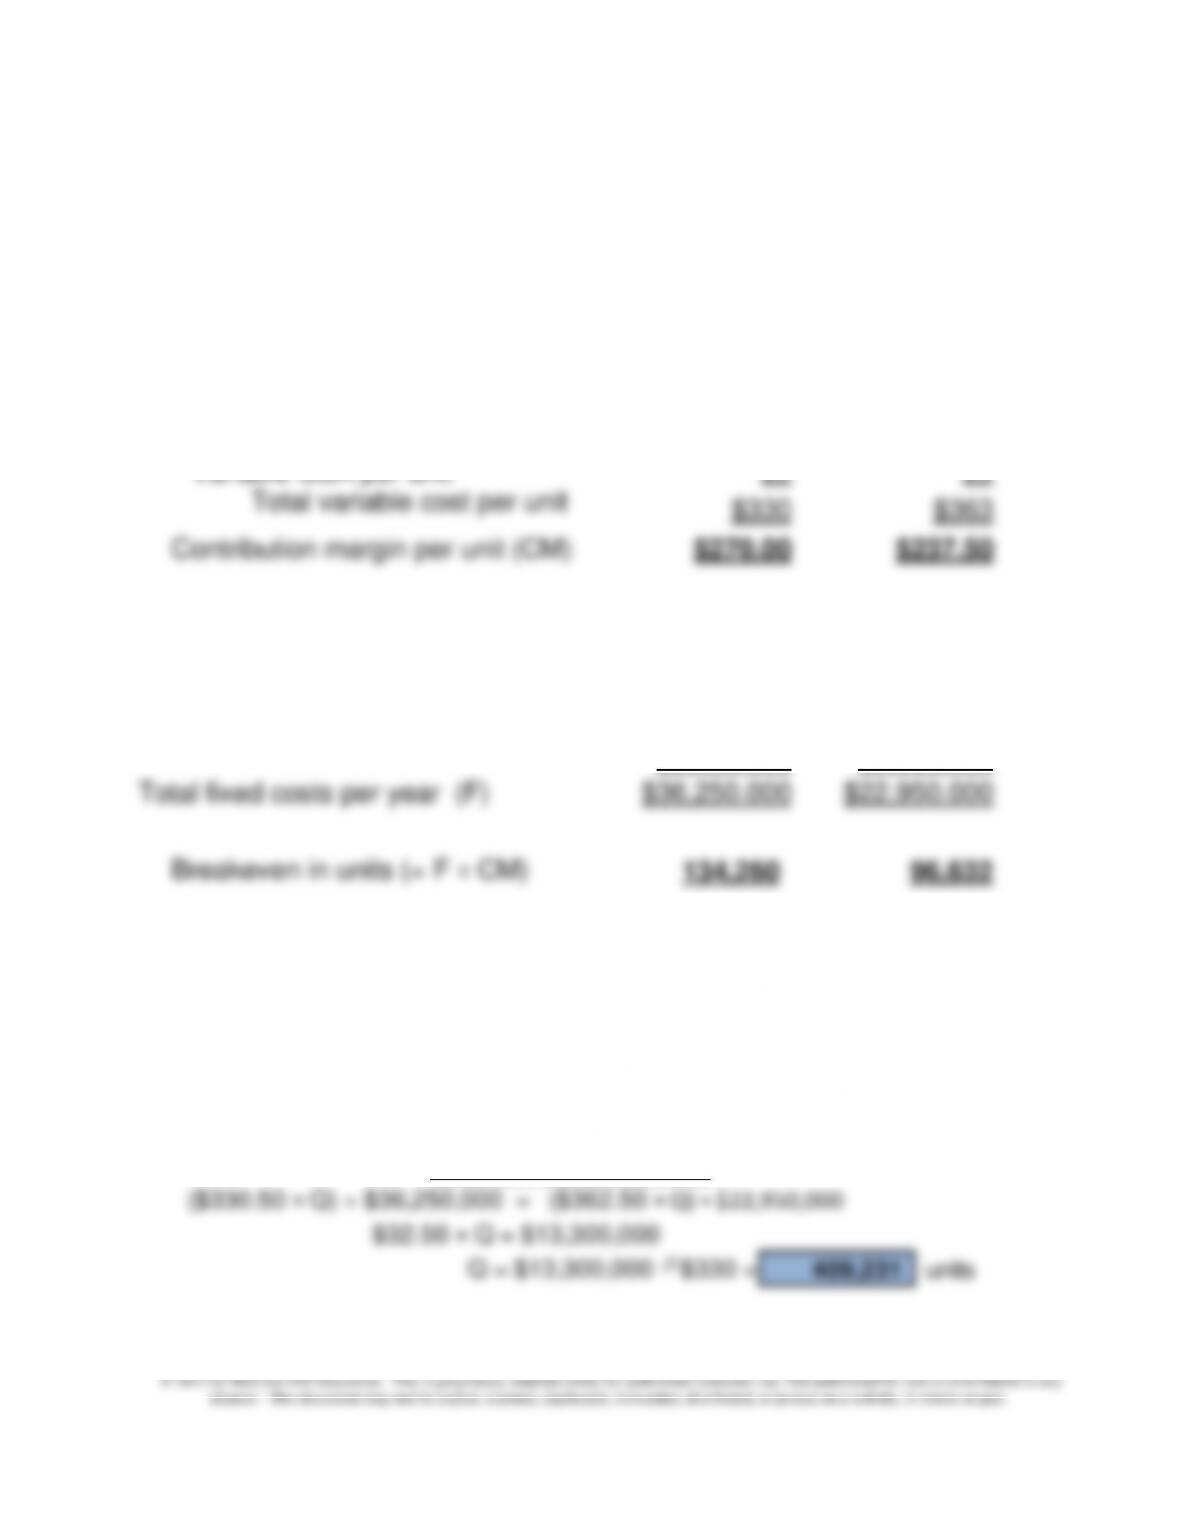
Total variable cost per unit
$330
$363
Contribution margin per unit (CM)
$270.00
$237.50
Total fixed cost per year:
Fixed manufacturing overhead
per unit
$90
$55
Fixed manufacturing overhead
$34,200,000
$20,900,000
Plus: Fixed GSA costs
$2,050,000
$2,050,000
Total fixed costs per year (F)
$36,250,000
$22,950,000
Breakeven in units (= F ÷ CM)
134,260
96,632
2. Indifference Point Calculation: the indifference point, in terms of cost, is
defined as the volume level (Q) in which total cost is the same for both
production options, as follows:
Cost Function for Current Plan:
($330 × Q) + $36,250,000
Cost Function for Proposed Plan:
($362.50 × Q) + $22,950,000
Cost Indifference Point, Q
($330.50 × Q) + $36,250,000 = ($362.50 × Q) + $22,950,000
$32.50 × Q = $13,300,000
Q = $13,300,000
$330 =
409,231 units
Chapter 9 – Short-Term Profit Planning: Cost-Volume-Profit (CVP) Analysis
9-71
The above calculation shows that at the current level of 380,000 units, the
firm would prefer the low-fixed-cost strategy (i.e., the proposed plan)
9-49 (continued-1)
3. a) SolarFlex’s strategy is best described as differentiation, since the firm has
succeeded by innovation in product design. Further, the firm operates in
an industry in which innovation and product design are critical to success.
An important element of the firm’s strategy is also the fact that the
technology, as for many firms in the industry, is not proven. That is, there
with the possibility that the technology might fail.
b) The calculations in part 2 above support a decision to go to the new plan;
at the current level of 380,000 units, costs are lower for the new plan, and
will continue to be lower for the new plan as long as volume stays below
409,231 units.
Strategically, the new plan is preferred since it is an appropriate
failure of the innovation and then drop-off in sales. The reduction in fixed
costs also helps the firm to manage cash flows. Thus, the new plan is
more consistent with the firm’s strategy of developing an innovative
product and also dealing with the risk of potential loss because of a
possible failure of the technology in the market place. Also, one could
look at the proposal as consistent with the firm’s core strength, which
appears to be product innovation. There is no evidence that the firm is
Chapter 9 – Short-Term Profit Planning: Cost-Volume-Profit (CVP) Analysis
9-72
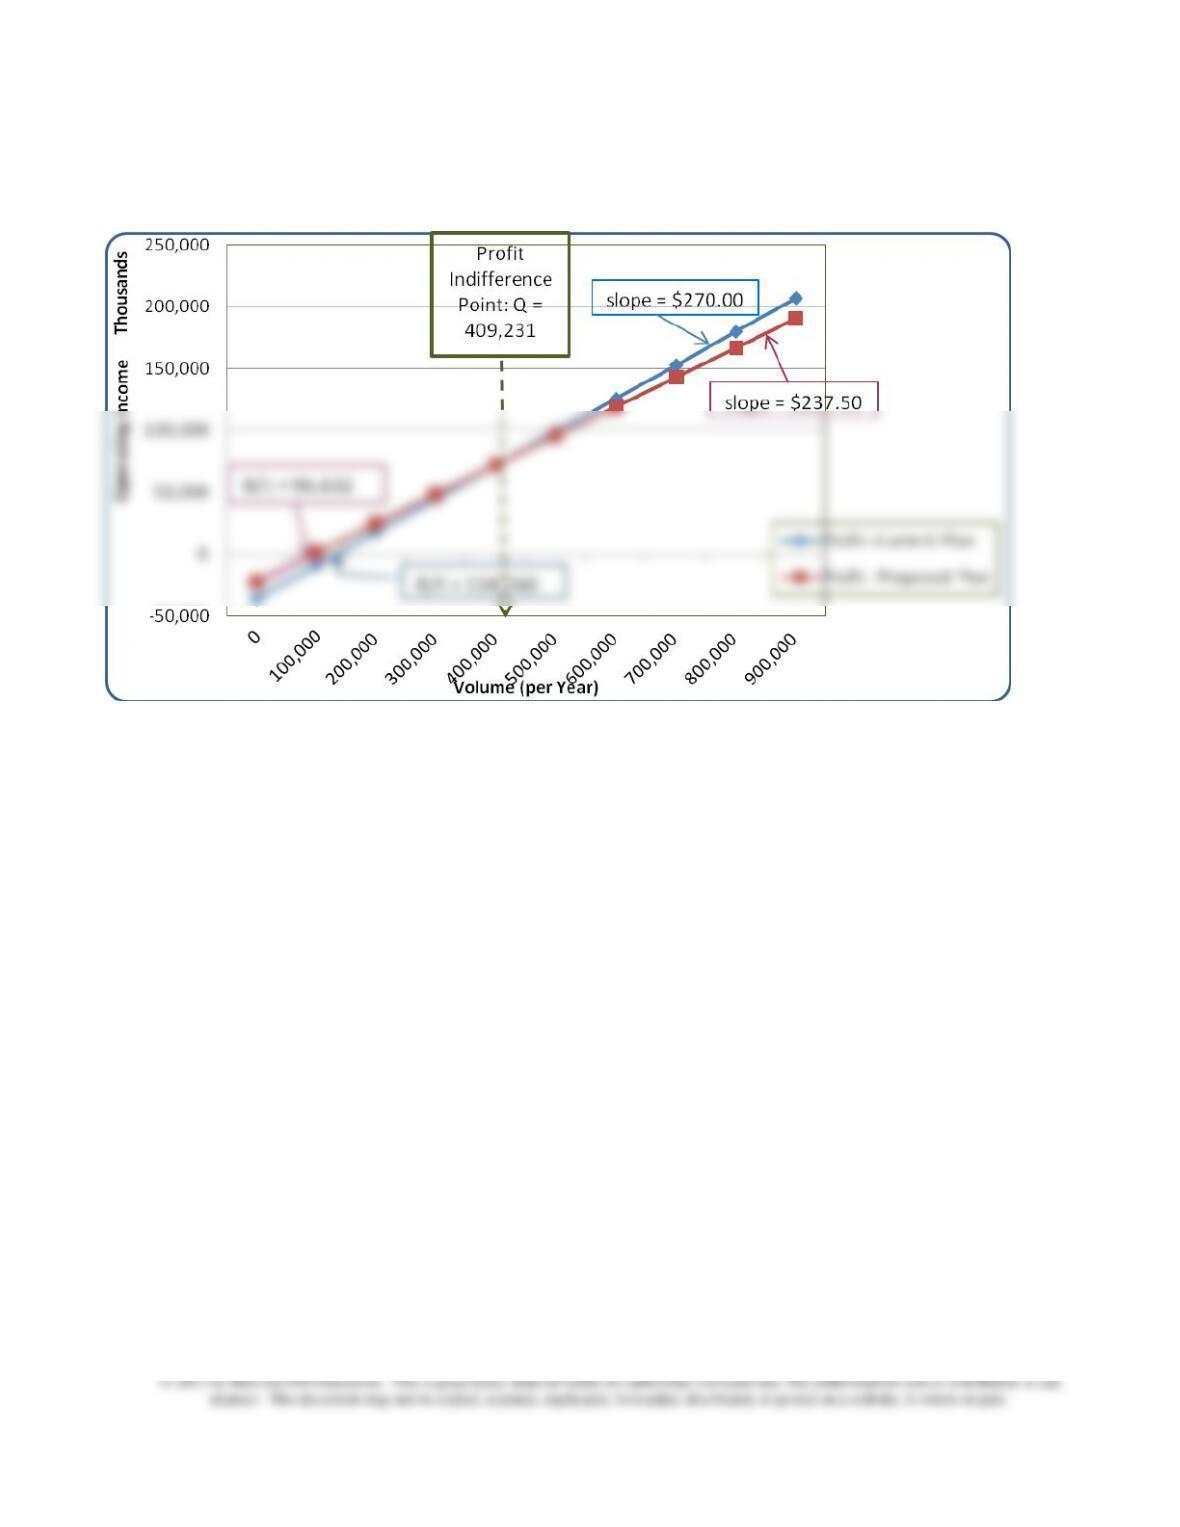
9-49 (continued-3)
Current
Proposed
Difference
CM
$270.00
$237.50
$32.50
Fixed Cost
$36,250,000
$22,950,000
$13,300,000
Indifference Point = ($13,300,000 ÷ $32.50) = 409,231 units
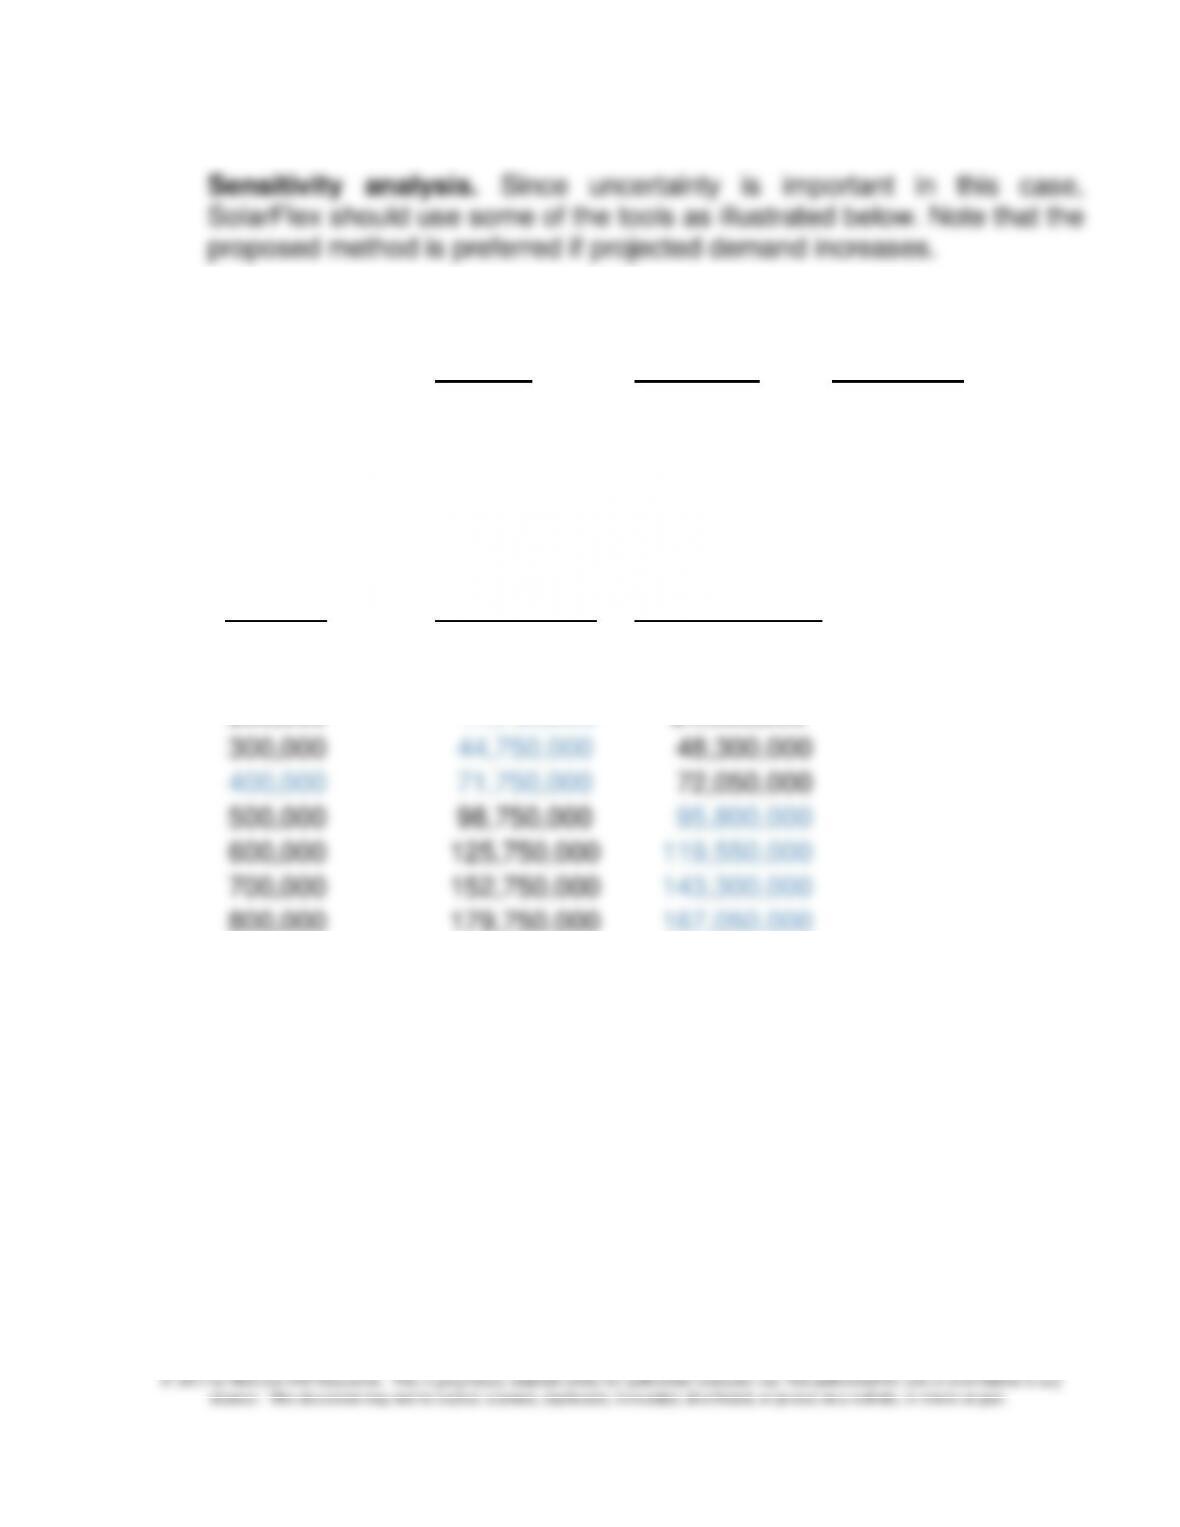
Assumed Levels of
Demand
Profit-Current
Profit-Proposed
0 -36,250,000 -22,950,000
100,000 -9,250,000 800,000
200,000 17,750,000 24,550,000
300,000
44,750,000
48,300,000
400,000
71,750,000
72,050,000
500,000
98,750,000
95,800,000
600,000
125,750,000
119,550,000
700,000
152,750,000
143,300,000
800,000
179,750,000
167,050,000
900,000
206,750,000
190,800,000
Chapter 9 – Short-Term Profit Planning: Cost-Volume-Profit (CVP) Analysis
9-73
4. Excel Charts (P-V function for each of the two decision alternatives)