Chapter 9 – Short-Term Profit Planning: Cost-Volume-Profit (CVP) Analysis
9-31
9-38 Profit Planning: Multiple Products (50-60 min)
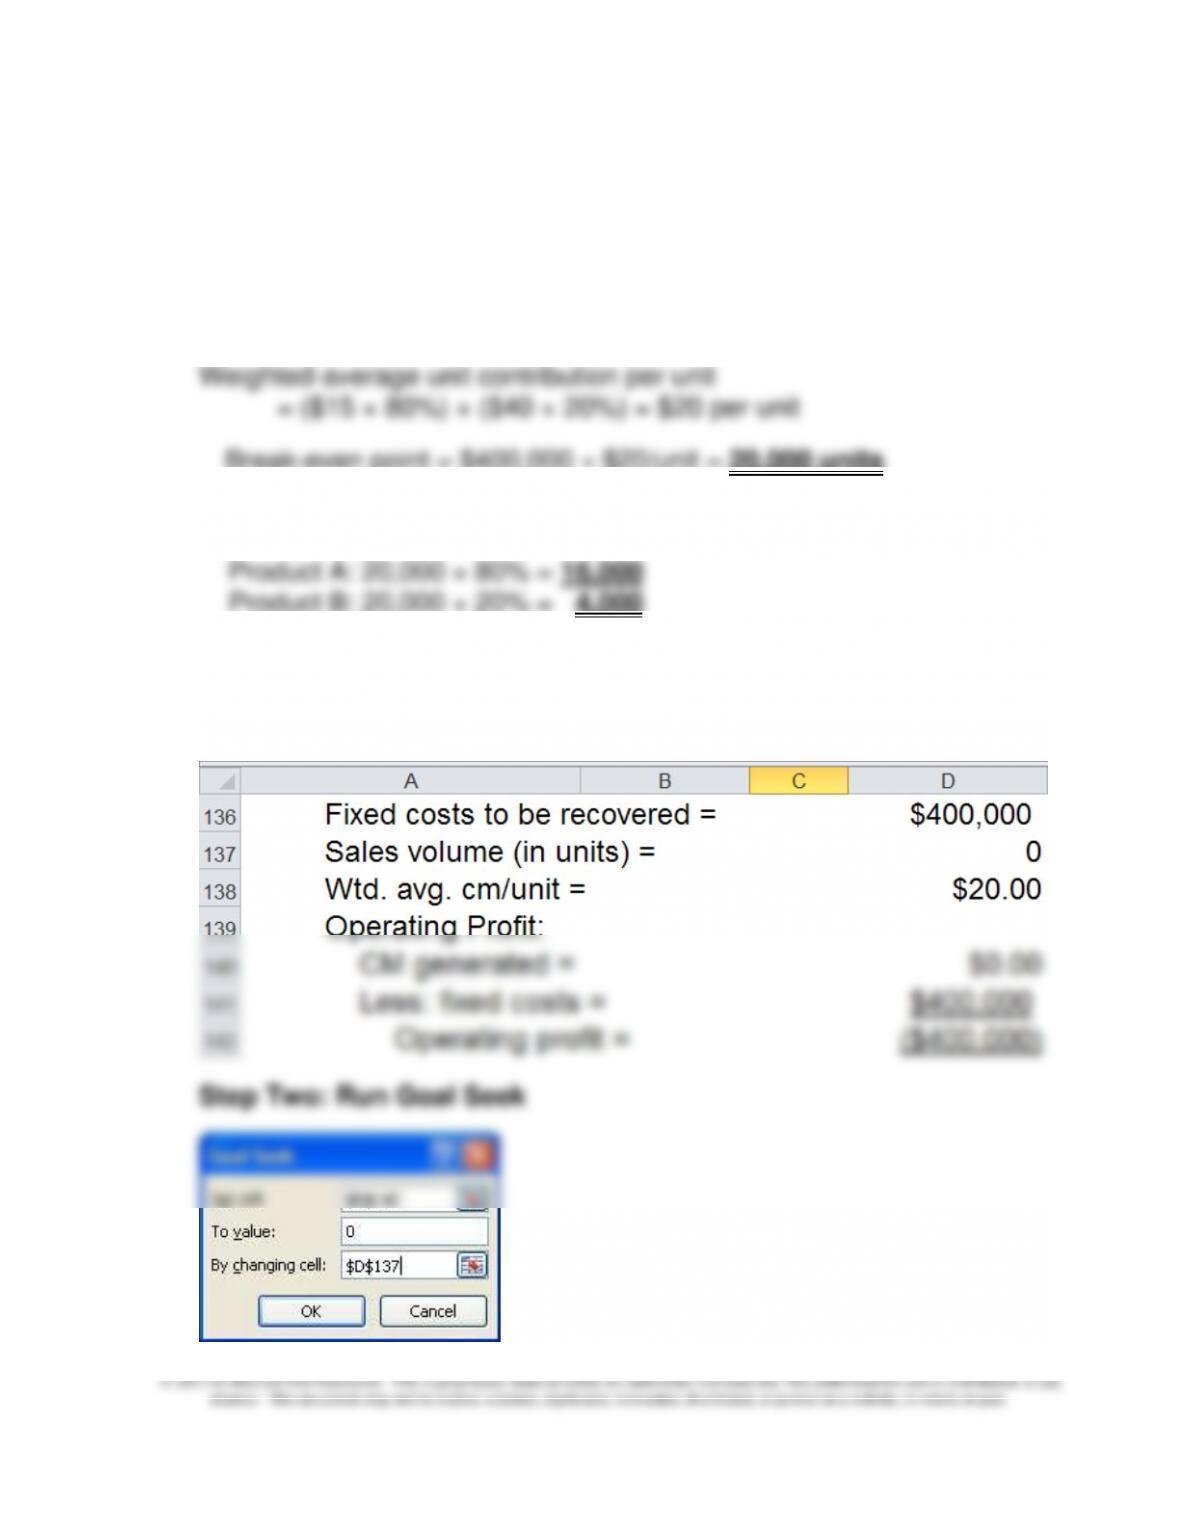
1. Break-even in units: weighted-average contribution margin approach
a. Overall breakeven point = F ÷ weighted-average contribution
margin/unit
Break-even point = $400,000 ÷ $20/unit = 20,000 units
b. Breakdown of breakeven units:
Product B: 20,000 × 20% = 4,000
2. Use Goal Seek (in Excel) to calculate the breakeven point, in terms of
total units:
Step One: Set Up the Equation for Operating Income
Chapter 9 – Short-Term Profit Planning: Cost-Volume-Profit (CVP) Analysis
9-32
Problem 9-38 (Continued-1)
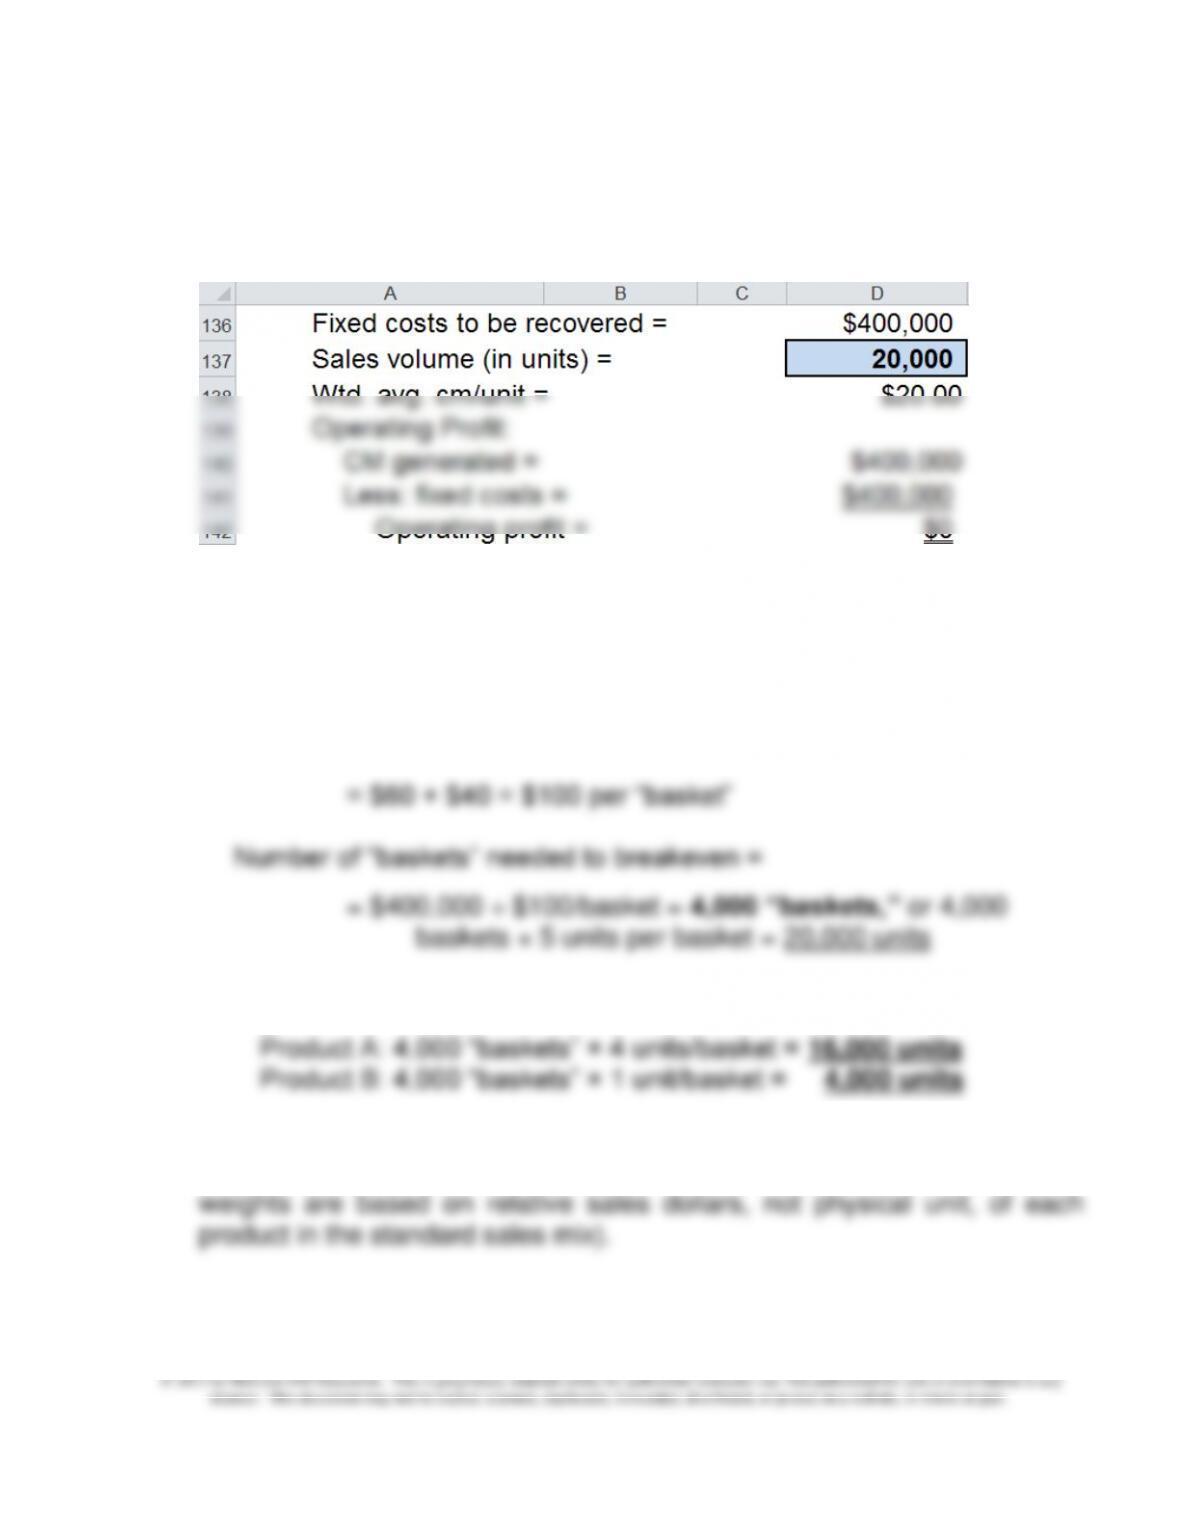
Step Three: Results (after running Goal Seek)
3. Breakeven point in units: “Sales basket” approach (assume that each
basket consists of 4 units of Product A and 1 unit of Product B).
a. Overall breakeven point (in baskets) = F ÷ contribution margin/basket
Contribution margin per sales basket = (4 × $15) + (1 × $40)
b. Breakdown of breakeven units:
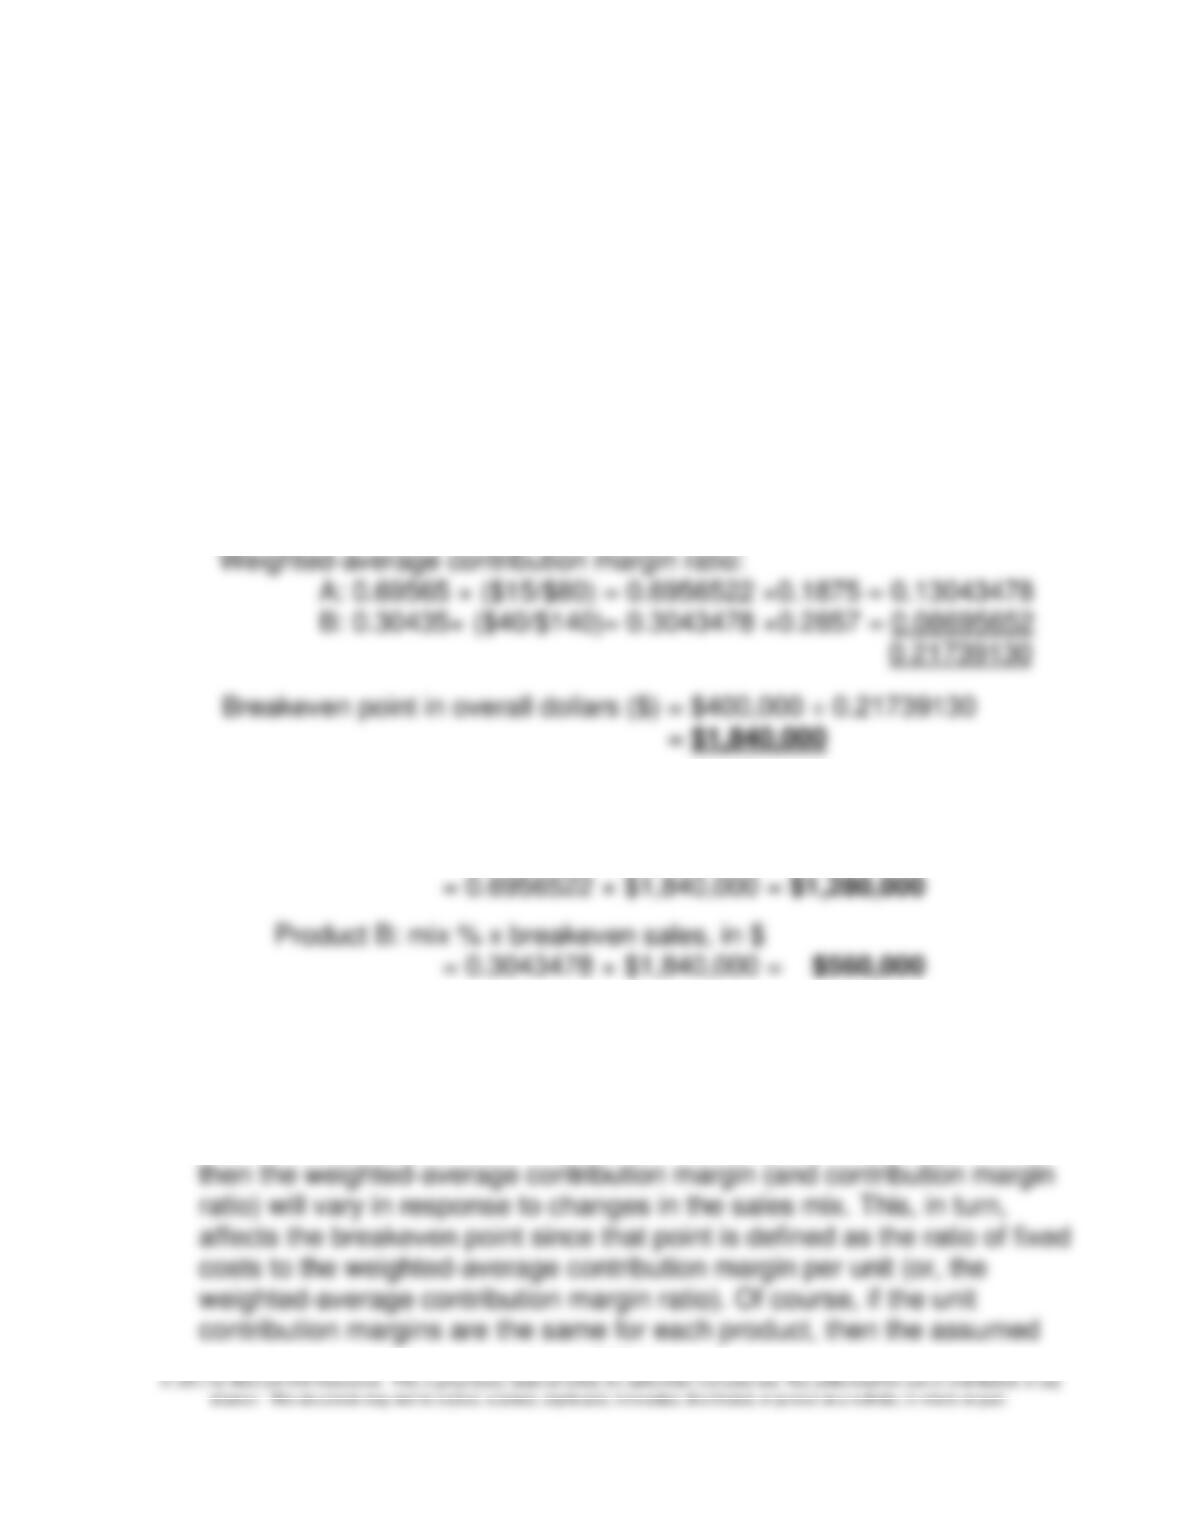
4. Distribution of breakeven point in terms of sales dollars (based on
weighted-average contribution margin ratio, where the individual product
Chapter 9 – Short-Term Profit Planning: Cost-Volume-Profit (CVP) Analysis
9-33
a. Breakeven ($) = F ÷ weighted-average cm ratio
Relative sales dollars (not units), based on standard sales mix:
Problem 9-38 (Continued-2)
Product A: 18,000 units × $80/unit = $1,440,000
Product B: 4,500 units × $140/unit = $630,000
Weights:
Product A: $1,440,000 ÷ $2,070,000 = 0.6956522
Product B: $630,000 ÷ $2,070,000 = 0.3043478
b. breakdown of total breakeven sales dollars, by product:
Product A: mix % x breakeven sales, in $
5. For the multiproduct firm, there is no breakeven point independent of the
sales mix assumption. For the multiproduct firm, we typically assume that
the outputs are sold in some standard mix, based either on relative
physical units or relative sales dollars. If the individual products differ in
terms of their contribution margin per unit (or contribution margin ratio),
Chapter 9 – Short-Term Profit Planning: Cost-Volume-Profit (CVP) Analysis
9-34
mix has no impact on the breakeven calculation. Note, however, that this
is a trivial example.
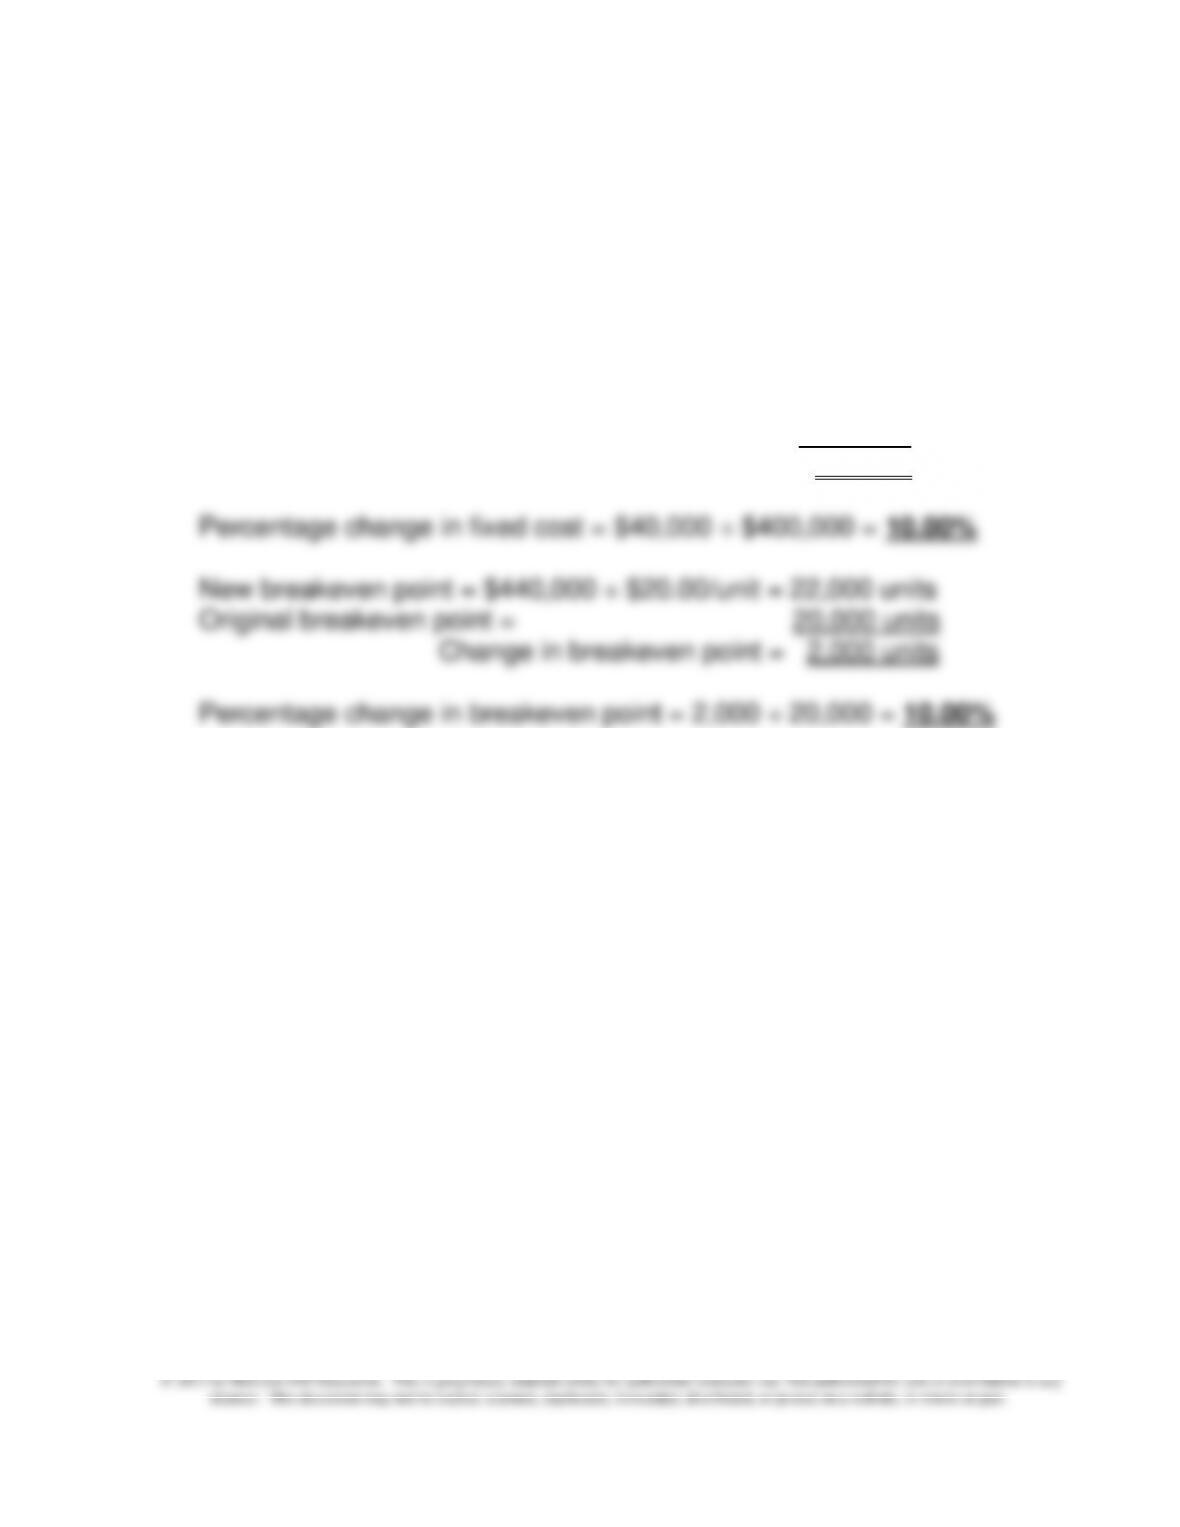
6. Change in the breakeven point (in total units) in response to a 10%
change in fixed costs:
Problem 9-38 (Continued-3)
New level of fixed costs = $400,000 + $40,000 = $440,000
Original level of fixed costs = $400,000
$ change in fixed costs = $40,000
As seen from the above, the percentage change in fixed cost (here 10%)
led to an identical percentage change in the breakeven point. Because of
the linear cost functions assumed in a conventional CVP model, this
finding can be generalized: with everything else held constant, a given
percentage change (+ or -) in the amount of fixed costs leads to an
equivalent percentage change in the breakeven point.
Chapter 9 – Short-Term Profit Planning: Cost-Volume-Profit (CVP) Analysis
9-35
9-39 CVP Analysis/Profit Planning (45-60 min)
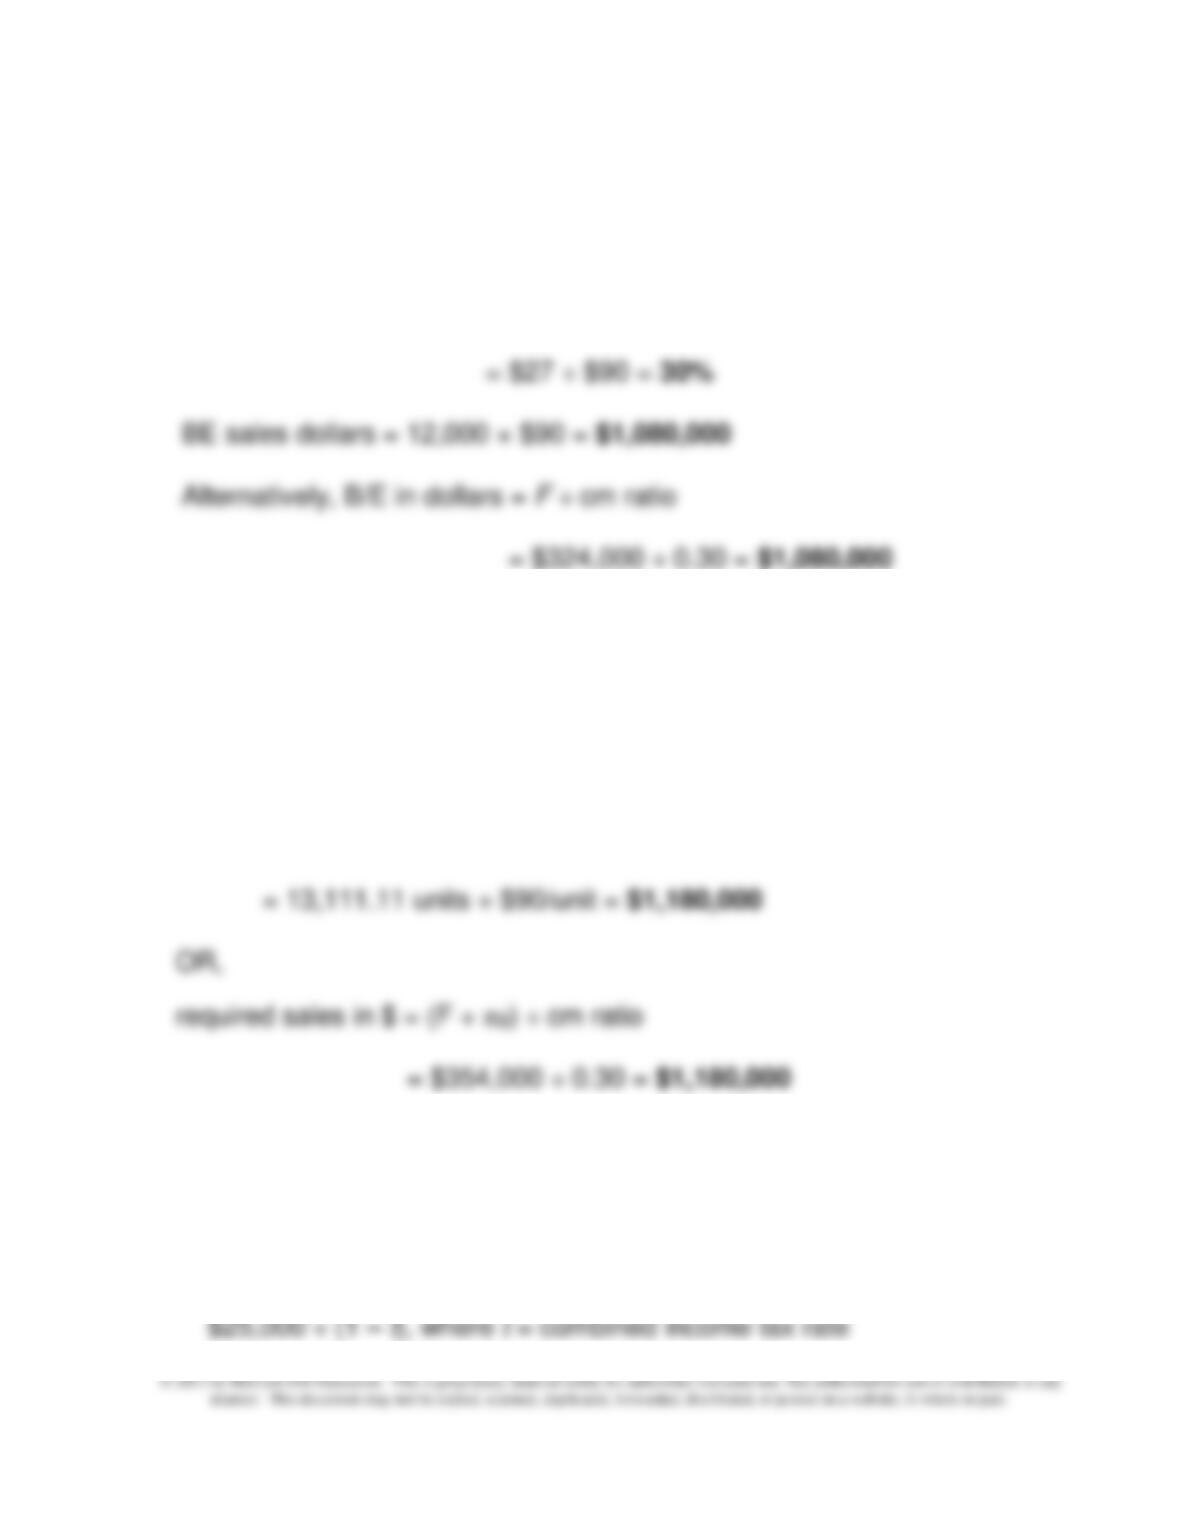
1. BE in units = F ÷ (p − v) = $324,000 ÷ ($90 − $63) = 12,000 units
Contribution margin ratio = (p – v) ÷ p
2. Required sales, in units and in dollars, to achieve pre-tax profit goal of
$30,000:
# units = (F + πB) ÷ cm per unit = ($324,000 + $30,000) ÷ $27/unit
= $354,000 ÷ $27/unit = 13,111.11 units
required sales, in $ = required sales in units × selling price/unit
3. Required sales to achieve after-tax profit goal:
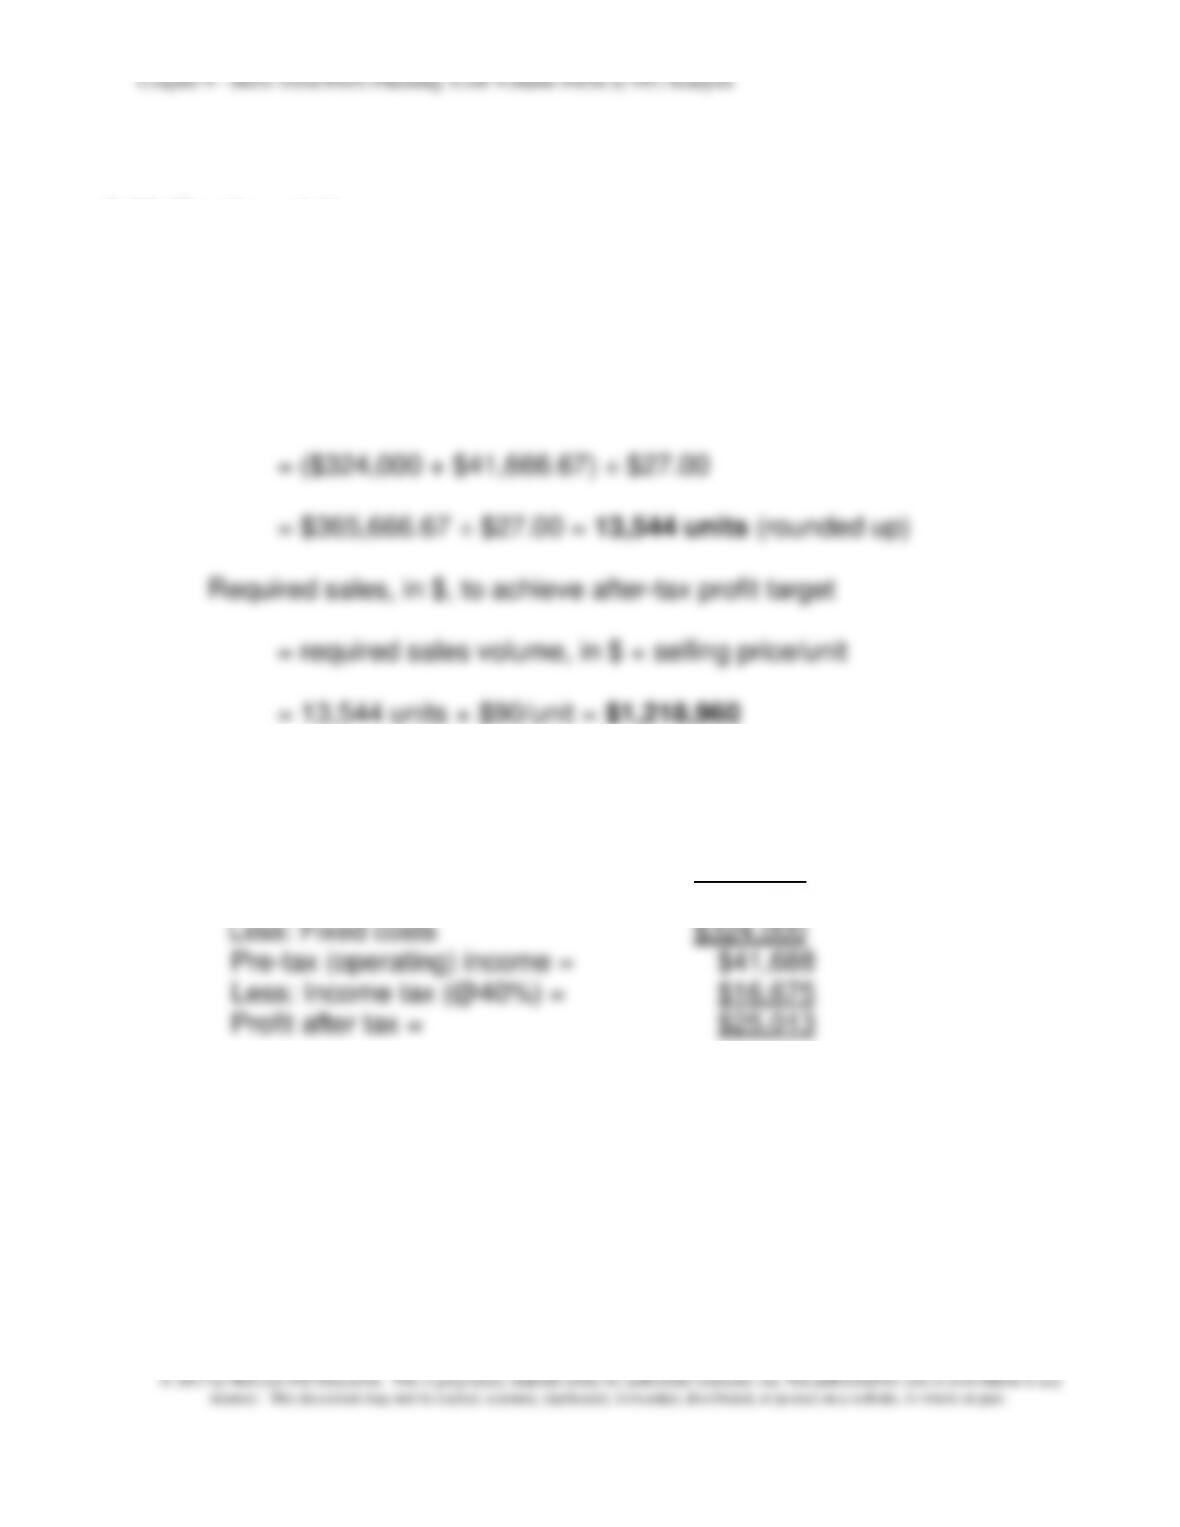
after-tax profit goal = $25,000
conversion of after-tax profit goal into pre-tax dollar equivalent:
$25,000 ÷ (1 – t), where t = combined income tax rate
9-36
© 2013 by McGraw-Hill Education. This is proprietary material solely for authorized instructor use. Not authorized for sale or distribution in any
manner. This document may not be copied, scanned, duplicated, forwarded, distributed, or posted on a website, in whole or part.
9-39 (Continued-1)
= $25,000 ÷ (1 – 0.4) = $41,666.67
Required sales (in units) to achieve after-tax profit target
= (F + targeted pre-tax profit) ÷ cm per unit
4. Contribution income statement:
Sales (13,544 units × $90/unit) = $1,218,960
Less: Variable cost (@ $63/unit) = $853,272
Contribution margin (@ $27/unit) = $365,688
Note: Difference of $13 is due to rounding up in terms of sales volume in
units.
Chapter 9 – Short-Term Profit Planning: Cost-Volume-Profit (CVP) Analysis
9-37
9-39 (Continued-2)
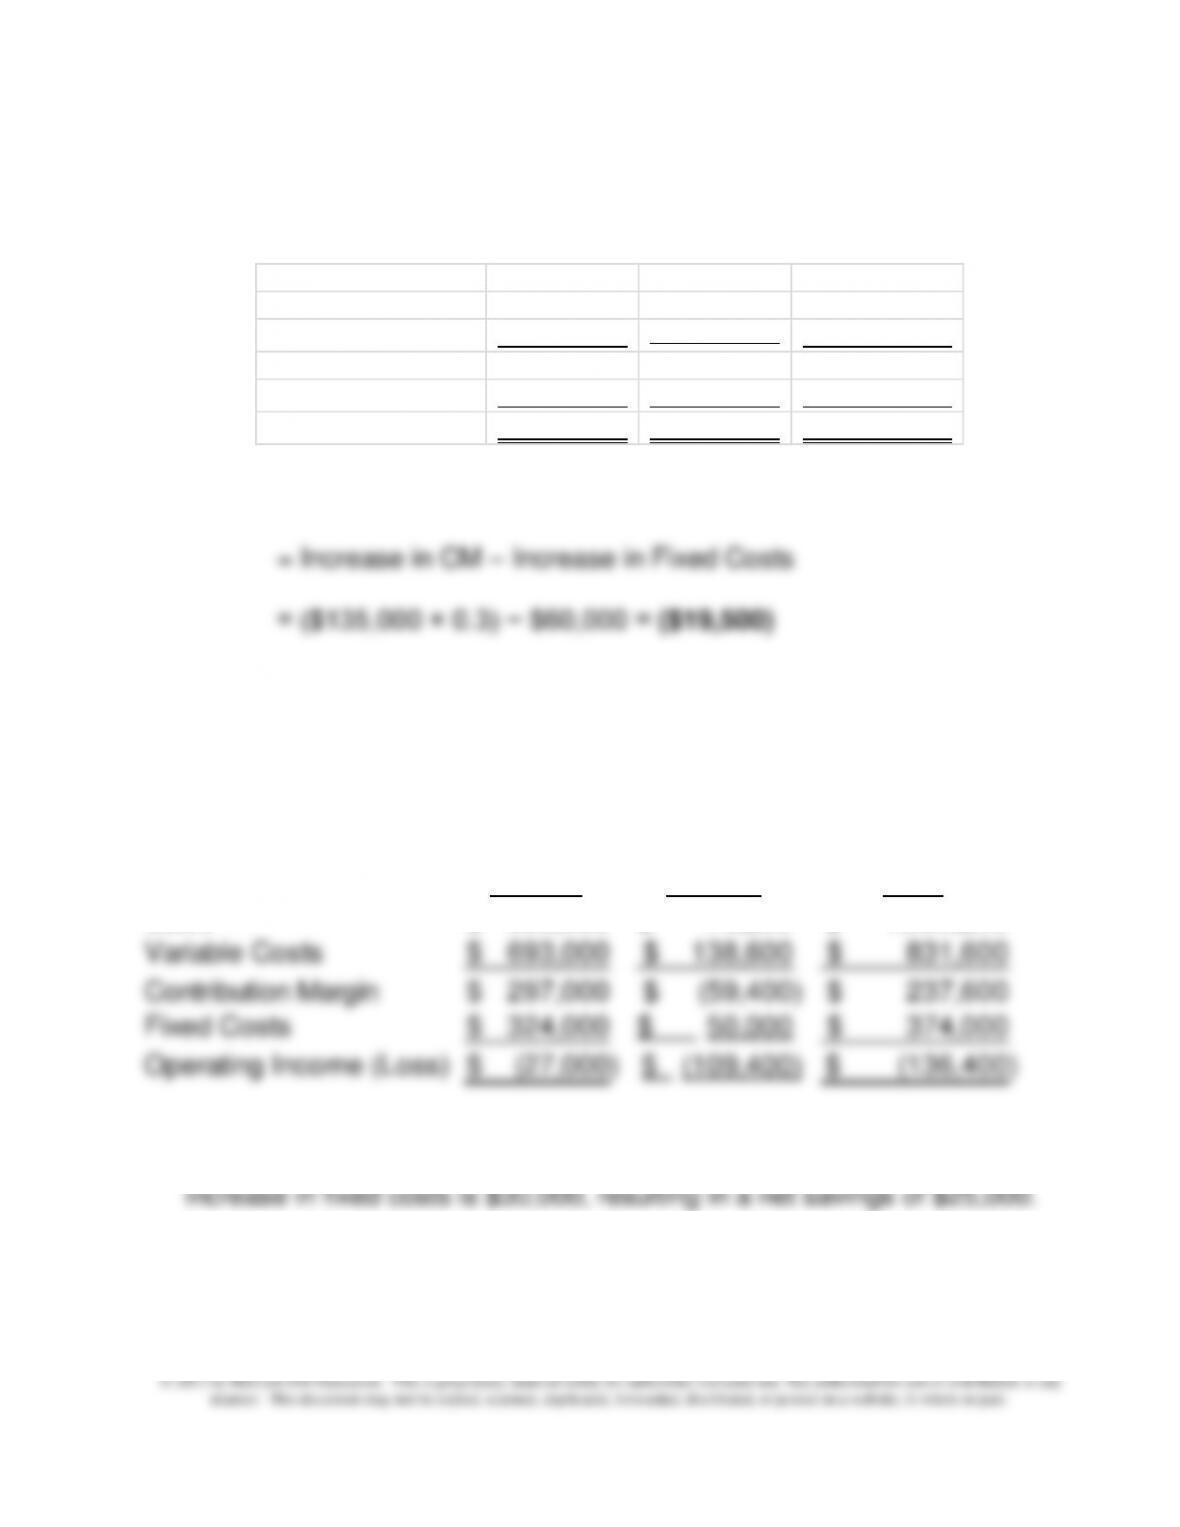
5. Profits will decrease by $19,500, from -$27,000 to – $46,500
Or,
6. Profit will decrease $109,400, from a loss of $27,000 to a loss of $136,400:
Planned reduction in selling price/unit =
10%
Estimated increase in sales volume (units) =
20%
Estimated increase in fixed costs =
$50,000
Original Change New
Sales 990,000$ 79,200$ 1,069,200$
Variable Costs 693,000$ 138,600$ 831,600$
Contribution Margin 297,000$ (59,400)$ 237,600$
Fixed Costs 324,000$ 50,000
$ 374,000$
Operating Income (Loss)
(27,000)$ (109,400)
$ (136,400)$
7. The total reduction in variable cost is $5 × 11,000 = $55,000, while the
increase in fixed costs is $30,000, resulting in a net savings of $25,000.
Original After change
Sales 990,000$ 135,000$ 1,125,000$
Variable Costs 693,000 94,500
787,500$
Contribution Margin 297,000 40,500 337,500$
Fixed Costs 324,000 60,000$ 384,000$
Operating Loss (27,000)$ (19,500)$ (46,500)$
Chapter 9 – Short-Term Profit Planning: Cost-Volume-Profit (CVP) Analysis
9-38
9-40 CVP Analysis (45-50 min)
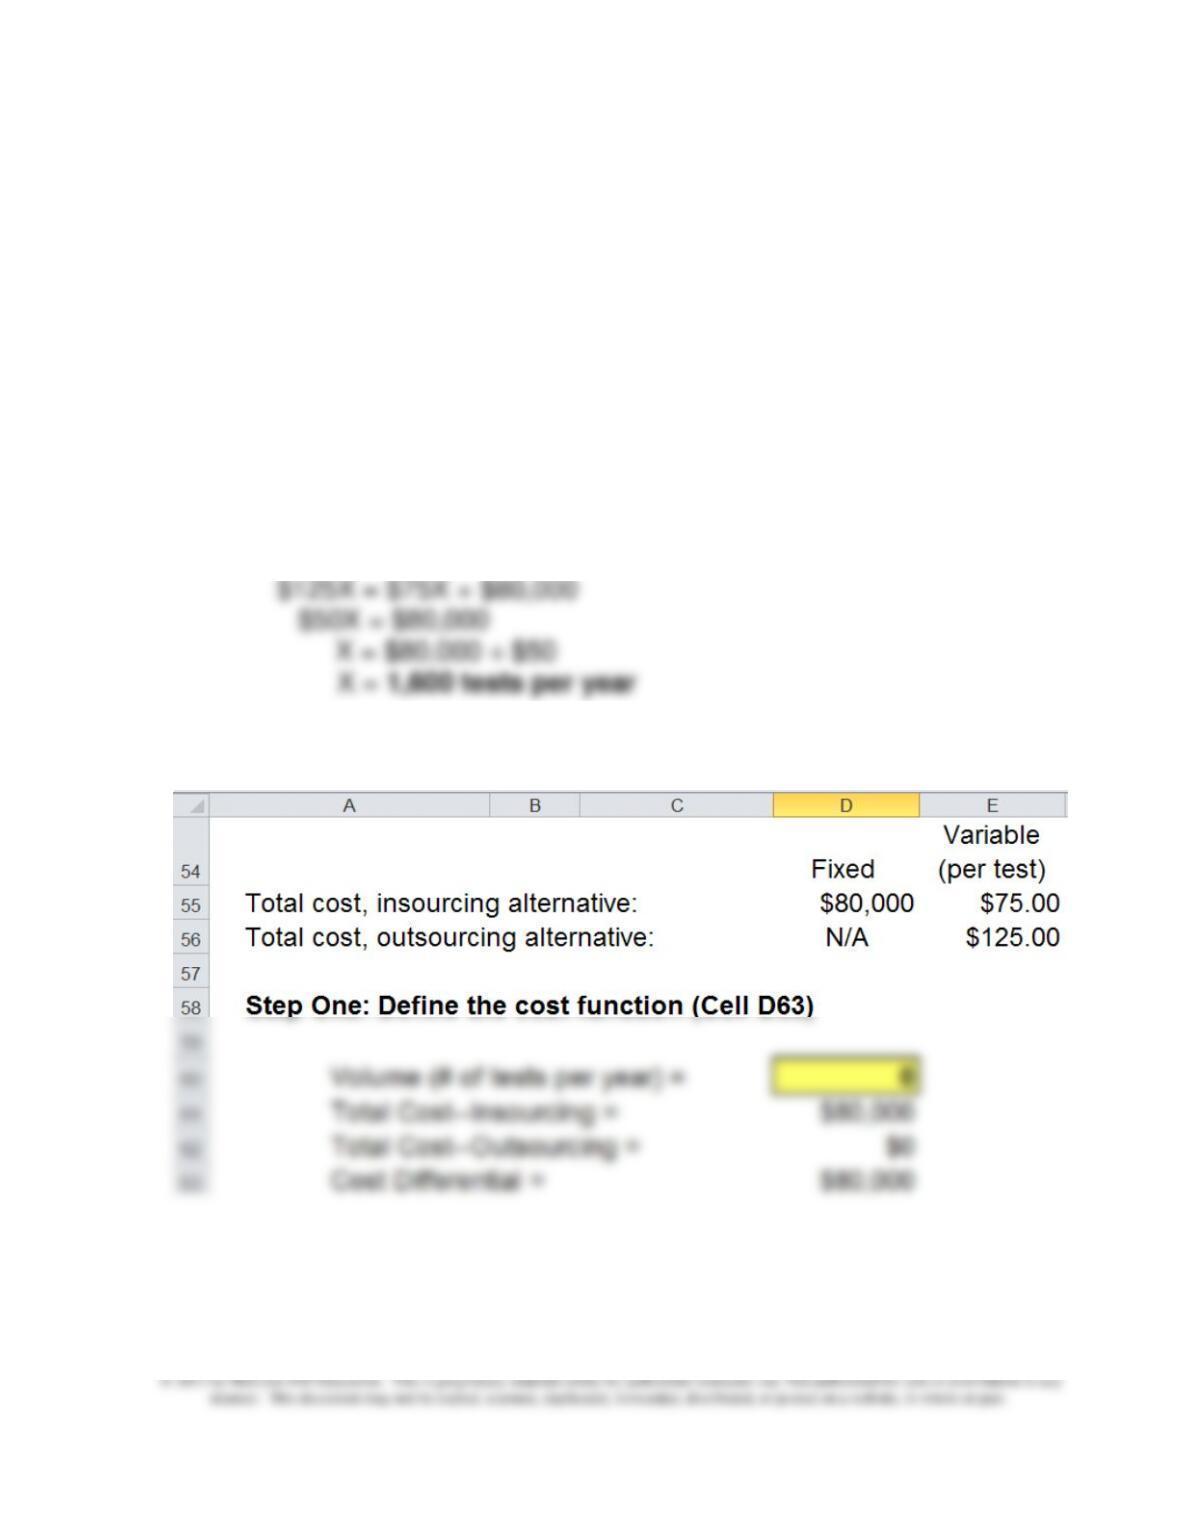
1. Pro-rated per-year fixed cost of blood gases analysis machine =
$800,000 ÷ 10 years = $80,000 per year
Savings per sample in direct costs if a blood gas analysis machine is
purchased: $125 − $75 = $50
Indifference point = ∆FC ÷ ∆ variable cost per test = $80,000 ÷ $50 =
1,600 samples (tests) per year
Alternatively (where X is the number of tests per year):
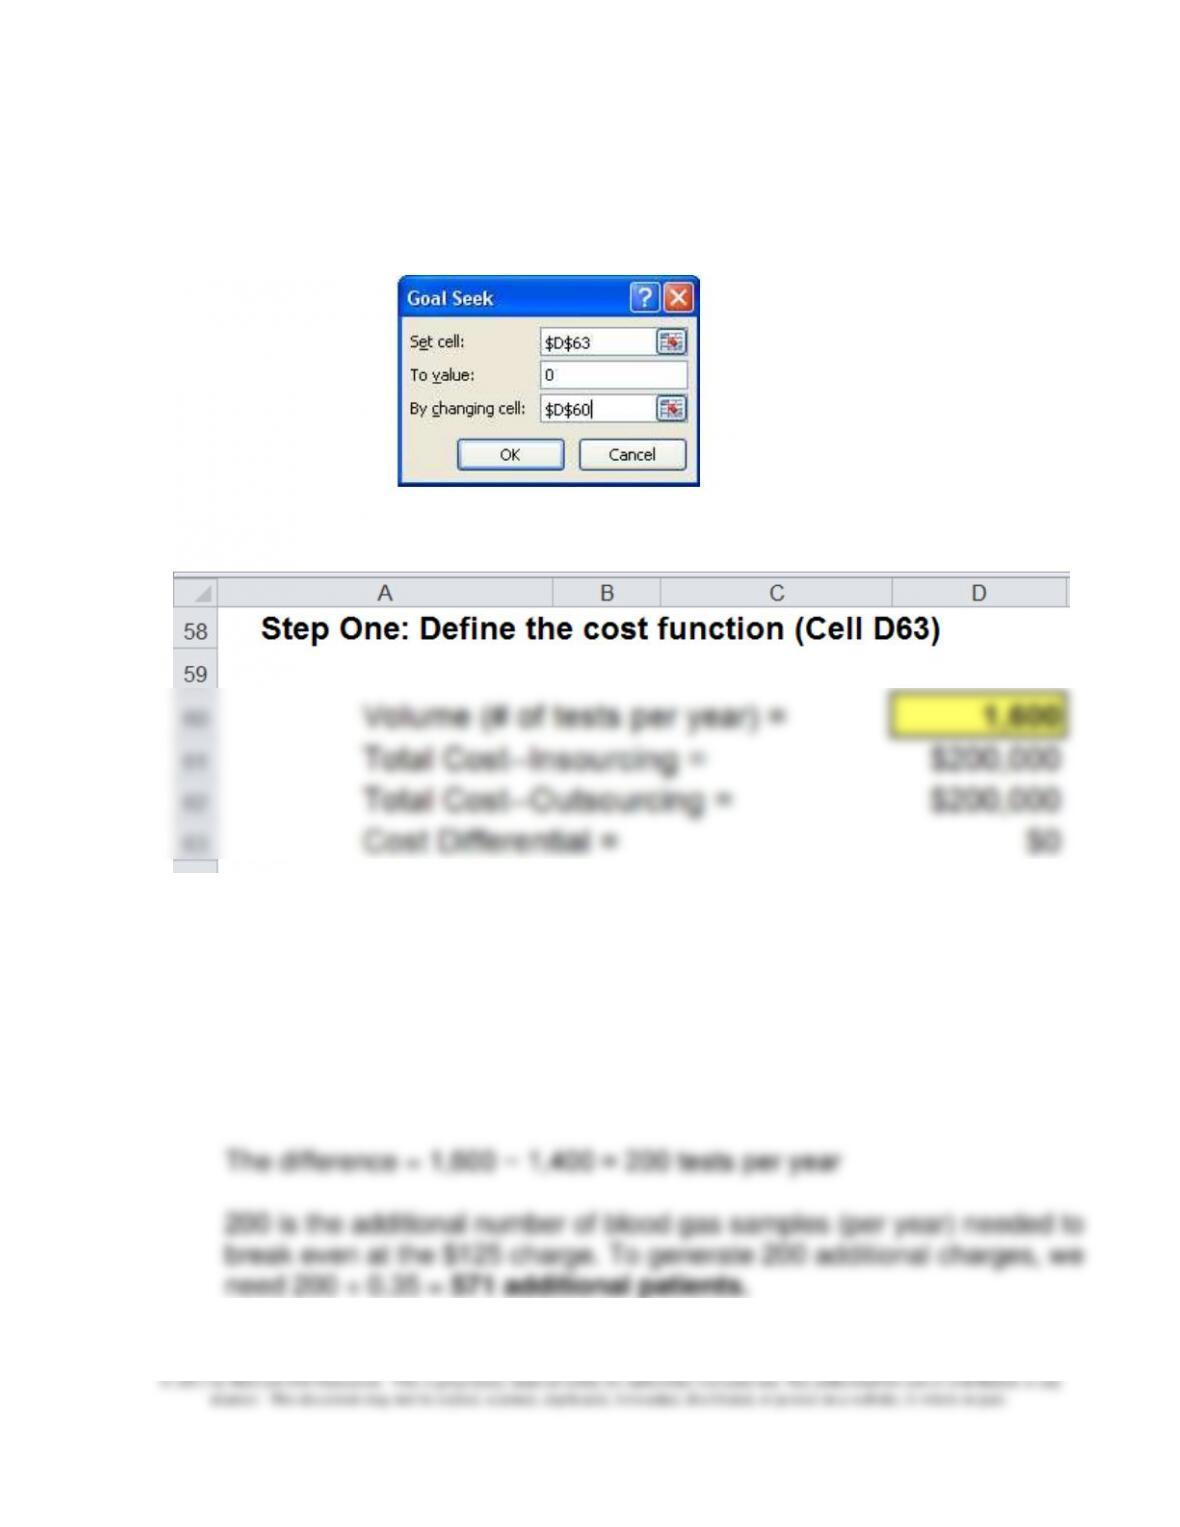
2. Using Goal Seek to determine the indifference point:
Note: Cell D61 contains the formula: =D55 + (D60*E55)
Cell D62 contains the formula: =D60*E56
Cell D63 contains the formula: =D61 – D62
Chapter 9 – Short-Term Profit Planning: Cost-Volume-Profit (CVP) Analysis
9-39
9-40 (Continued-1)
Step Two: Run Goal Seek
Step Three: Results
Thus, at 1,600 tests per year, the total cost under each of the two
decision alternatives would be the same: $200,000.
3. Current number of patients per year needing analysis = 4,000
# needing blood gas analysis = 4,000 × 35% = 1,400
Chapter 9 – Short-Term Profit Planning: Cost-Volume-Profit (CVP) Analysis
9-40
9-40 (Continued-2)
4. The amount the diagnostic screening center would have to charge clients
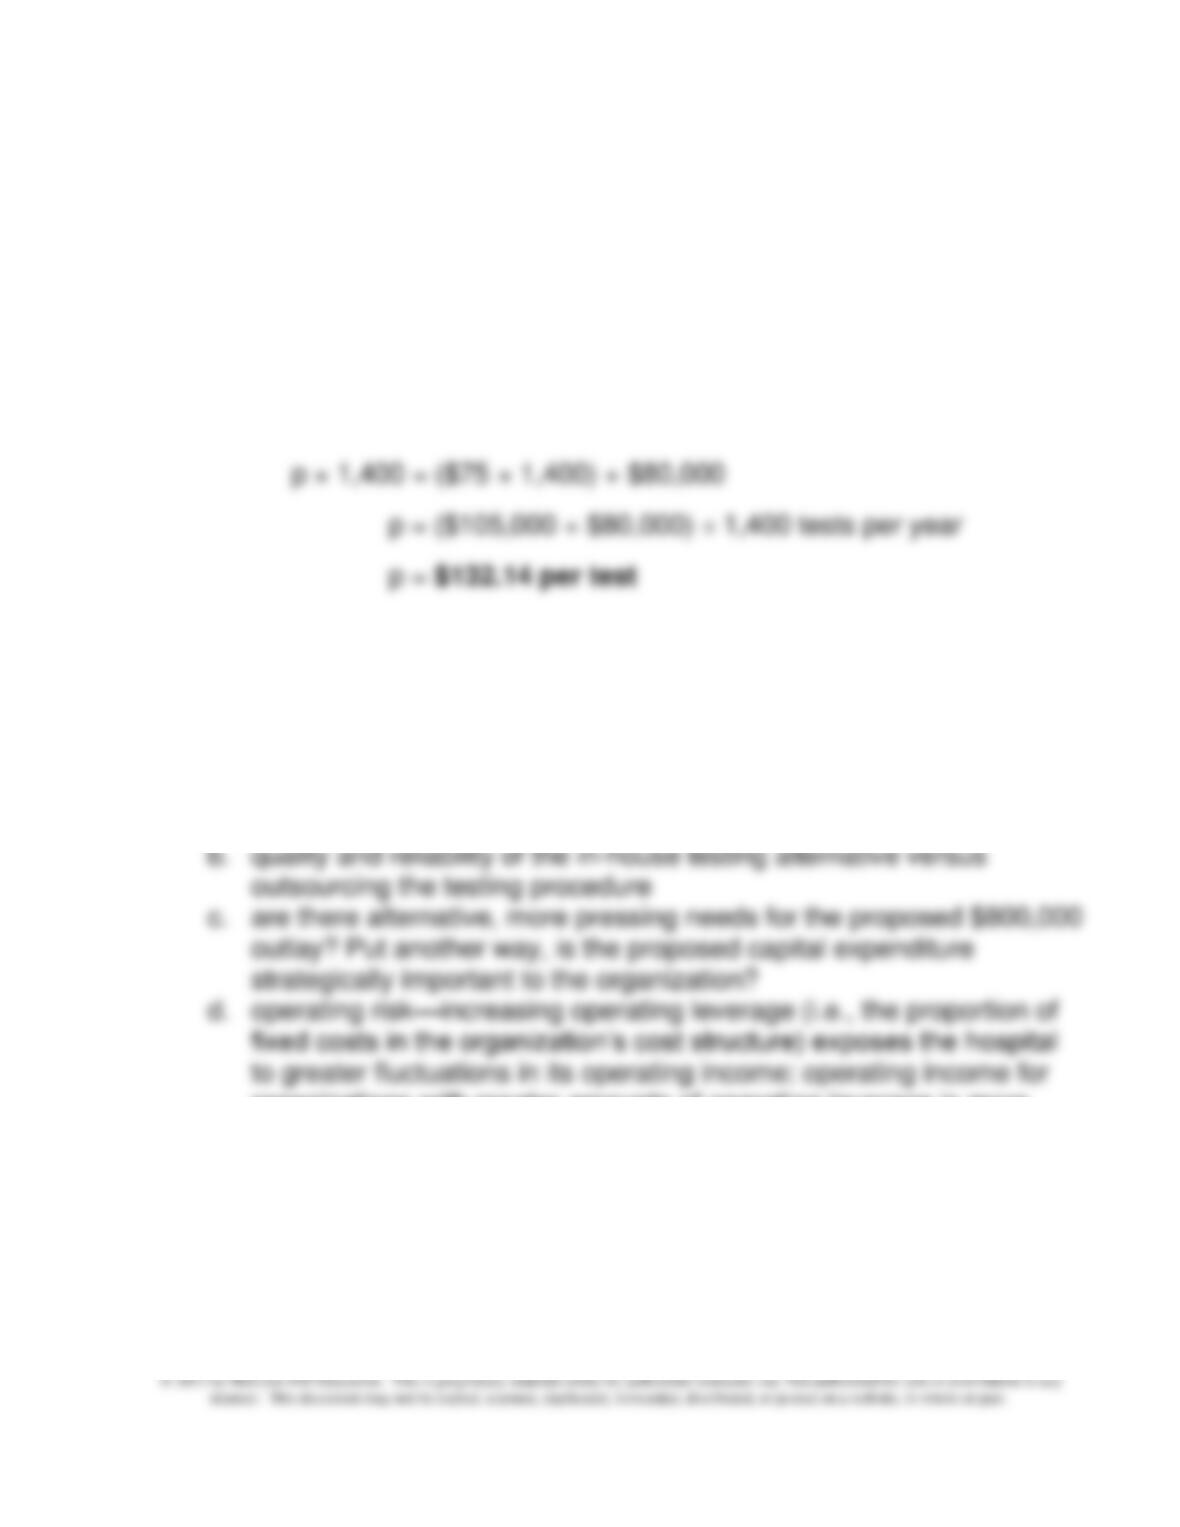
at the current patient level:
Let p = required charge (service fee)
Current # of tests performed per year = 4,000 × 0.35 = 1,400
To solve for the breakeven charge rate (per test):
Note: the above result could have been obtained, as well, through the
use of Goal Seek.
5. Additional factors to be considered:
a. time-value-of-money (opportunity cost of capital)—the decision at
hand is really a capital budgeting problem
organizations with greater amounts of operating leverage is more
sensitive to changes in volume.
e. would the purchase of the machine now provide a disincentive to
invest in this area in the future?
Chapter 9 – Short-Term Profit Planning: Cost-Volume-Profit (CVP) Analysis
9-41
9-41 CVP Analysis in a Professional Service Firm (30 min)
1. If operating profit is to increase, the contribution margin of the new
business must be positive.
For a breakeven situation, incremental revenue (billings) must equal
incremental costs (both variable and fixed).
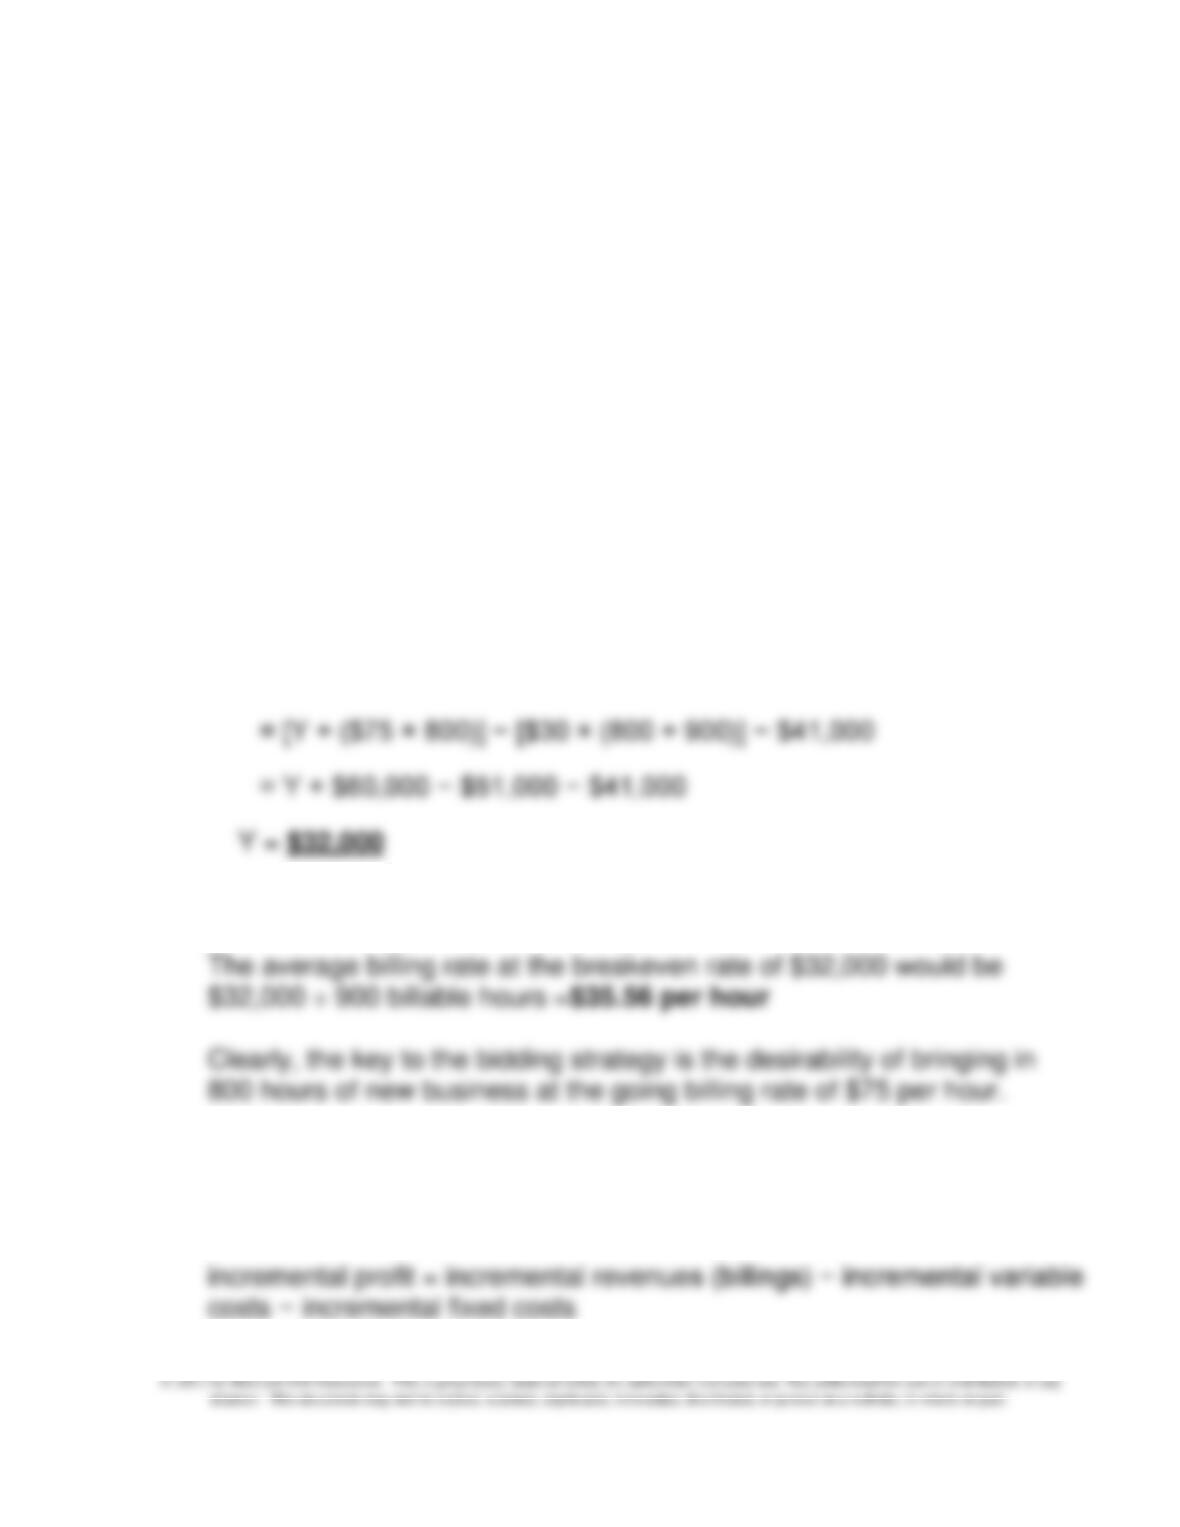
Let Y = the minimum revenue that must be earned from the county work in
order to insure that operating profit of the firm does not decrease. Thus,
looking at this new business proposal in its entirety:
Profit = Revenue − Variable Costs − Fixed Costs
At breakeven, profit = 0 (by definition). Thus,
0 = [Y + revenue from new business] − Variable cost − F
Revenue above this level will result in incremental profit.
2. At breakeven point for the total new business (county audit job +
additional new business), incremental revenue (billings) in total would
equal incremental costs (both variable and fixed).
Chapter 9 – Short-Term Profit Planning: Cost-Volume-Profit (CVP) Analysis
9-42
Alternatively, at breakeven:
9-41 (Continued)
Incremental revenues (billings) = incremental costs (variable + fixed)
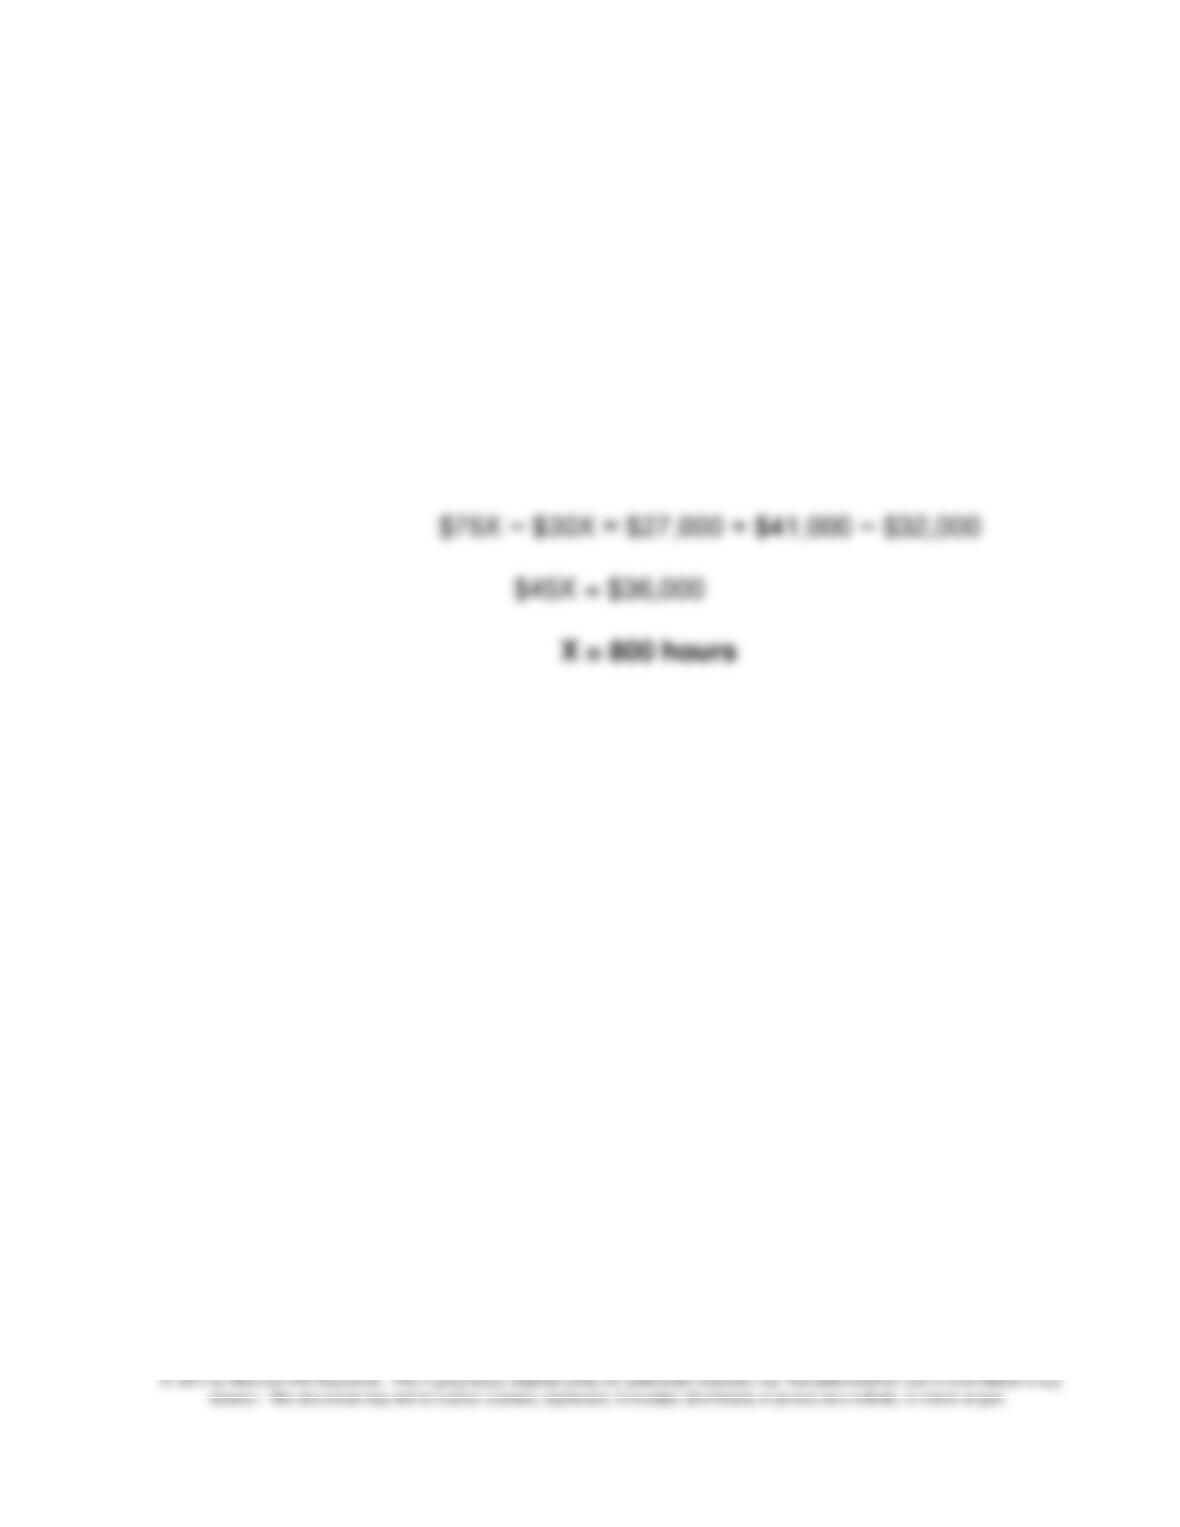
Let X equal the minimum number of hours of new business required to
breakeven. At breakeven, we have:
$32,000 + $75X = [$30 × (900 + X)] + $41,000
Note that the managing partner’s estimate of 800 hours of new business
leaves a margin of safety of zero hours, i.e., MOS = 800 hours − 800
hours = 0.
Chapter 9 – Short-Term Profit Planning: Cost-Volume-Profit (CVP) Analysis
9-43
9-42 CVP Analysis; Sensitivity Analysis; Multiple Products (50-60 min)
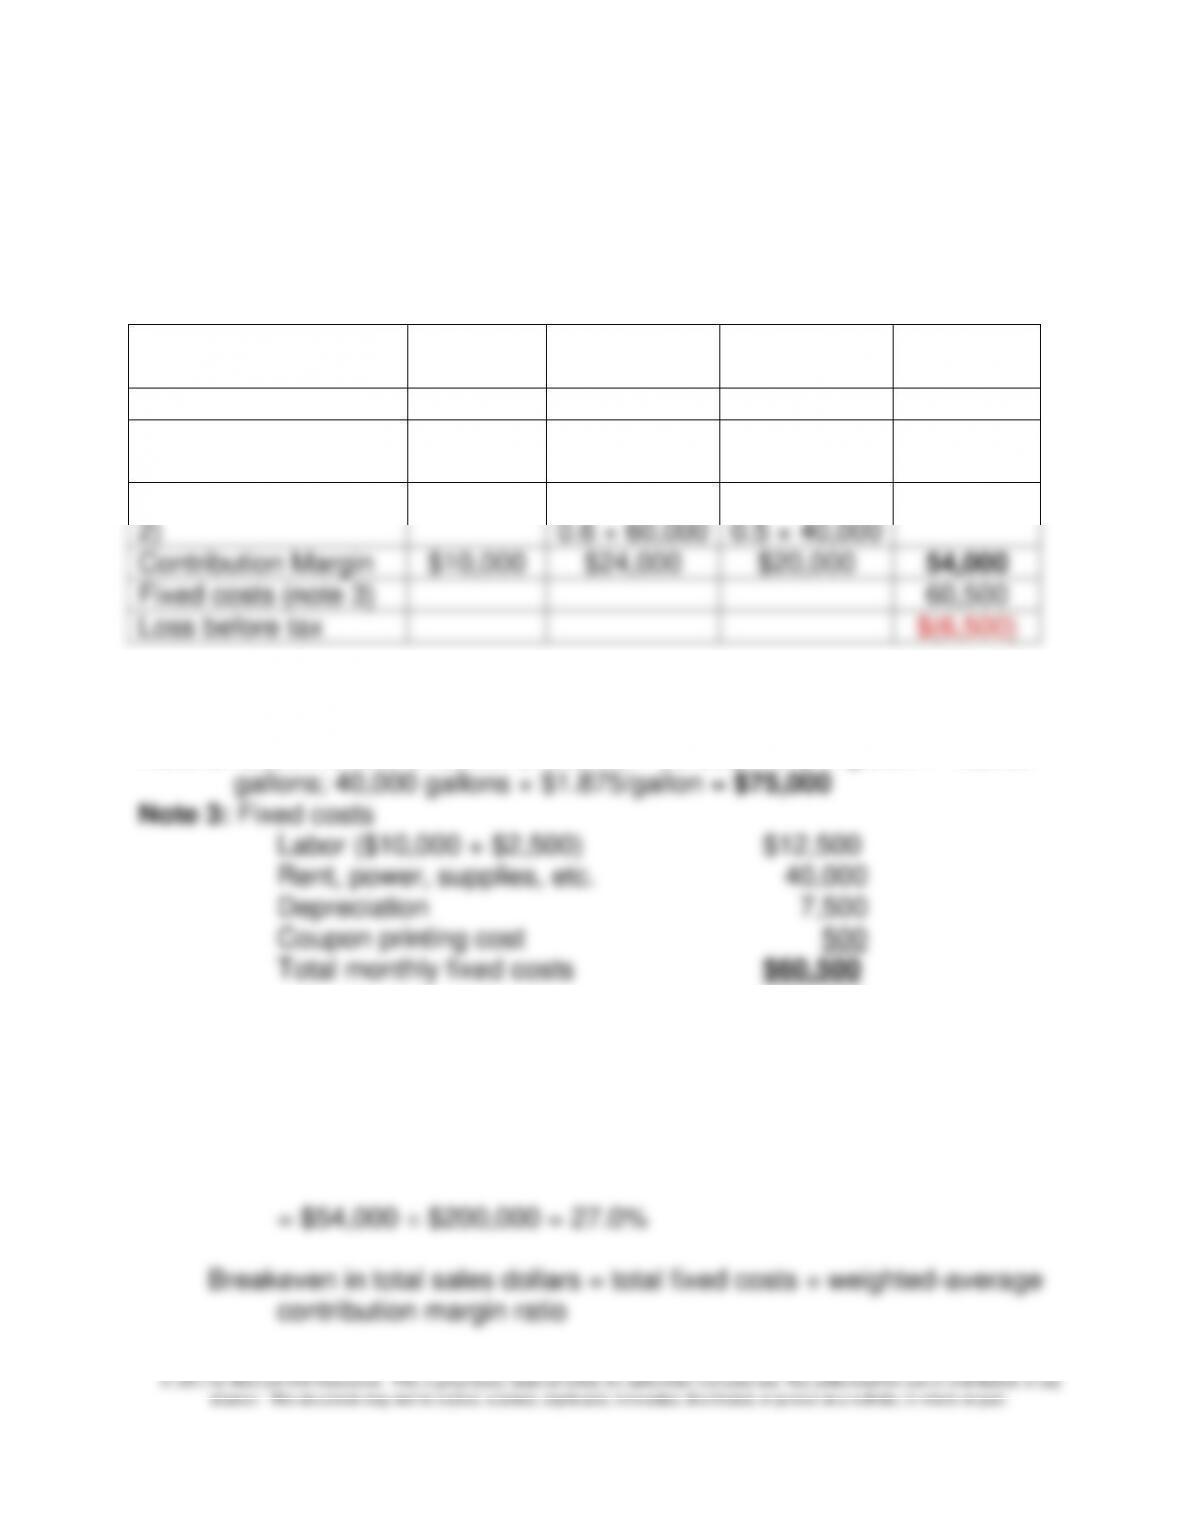
1. GoGo Juice’s profit (loss) before tax from implementing the promotional
coupon with no change in sales volume and sales mix is ($6,500)
Gasoline
Food &
Beverage
Other
Total
Sales Revenue
$100,000
$60,000
$40,000
$200,000
Coupons redeemed
(note 1)
(15,000)
(15,000)
Cost of Sales (note
2)
(75,000)
(36,000) =
0.6 × 60,000
(20,000) =
0.5 × 40,000
(131,000)
Contribution Margin
$10,000
$24,000
$20,000
54,000
Fixed costs (note 3)
60,500
Loss before tax
$(6,500)
Note 1: Coupons redeemed: total sales of ($200,000 × 75%) ÷ 10 ($1 per $10)
= $15,000
Note 2: Gasoline cost of sales: $100,000 ÷ $2.50 price per gallon = 40,000
2. The breakeven point in sales dollars for GoGo, based on the weighted-
average contribution margin ratio (CMR) approach:
Weighted-average contribution margin ratio = total contribution
margin ÷ total sales dollars

Chapter 9 – Short-Term Profit Planning: Cost-Volume-Profit (CVP) Analysis
9-44
© 2013 by McGraw-Hill Education. This is proprietary material solely for authorized instructor use. Not authorized for sale or distribution in any
manner. This document may not be copied, scanned, duplicated, forwarded, distributed, or posted on a website, in whole or part.
= $60,500 ÷ 0.27 = $224,074
9-42 (continued-1)
3. Allocation of total breakeven sales dollars across the three product lines
(based on sales mix determined on the basis of relative sales dollars, not units,
of the three products):
Total breakeven sales dollars (#2 above) = $224,074
Sales mix percentages, based on relative sales dollars:
Gasoline: $100,000 ÷ $200,000 = 0.50
4.
Sales revenue ($200,000 × 1.2) $240,000
Variable costs (sales − CM) 156,000
5. Sensitivity analysis is used to deal more effectively with uncertainty or risk.
Sensitivity analysis is a “what-if’ type of analysis used to determine the
break-even sales volume calculated.
At least three factors that make sensitivity analysis prevalent in decision-
making today include the following:
Chapter 9 – Short-Term Profit Planning: Cost-Volume-Profit (CVP) Analysis
9-45
© 2013 by McGraw-Hill Education. This is proprietary material solely for authorized instructor use. Not authorized for sale or distribution in any
manner. This document may not be copied, scanned, duplicated, forwarded, distributed, or posted on a website, in whole or part.
• The availability of computers and spreadsheet software has made it very
quick and easy to compute the impact of changing one or more
assumptions in a financial model.
9-42 (Continued-2)
• As the business environment is becoming more dynamic and competitive,
sensitivity analysis provides management with an understanding of the
impact of changes in the environment. The increased emphasis on
obtain additional information on these variables.
6. Methods, as discussed in the chapter, that can be used to address uncertainty
in the profit-planning process:
• Conventional measures associated with CVP analysis:
• Sensitivity analysis:
o Simple “what–if” analysis/analyses
operating incomes)