Chapter 9 – Short-Term Profit Planning: Cost-Volume-Profit (CVP) Analysis
9-16
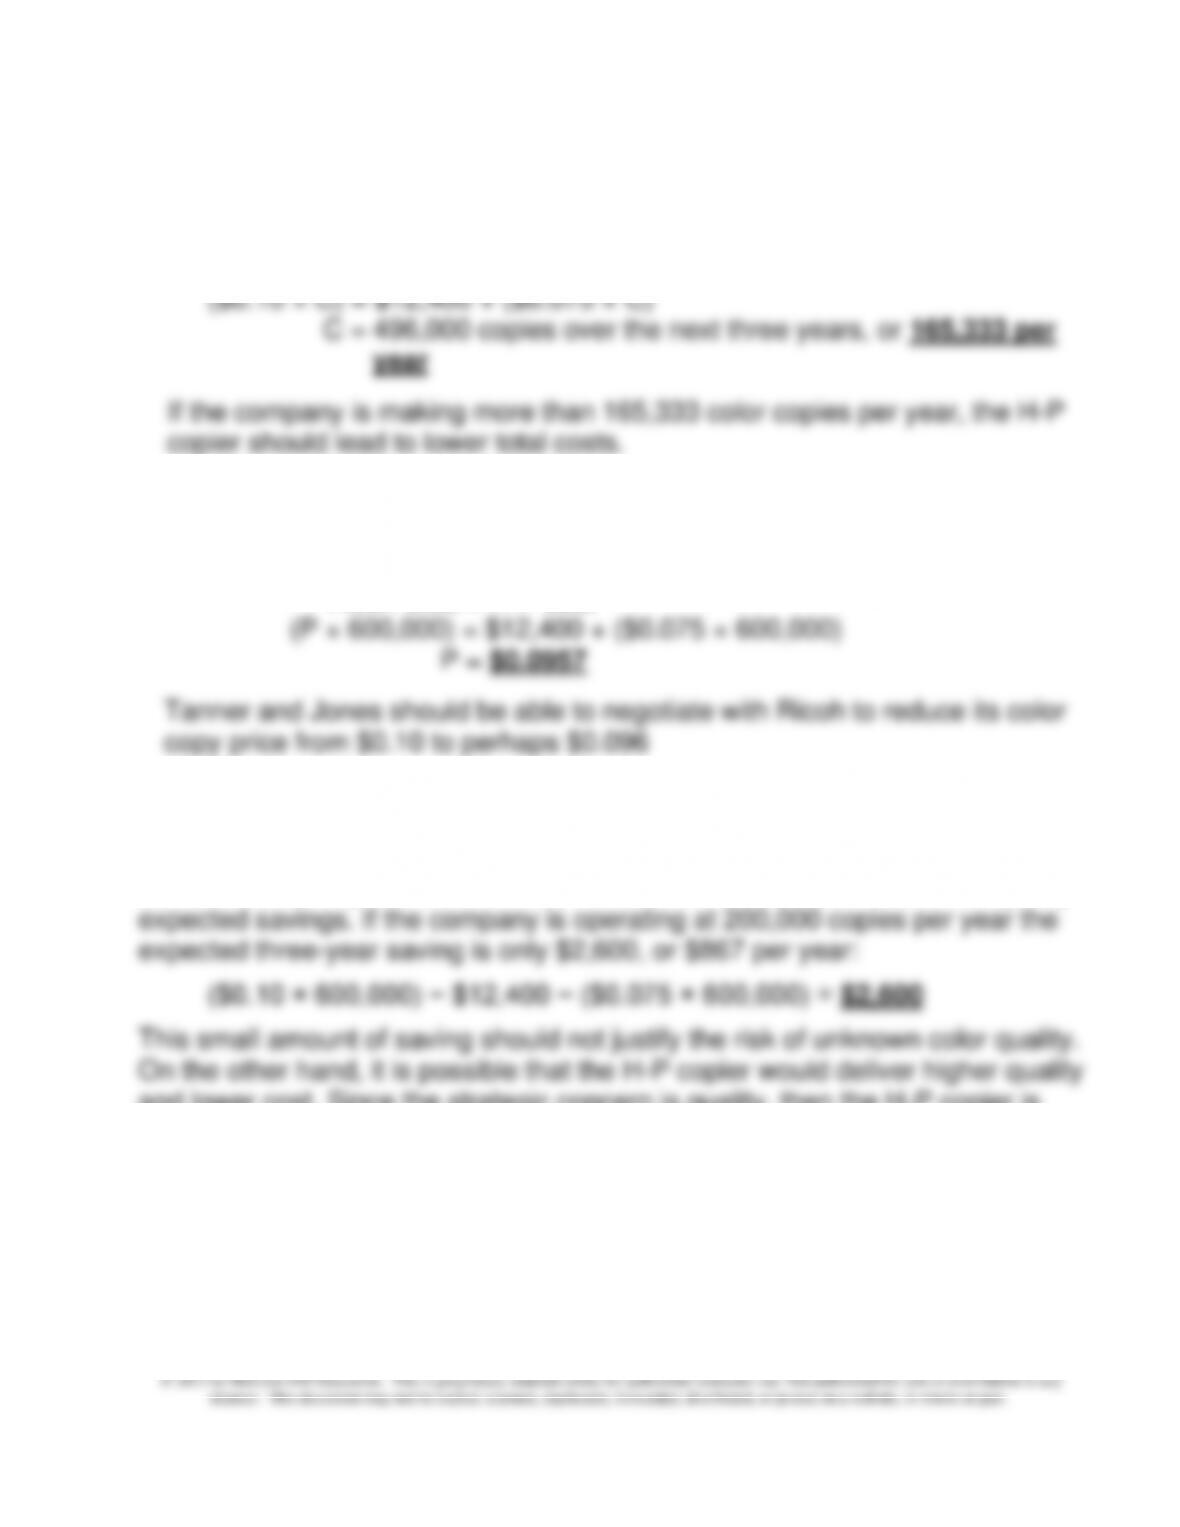
9-29 Cost Planning: High-End Copiers (20 min)
1. The breakeven number of copies (C) can be determined as follows:
Ricoh Cost = H-P Cost
2. The breakeven price (P) can be determined as follows:
200,000 copies per year = 600,000 copies for three years
Ricoh Cost = H-P cost
3. Since Tanner and Jones competes on quality and service, it is critical that
the company has a reliable and very high quality color copier. If there is any
question that the H-P copier might not provide the quality of copy that Tanner
and Jones has experienced with the Ricoh, then this concern would trump any
and lower cost. Since the strategic concern is quality, then the H-P copier is
now preferred. From a strategic point of view, Tanner and Jones need to
carefully research the quality of the H-P copies before making a decision. Also,
if Tanner and Jones is expected to grow, then the attractiveness of the H-P
copier also increases, because the lower price per copy now applies to a larger
number of copies.
Source: Christopher Lawton, “H-P Begins Push Into High-End Copiers,” The
Wall Street Journal, April 24, 2007.
Chapter 9 – Short-Term Profit Planning: Cost-Volume-Profit (CVP) Analysis
9-17
9-30 Cost Structure of Retailers; the Internet; Operating Leverage (10 min)
1. A retailer can significantly reduce its operating leverage and reduce
costs during a period of initial growth in e-commerce by outsourcing its e-
commerce activity to service-providers. The term ESP for “e-commerce
2. Globalization presents an opportunity for the retailer to obtain the
outsourcing service in low-cost countries throughout the world. Some of
Chapter 9 – Short-Term Profit Planning: Cost-Volume-Profit (CVP) Analysis
9-18
9-31 Structuring Sales Commissions (15-20 min)
1. Omega—because it has the higher selling price and therefore the larger
sales commission per unit sold.
2. From the standpoint of the company, profits may be higher if customers
purchase more units of Alpha(relative to Omega). This is because Alpha
has the higher contribution margin per unit.
contribution margin will also maximize operating profit for the company.
Note that if there are production/resource constraints and the two products
consumed, on a per-unit basis, different amounts of the scarce resource(s),
then the sales commission compensation plan should be modified—to
reward salespeople for selling a product mix that maximizes the contribution
margin per unit of the scarce resource(s). Such an incentive plan would
likely lead to more goal-congruent behavior: by maximizing their own
welfare the salespeople would also help maximize operating income for the
company.
Addendum: Bazerman, M., and A. E. Tenbrunsel. 2011. Ethical
breakdowns. Harvard Business Review (April), pp. 58-65.
Ill-Conceived Goals (p. 60)
In the above-reference article, the authors state: “In our teaching, we often
deal with sales executives. By far the most common problem they report is
that their sales forces maximize sales rather than profits. We ask them what
incentives they give their salespeople, and they confess to actually
rewarding sales rather than profits. The lesson is clear: When employees
behave in undesirable ways, it’s a good idea to look at what you’re
encouraging them to do.”
Chapter 9 – Short-Term Profit Planning: Cost-Volume-Profit (CVP) Analysis
9-19
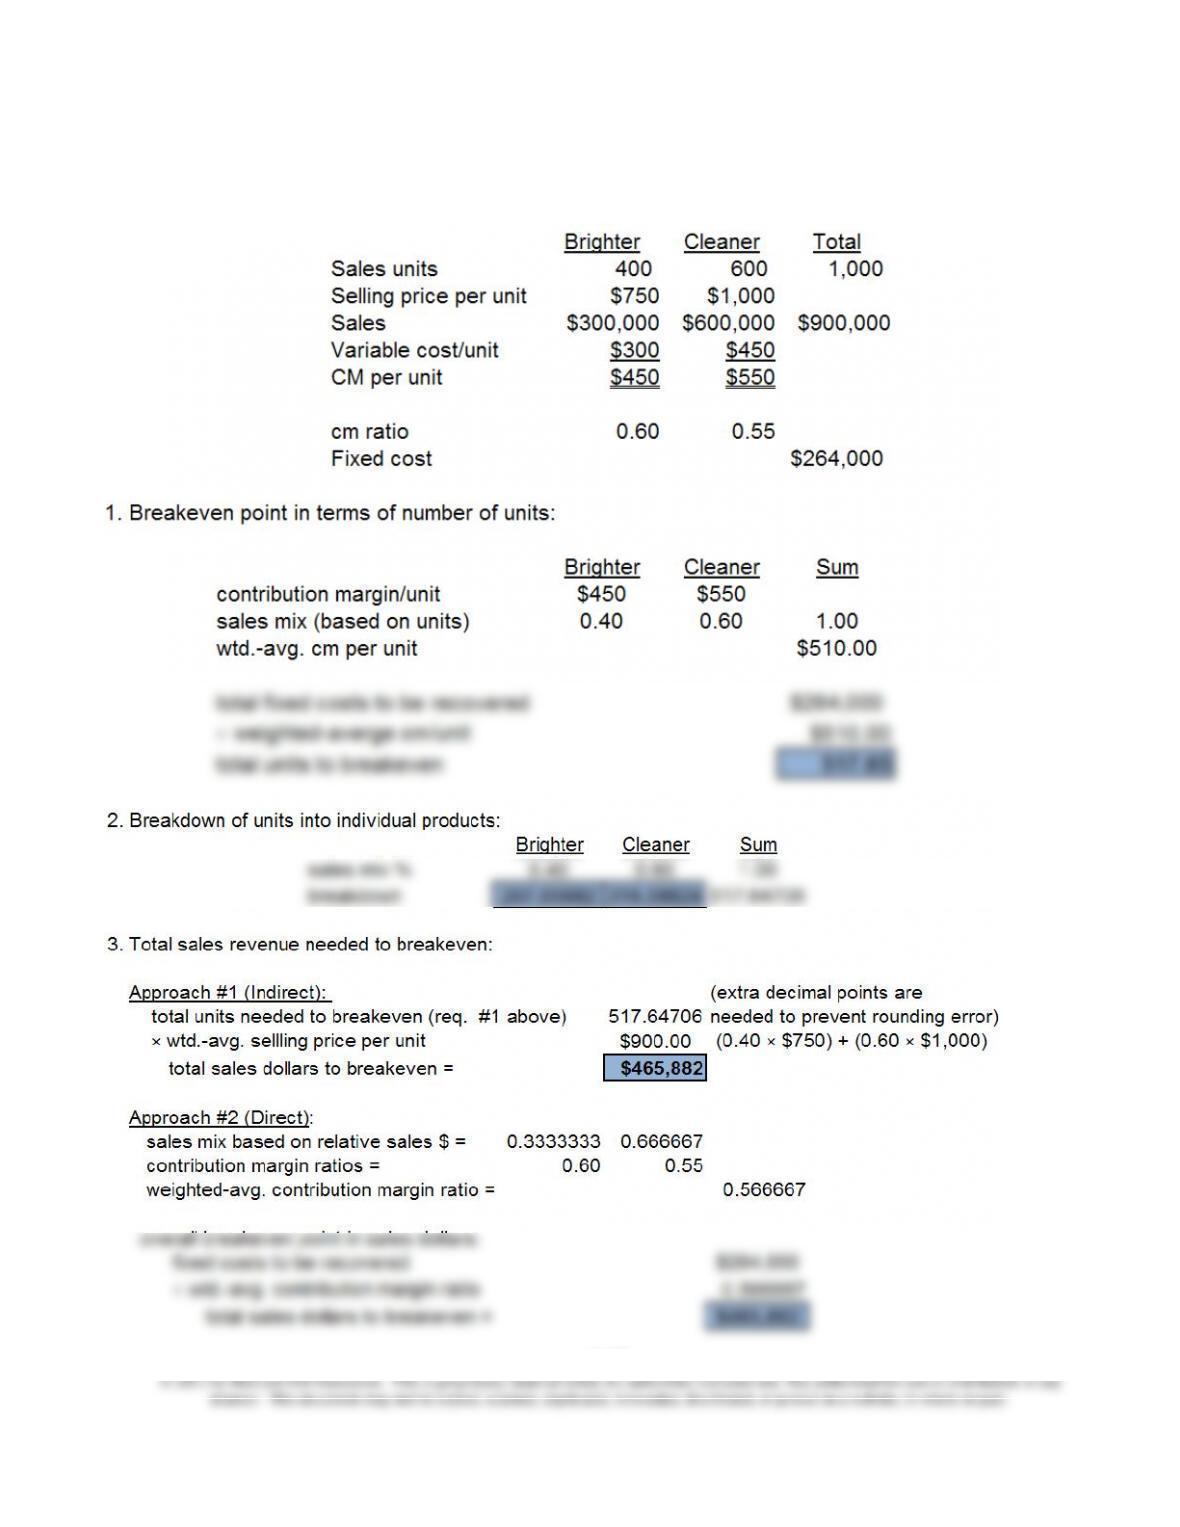
9-32 Multiple Product CVP Analysis (40-45 min)
Chapter 9 – Short-Term Profit Planning: Cost-Volume-Profit (CVP) Analysis
9-20
Ex. 9-32 (Continued)
4. If machine hours are limited (i.e., if they represent a “scare resource”), then
information regarding the machine-hour consumption of each of the two
products would be important for product-planning purposes. That is, such
the greater the profitability (and therefore desirability) of the product.
An Excel spreadsheet that provides the solution for this exercise is
embedded below:
Ex 9-32.xlsx
Chapter 9 – Short-Term Profit Planning: Cost-Volume-Profit (CVP) Analysis
9-21
9-33 CVP Analysis (20 min)
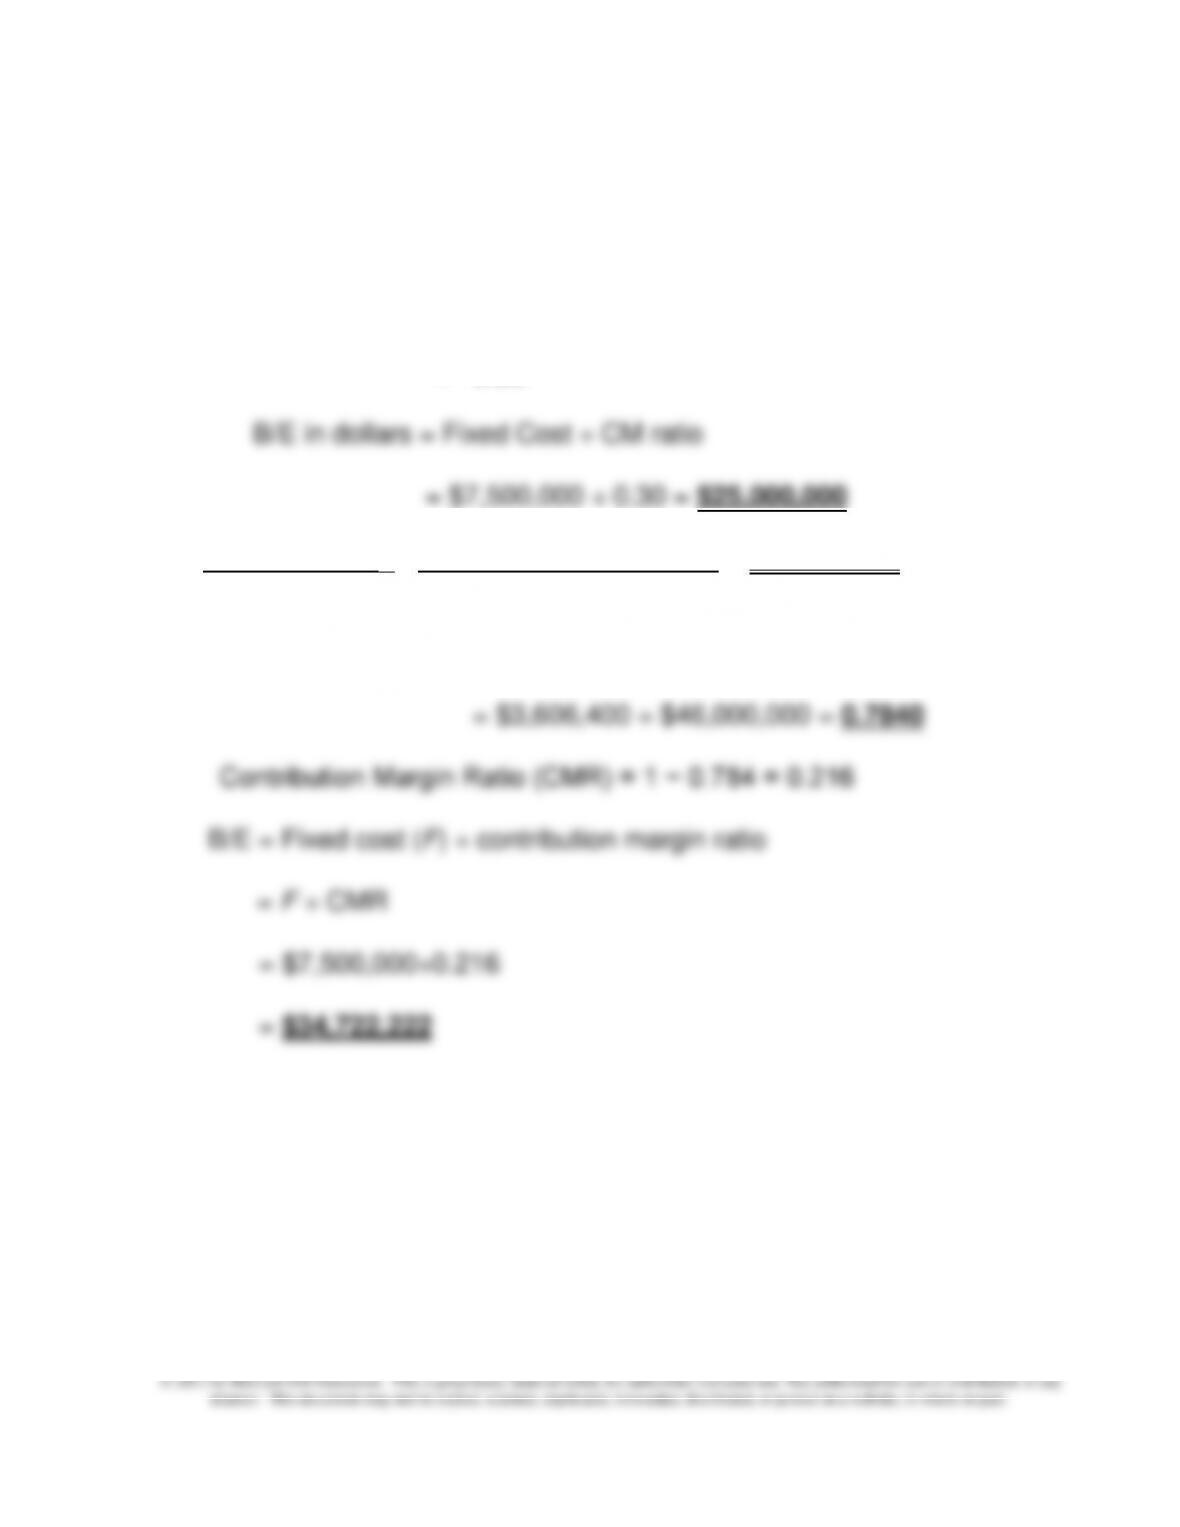
1. Contribution margin (CM) ratio = Contribution margin ÷ Sales
Thus, CM ratio = ($46,000,000 − $32,200,000) ÷ $46,000,000
= 0.30
2. Fixed Cost + πB = $7,500,000 + $8,000,000 = $51,666,667
CM ratio 0.30
3. Variable cost ratio = ($32,200,000 × 1.12) ÷ $46,000,000
Chapter 9 – Short-Term Profit Planning: Cost-Volume-Profit (CVP) Analysis
9-22
9-34 Contribution Income Statements; Sensitivity Analysis; Goal Seek
(Excel) (40-45 min)
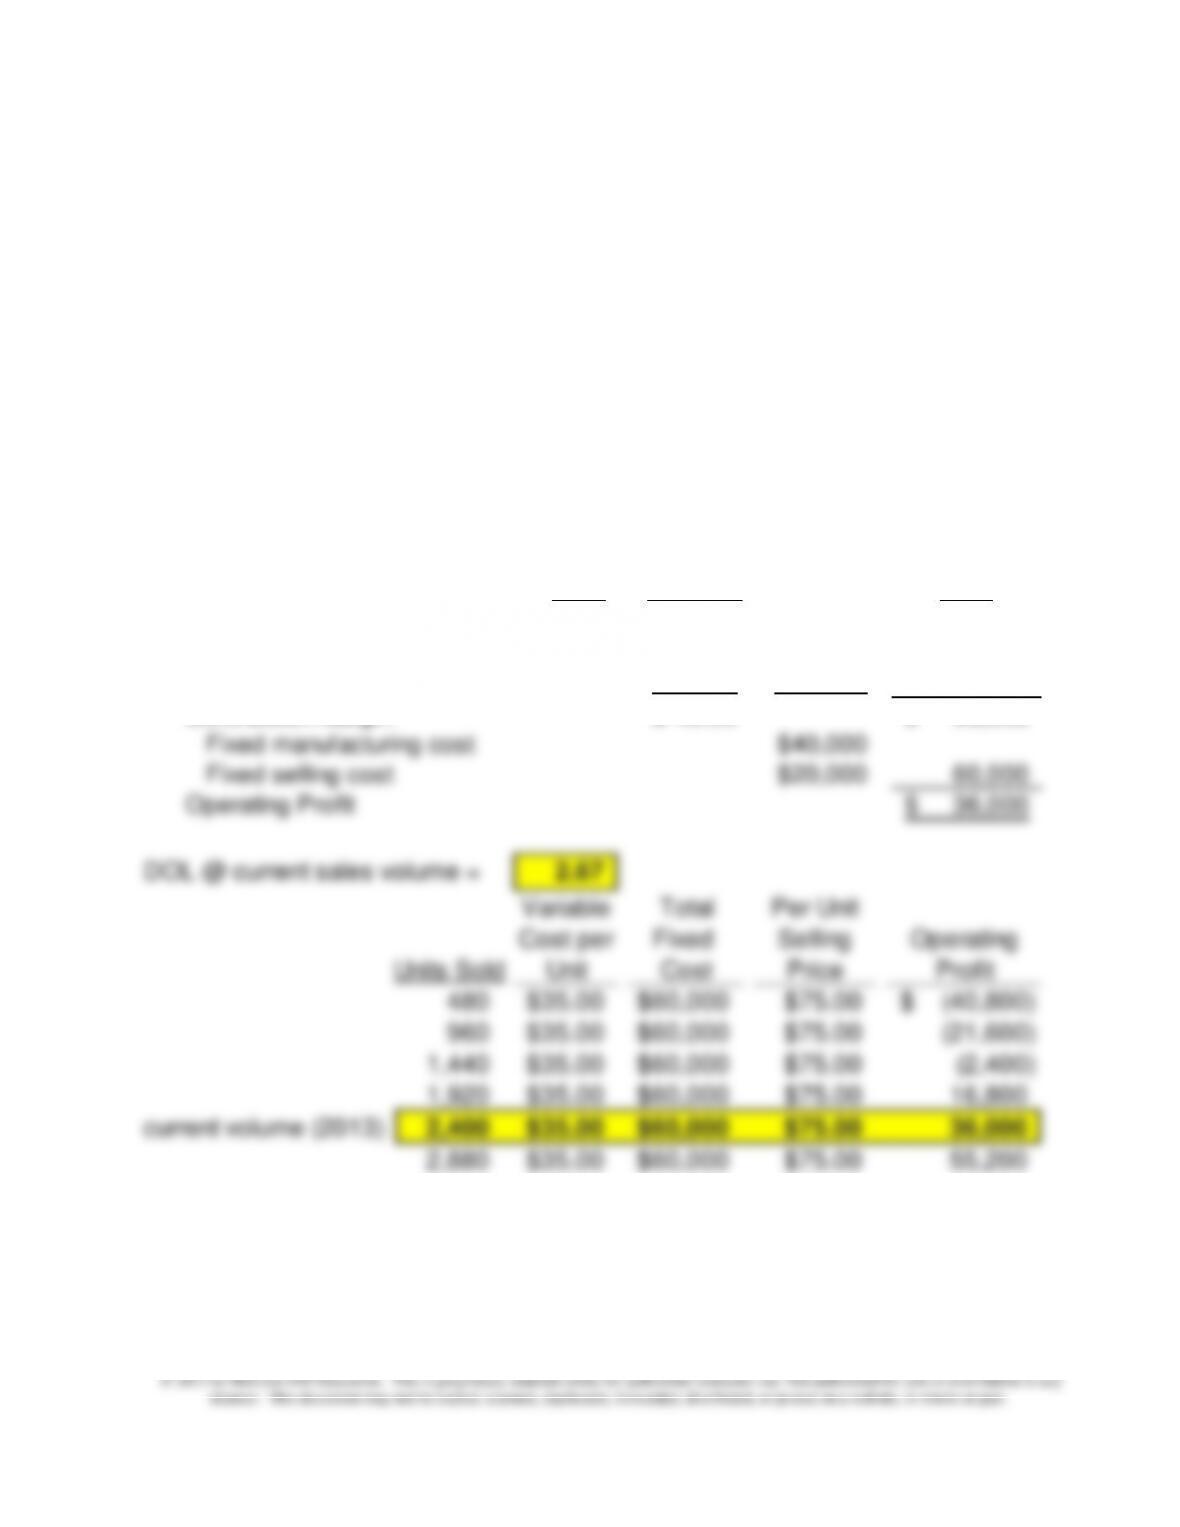
1. A variety of possible spreadsheets could satisfy this requirement. One
example is the spreadsheet embedded below. The sensitivity analysis
shows sales levels from 20% to 200% of 2013 expected sales of 2,400
units, and the related effect on operating profit.
HFI’s degree of operating leverage (DOL) from a sales volume of 2,4000
units is 2 2/3, so that from this volume level profits change much faster
(2.667 times faster) than a given change in the sales level.
Per Unit
Units Amounts Total
Sales 2,400 $75.00 180,000$
Variable manuacturing cost 2,400 $30.00 72,000$
Variable selling 2,400 5.00$ 12,000 84,000
Contribution Margin 40.00$ 96,000$
Fixed manufacturing cost $40,000
Fixed selling cost $20,000 60,000
Operating Profit 36,000$
DOL @ current sales volume = 2.67
Variable Total Per Unit
Cost per Fixed Selling Operating
Units Sold Unit Cost Price Profit
480 $35.00 $60,000 $75.00 (40,800)$
960 $35.00 $60,000 $75.00 (21,600)
1,440 $35.00 $60,000 $75.00 (2,400)
1,920 $35.00 $60,000 $75.00 16,800
current volume (2013) 2,400 $35.00 $60,000 $75.00 36,000
2,880 $35.00 $60,000 $75.00 55,200
3,360 $35.00 $60,000 $75.00 74,400
3,840 $35.00 $60,000 $75.00 93,600
4,320 $35.00 $60,000 $75.00 112,800
4,800 $35.00 $60,000 $75.00 132,000
Chapter 9 – Short-Term Profit Planning: Cost-Volume-Profit (CVP) Analysis
9-23
9-34 (continued-1)
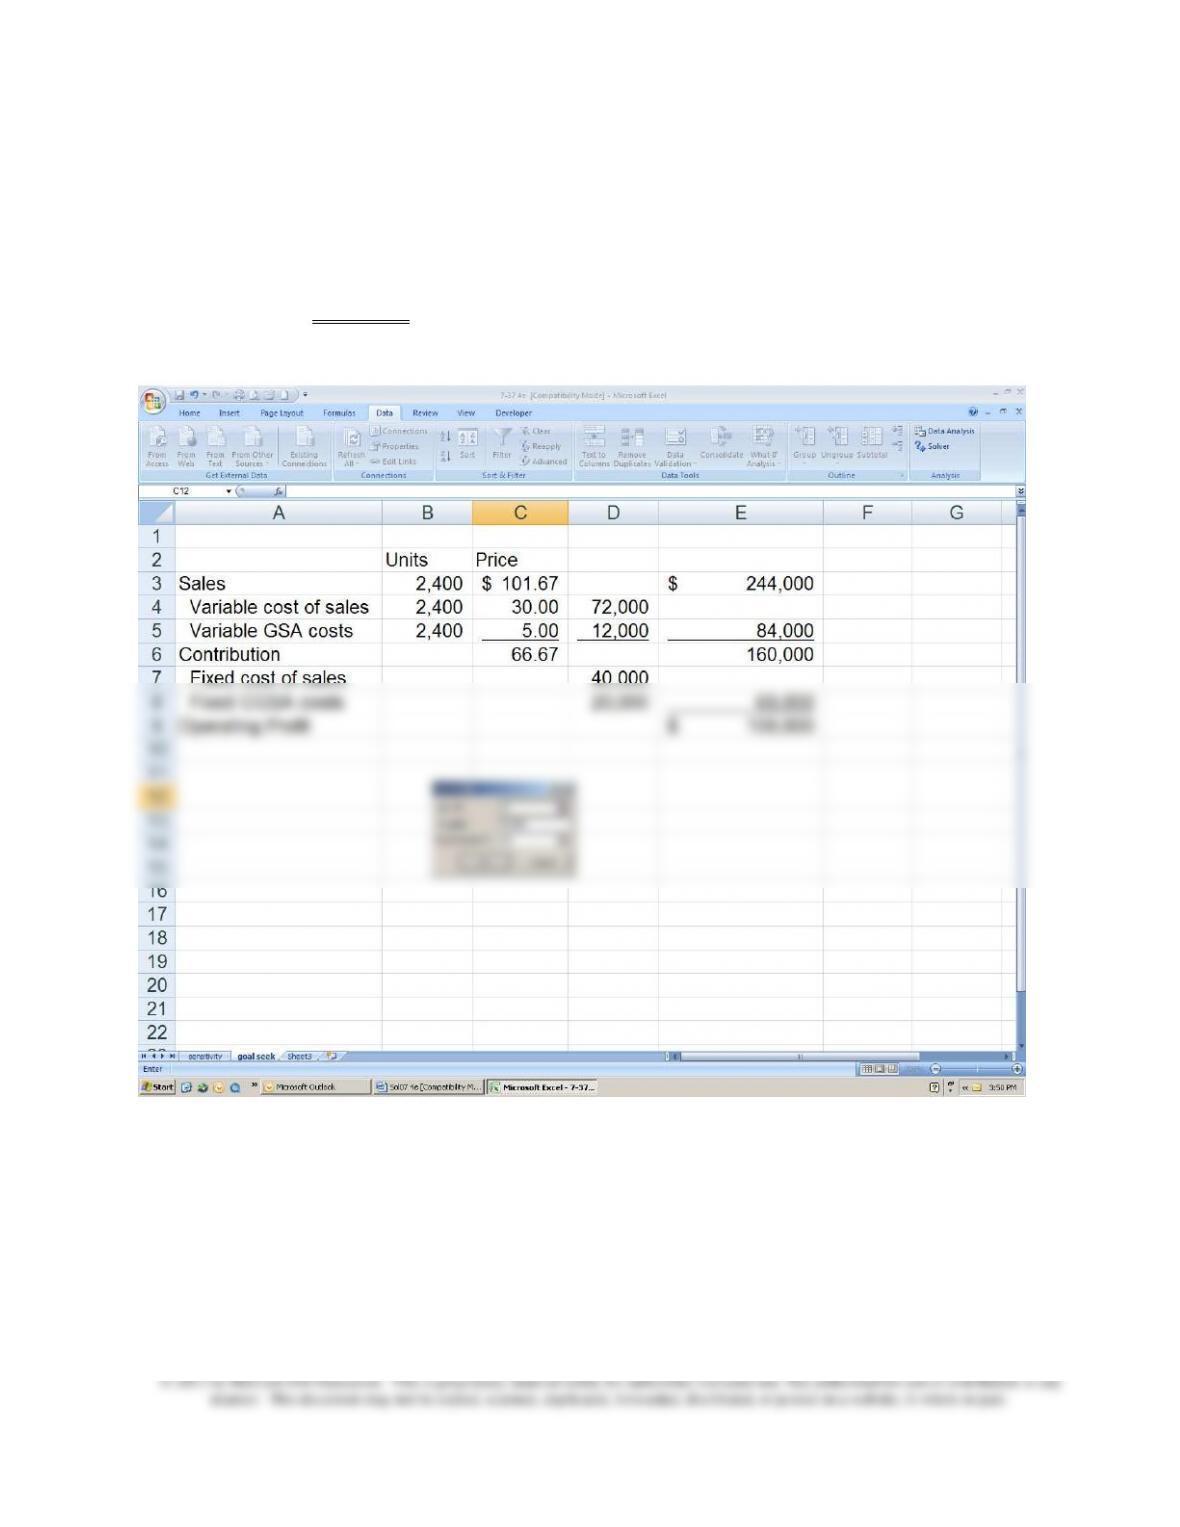
2. The Goal Seek tool is available under Data//What-if Analysis/Goal Seek in
Excel. An example of how it is used is show below. The price would have to
increase to $101.67 in order for HFI to make a $100,000 before tax profit.
Chapter 9 – Short-Term Profit Planning: Cost-Volume-Profit (CVP) Analysis
9-24
9-35 CVP Analysis, DOL, and Margin of Safety (20-30 min)
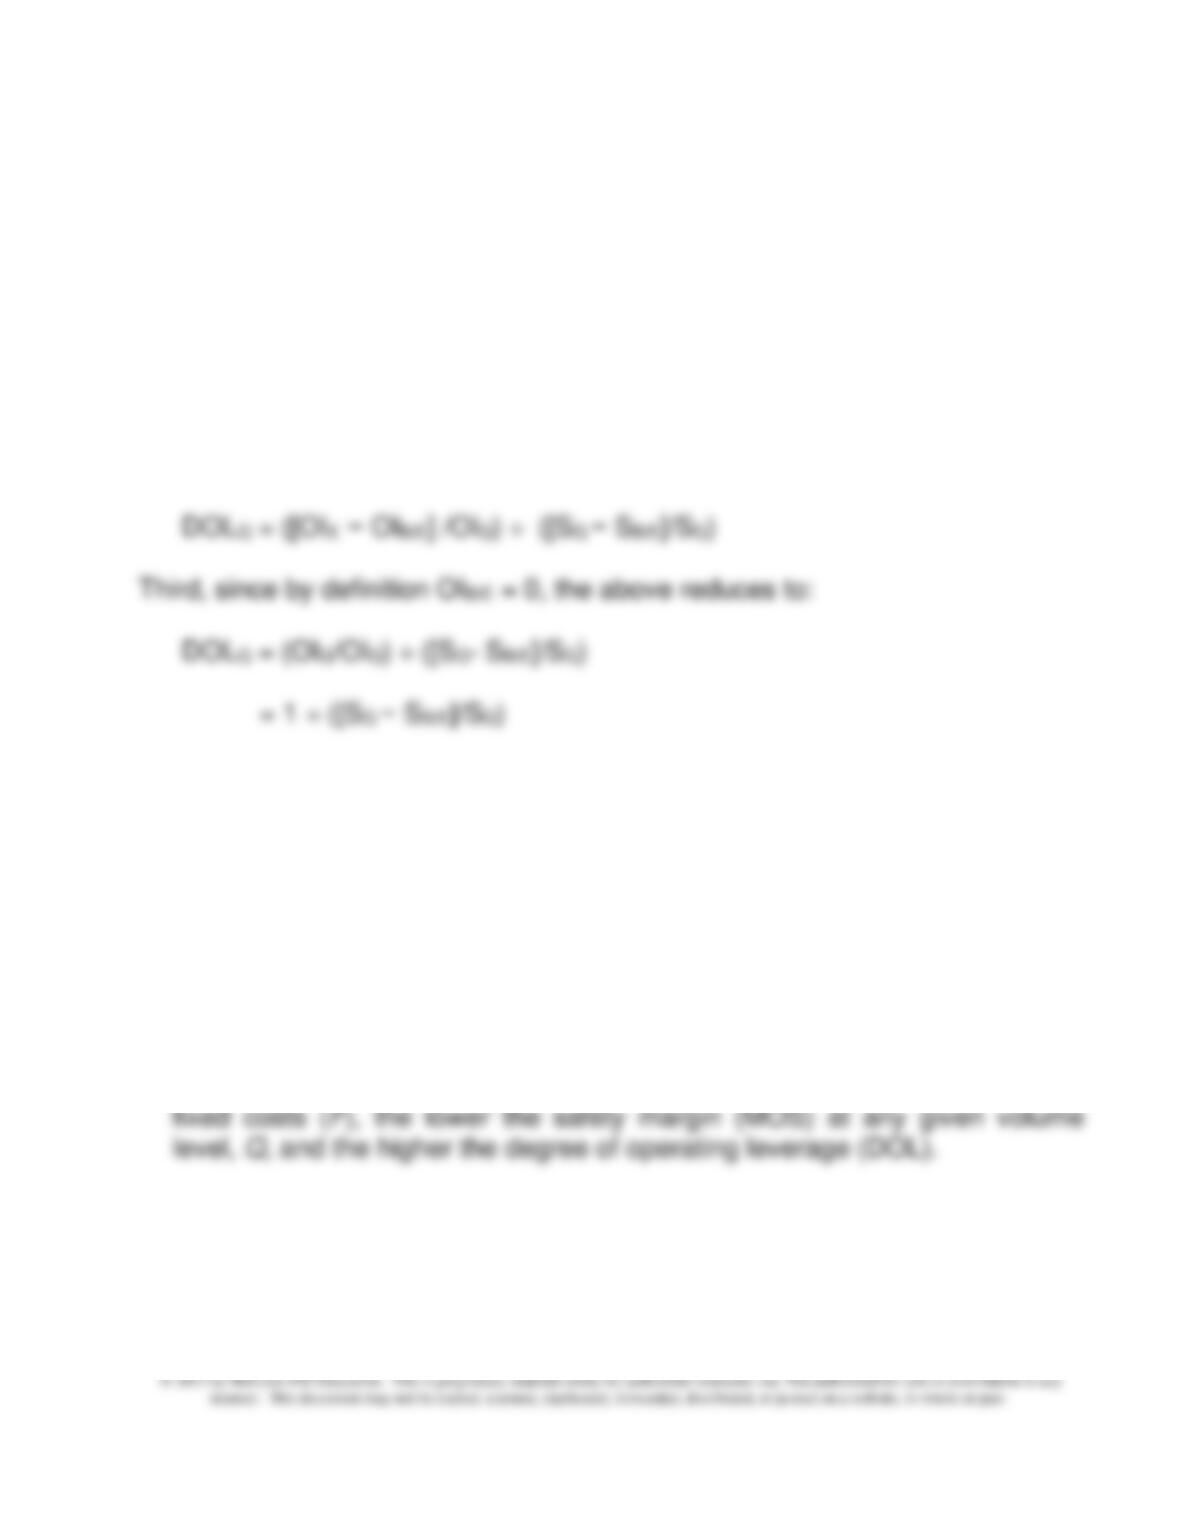
First, note that the DOL formula, at any sales volume level, Q, is written as:
DOLQ = change (∆) in operating income (OI) ÷ change in sales (S)
= [∆OI/OIQ] ÷ [∆S/SQ]
Second, define the change in OI and the change in S with respect to the break–
even point (B/E), as follows:
Finally, since by definition ([SQ − SB/E]/SQ) = MOS% (at volume level Q), we
have:
DOLQ = 1 ÷ MOS%Q
or, equivalently
MOS%Q = 1 ÷ DOLQ
2. The above specification allows managers to see that operating leverage and
margin of sales are functionally related: the greater the relative amount of
Chapter 9 – Short-Term Profit Planning: Cost-Volume-Profit (CVP) Analysis
9-25
9-36 Further Analysis—Degree of Operating Leverage (DOL) (30-45 min)
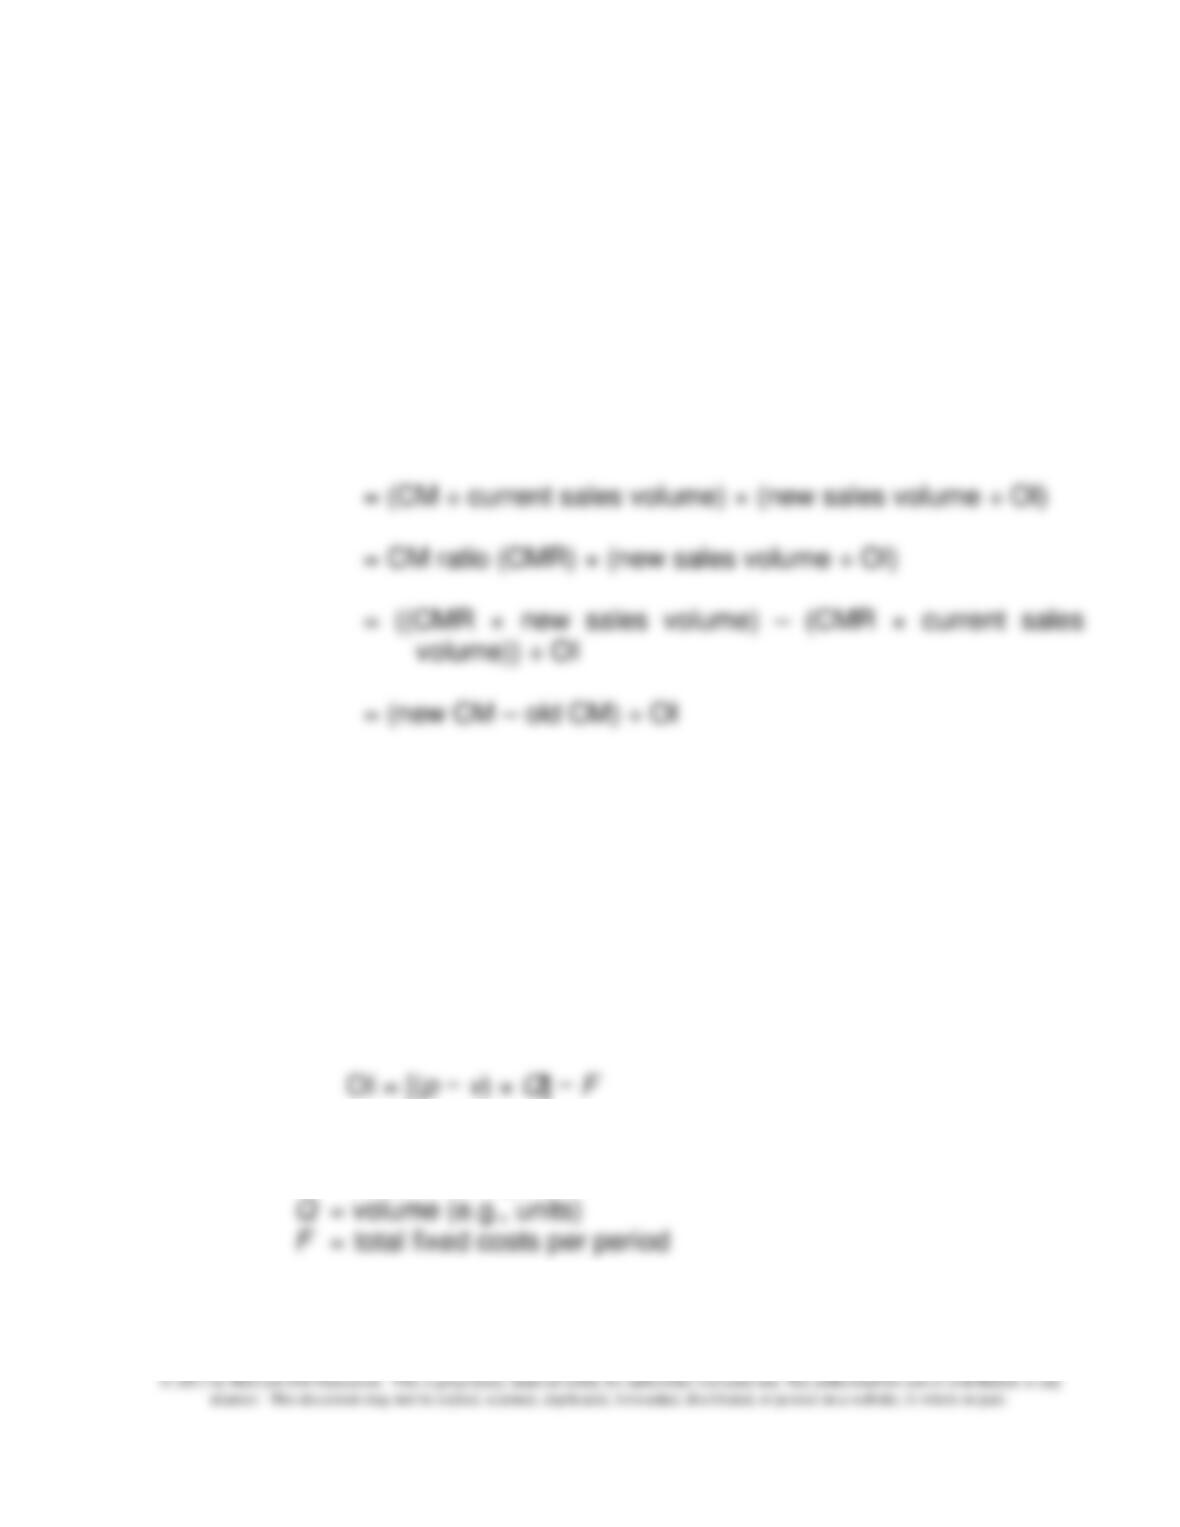
1. Demonstrating that DOL represents the % change in operating income
DOL = CM ÷ Operating Income (OI), for any given sales volume (Q)
New level of OI = DOL × percentage change in sales volume
= (CM ÷ OI) × (new sales volume ÷ current sales volume)
= (∆ in OI) ÷ OI
= percentage change in Operating Income (OI)
2. Relationship between definition of “operating leverage” and the DOL
measure
First, recall the basic profit equation for operating income (OI):
where p = selling price per unit
v = variable cost per unit
Chapter 9 – Short-Term Profit Planning: Cost-Volume-Profit (CVP) Analysis
9-26
9-36 (Continued)
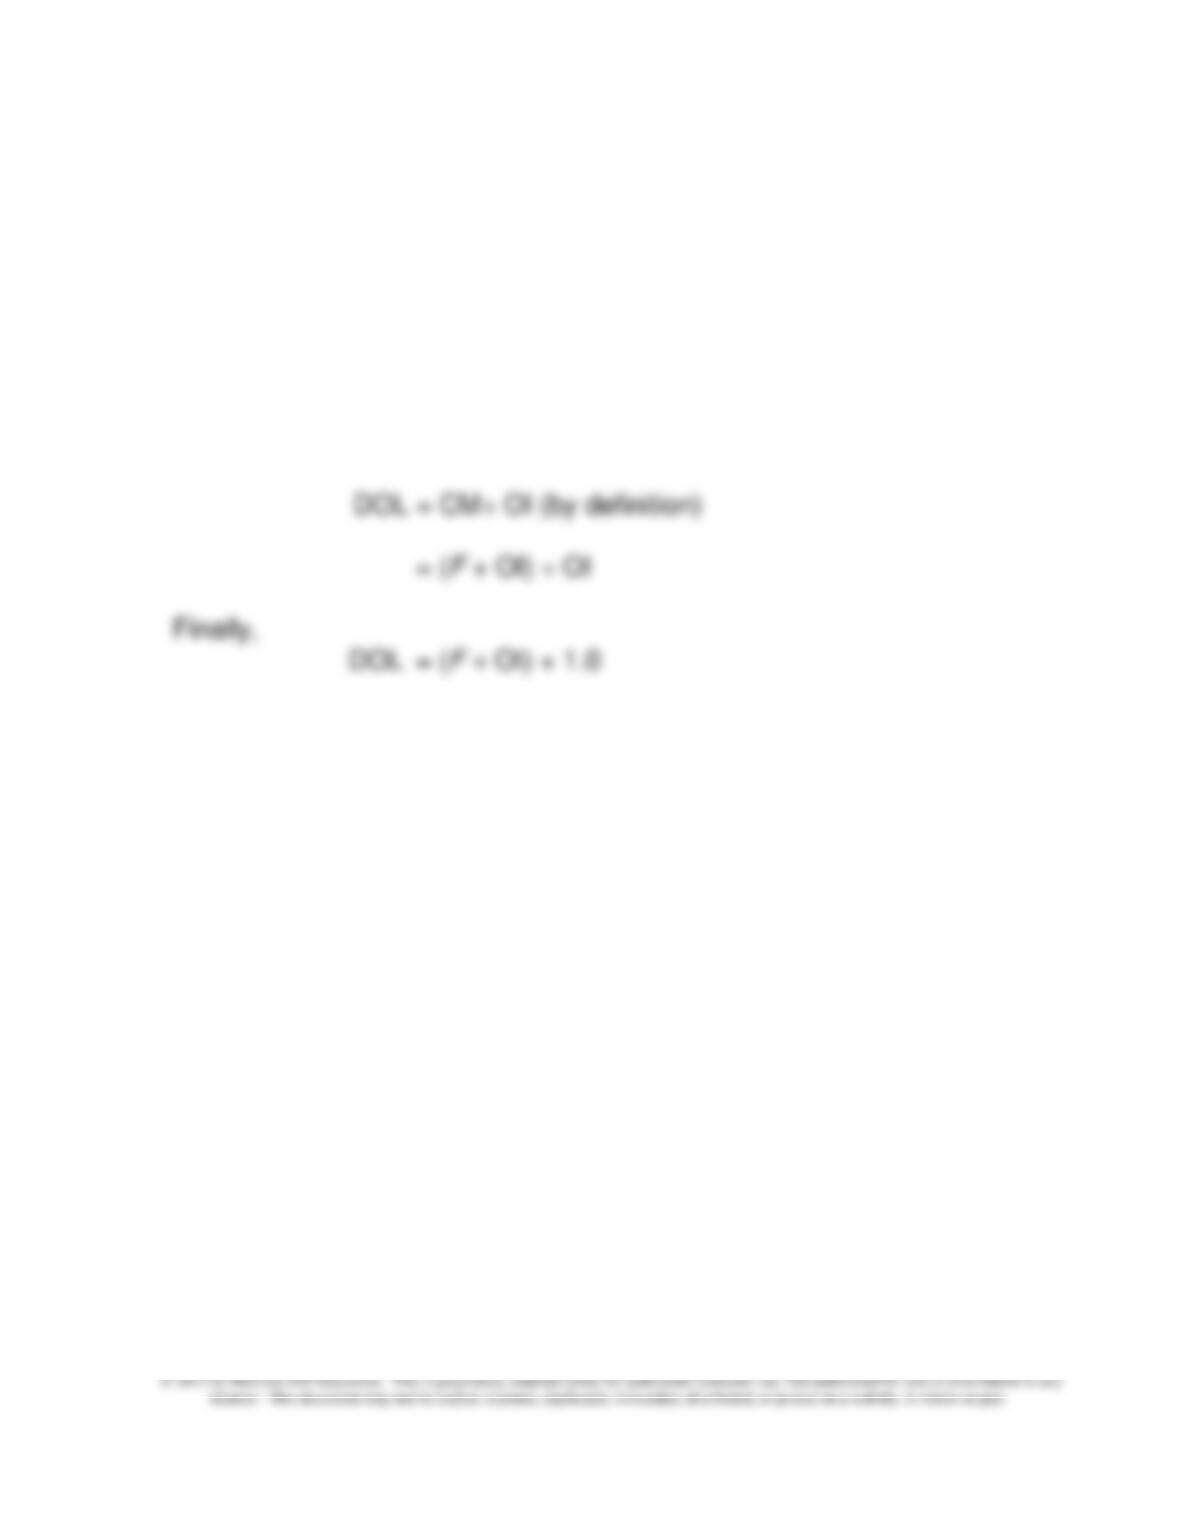
Second, we can rewrite the above as (where CM = total contribution
margin):
F + OI = (p – v) × Q
= CM
Third,
The advantage of the above specification is that we can more readily see
how sensitivity of operating profit is affected by the amount of FC in the
organization’s cost structure, that is, by the amount of “operating leverage.”
Chapter 9 – Short-Term Profit Planning: Cost-Volume-Profit (CVP) Analysis
PROBLEMS
9-37 CVP Analysis; Strategy (45-50 min)
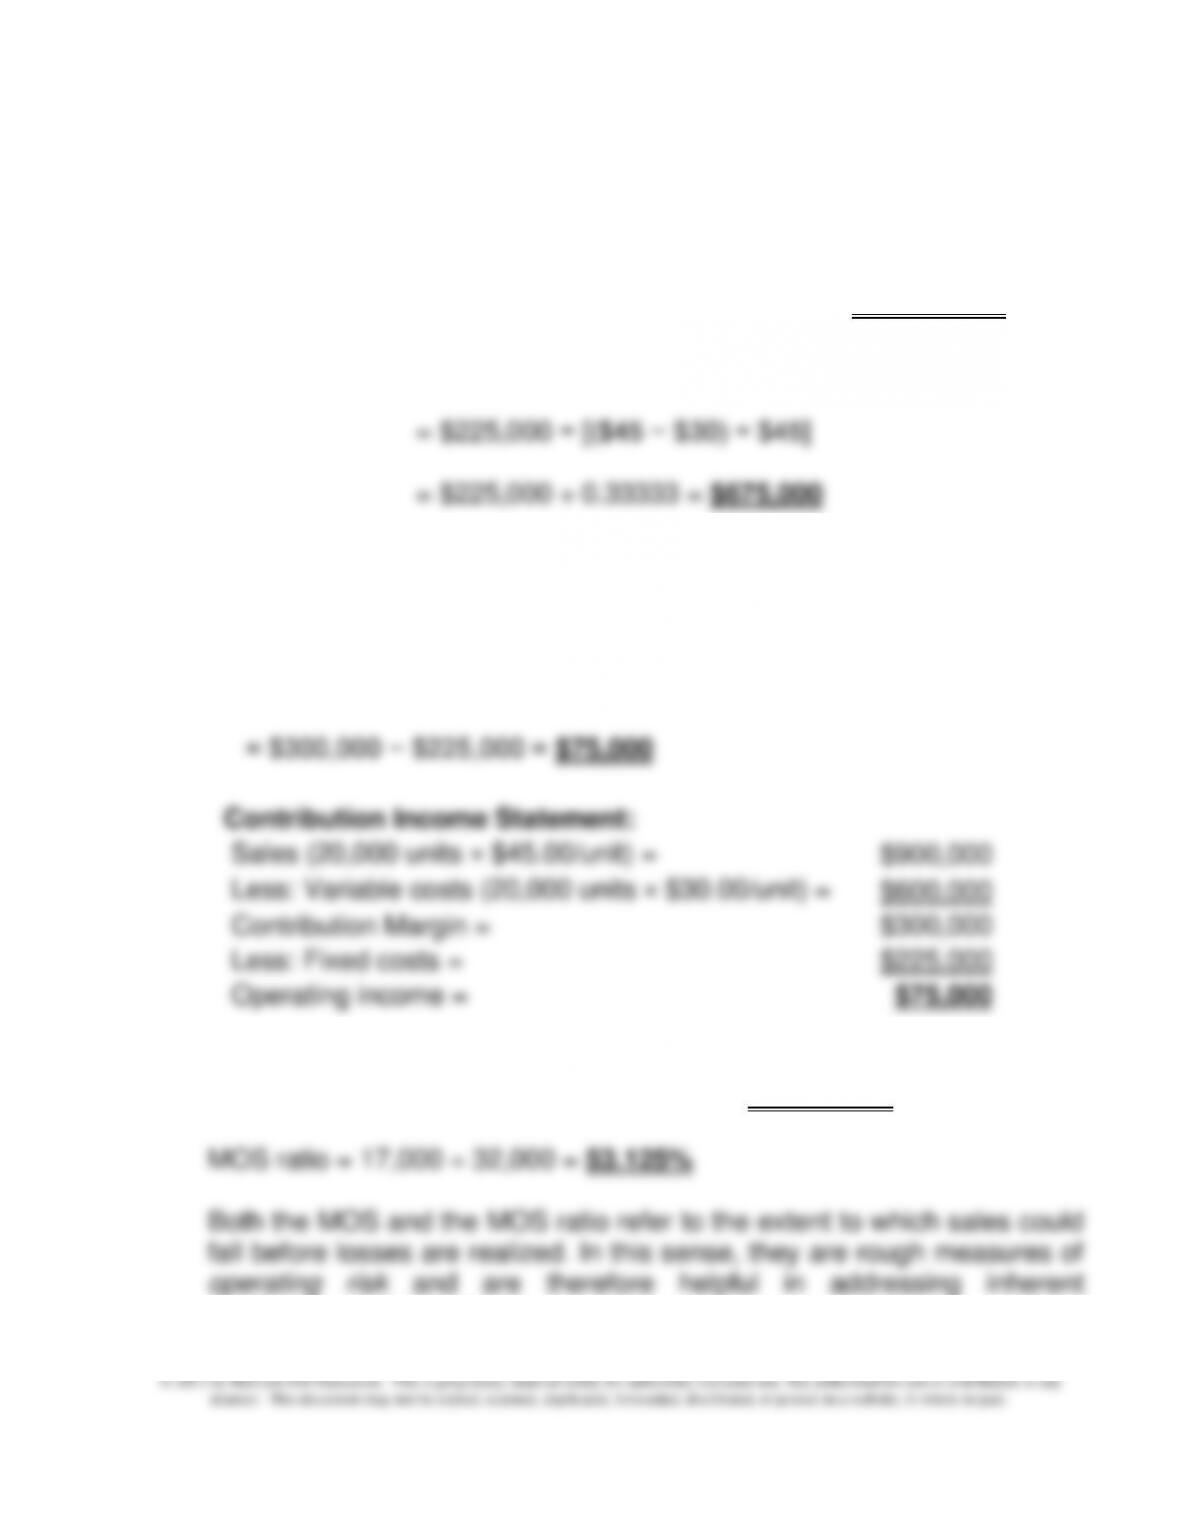
1. BE units = F ÷ (p − v) = $225,000 ÷ ($45 − $30)/unit = 15,000 units
BE $ = F ÷ CMR = F ÷ [(p − v) ÷ p]
2. πB= Sales − variable costs − fixed costs
= [Q × (unit contribution margin)] − F
= [20,000 units × ($45 − $30)/unit] − $225,000
Chapter 9 – Short-Term Profit Planning: Cost-Volume-Profit (CVP) Analysis
9-28
9-37(Continued-1)
4. BE units = F ÷ contribution margin per unit
= ($225,000 + $106,500) ÷ ($45 − $25.50)
= $331,500 ÷ $19.50/unit = 17,000 units
πB= Sales − variable costs − fixed costs
*$30.00 − $4.50
5. A key strategic issue is that Hank’s sales staff is a critical success factor
for the business, especially in the growing and competitive environment
of Hank’s business. His knowledgeable and courteous staff help to bring
loyalty to him in prior years, and how the decision will affect their families,
for better or worse?
Finally, there is the issue of operating risk associated with moving to a
cost structure characterized by relatively higher fixed costs (traded-off
against lower variable costs).
Chapter 9 – Short-Term Profit Planning: Cost-Volume-Profit (CVP) Analysis
9-29
• Possible benefits:
their effect on operating income.
9-37 (Continued-2)
• Possible costs/disadvantages:
o Increased operating (business) risk (e.g., generally speaking,
there will be a higher breakeven point)
o If sales volume recedes, these reductions are magnified in terms
o Increased fixed costs (e.g., those associated with insourcing)
may expose the company to increased risk or exposure to
production slow-downs or stoppages, as experienced in 2011 in
Japan as a consequence of the earthquake/tsunami that hit the
country).
Chapter 9 – Short-Term Profit Planning: Cost-Volume-Profit (CVP) Analysis
9-30
There are two additional points worth making to students:
1. Ultimately, the decision to increase operating leverage is affected by
some of the following considerations: year-to-year fluctuations in sales—
that is, uncertainty (the greater the uncertainty, the greater the
maker’s/owner’s attitude toward risk.
2. Without knowing the future, it is impossible to specify which of the two