
Chapter 9 – Short-Term Profit Planning: Cost-Volume-Profit (CVP) Analysis
9–1
Chapter 9
Short-Term Profit Planning: Cost-Volume-Profit (CVP) Analysis
Teaching Notes for Cases
Case 9-1: CVP Analysis; Strategy
This problem can perhaps be visualized most easily by first constructing a table that shows the effects on
pre-tax income of the various alternatives.
Prior Year Keep Old Use New Purchase
& Budgeted Carrier Carrier Trucks
Sales $1,500,000 $1,500,000 $1,430,000 $1,430,000
Shipping Costs 135,000 (a) 147,150 (b) 122,909 (c) 109,395
Other Variable Costs 1,095,000 1,095,000 1,043,900 1,043,900
Contribution Margin $270,000 $257,850 $263,191 $276,705
Fixed Costs 150,000 150,000 150,000 ?
Pre-Tax Income $120,000 $107,850 $113,191 ?
(a) [0.09 × $1,500,000 × 1.1 × 0.9] + [0.09 × $1,500,000 × 0.10]
(b) [0.09 × $1,430,000 × 0.95 × 0.9] + [0.09 × $1,430,000 × 0.10]
(c) 0.09 × $1,430,000 × 0.85
1. Using the breakeven equation:
Sales = Variable costs + Fixed cost + Required Income
$1,430,000 = [$109,395 + $1,043,900] + [X + $2,000 + $150,000] + $120,000
X = $4,705
where X is annual fixed cost of the truck in the form of depreciation. Total cost is 10 × $4,705 =
$47,050.
2. Again we use the breakeven equation, substituting for required income the expected income using the
new carrier (computed previously).
$1,430,000 = [$109,395 + $1,043,900] + [X + $2,000 + $150,000] + $113,191
X = $11,514
Allowable cost = 10 × $11,514 = $115,140
= [($120,000 − $113,191) × (10)] + $47,050
Chapter 9 – Short-Term Profit Planning: Cost-Volume-Profit (CVP) Analysis
9–2
3. Based on Mr. Carter’s decision, it is evident that the trucks could not be purchased for $115,000, much
less for $47,000. Using a new carrier was the economically advisable decision. Unfortunately it appears
that another variable, carrier reliability, was not taken into account. Possibly the best decision was to keep
using the old carrier. The so-called “safety margin” can be computed as follows:
SALES = VC + FC + πB
$1,400,978] or approximately $29,000 before the decision could have been regarded as incorrect.
4. Simmons is best characterized as a differentiator because of its emphasis on service and on-time
delivery. However, the fact that the increase in shipping rates would mean that Carter would not meet his
better service by buying his own trucks and insourcing the shipping function.
5. Value chain analysis is useful for identifying the critical value-adding activities in the firm, and for
analyzing the effect of these activities upstream and downstream in the firm. For example, the value chain
can be used by Carter to help determine whether insourcing the shipping function might have the effect of
Chapter 9 – Short-Term Profit Planning: Cost-Volume-Profit (CVP) Analysis
9–3
Case 9-2: CVP Analysis; Review of Cost Estimation
1. Note that the data for competitor 9 must be discarded as it represents a partial year and is therefore not
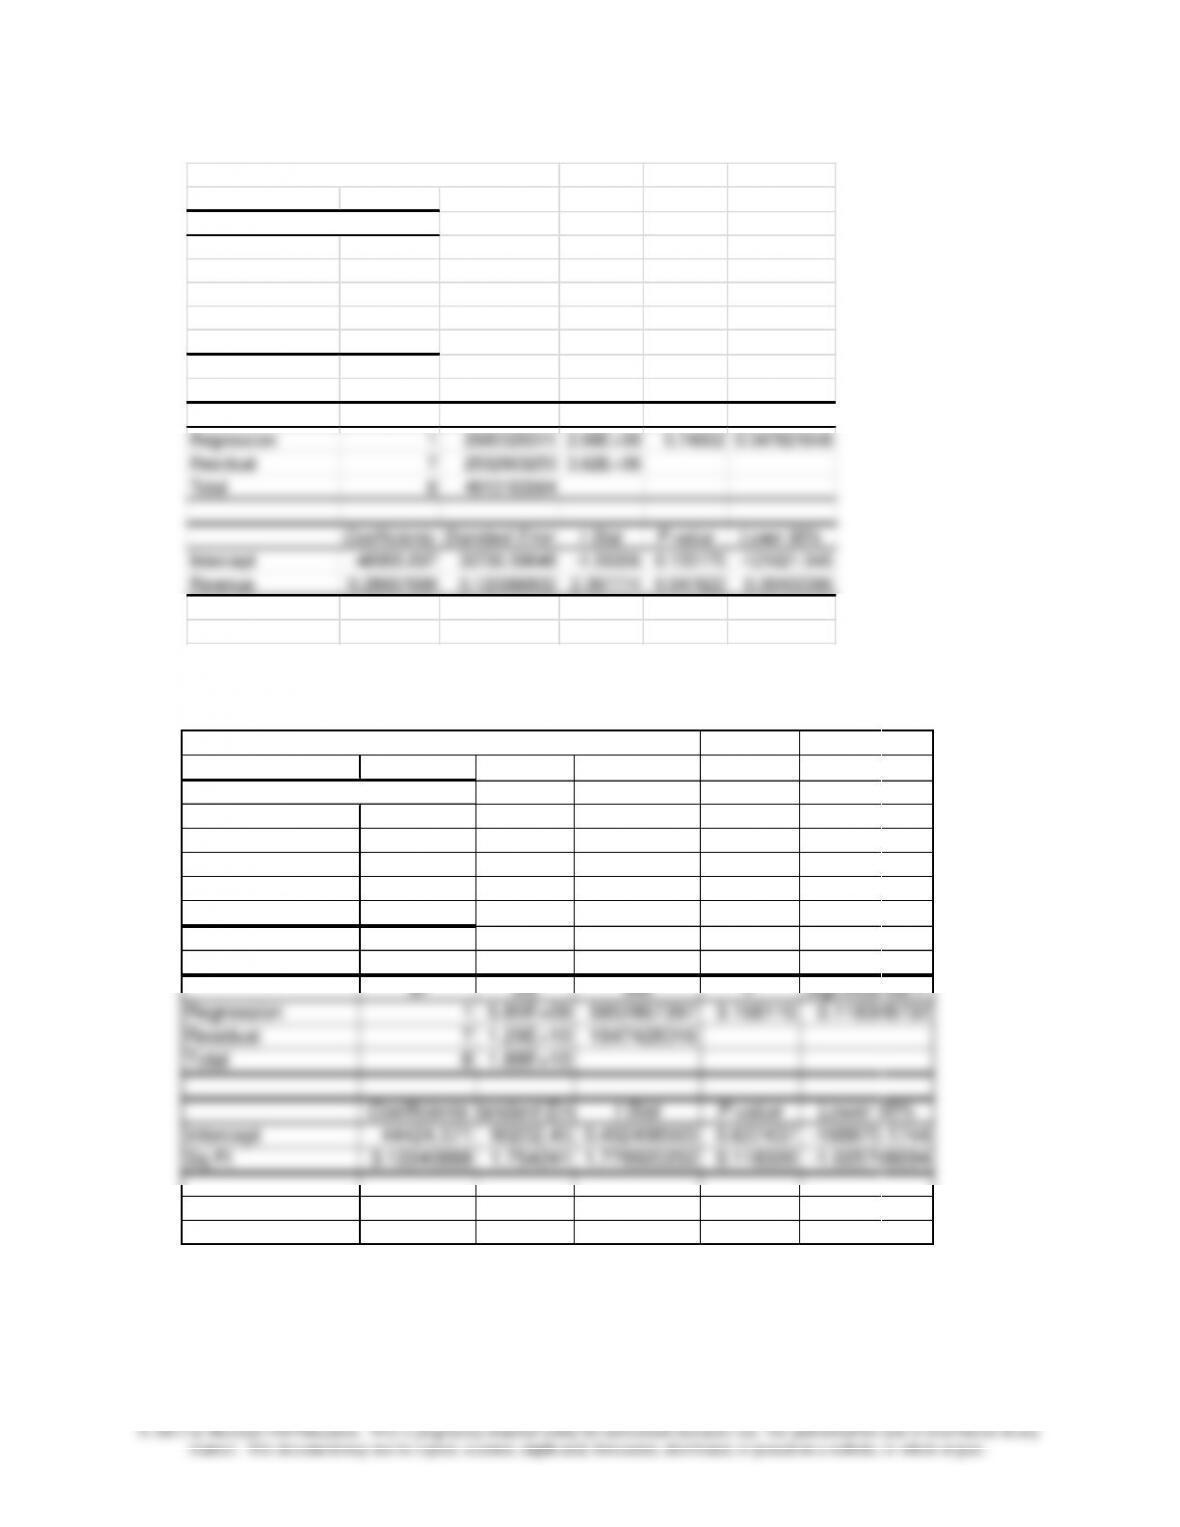
comparable with the remaining data. For the first question, a regression on net income (dependent
variable) against total revenue (independent variable) is shown in Exhibit 1:
The regression equation is:
÷ 0.289) to breakeven.
2. Regress casino revenues (dependent variable) against square footage of casino space (independent
variable).The resulting equation is shown in Exhibit 2.
Revenue = $4,424,571 + $3,122 per square foot
The R2 for the above equation is 0.31, the standard error of the estimate is $42,982,721 and the t-value is
1.7. This is not a particularly good fit. Part of the problem may arise from using 19X4 revenues and 19X5
revenue predictions.
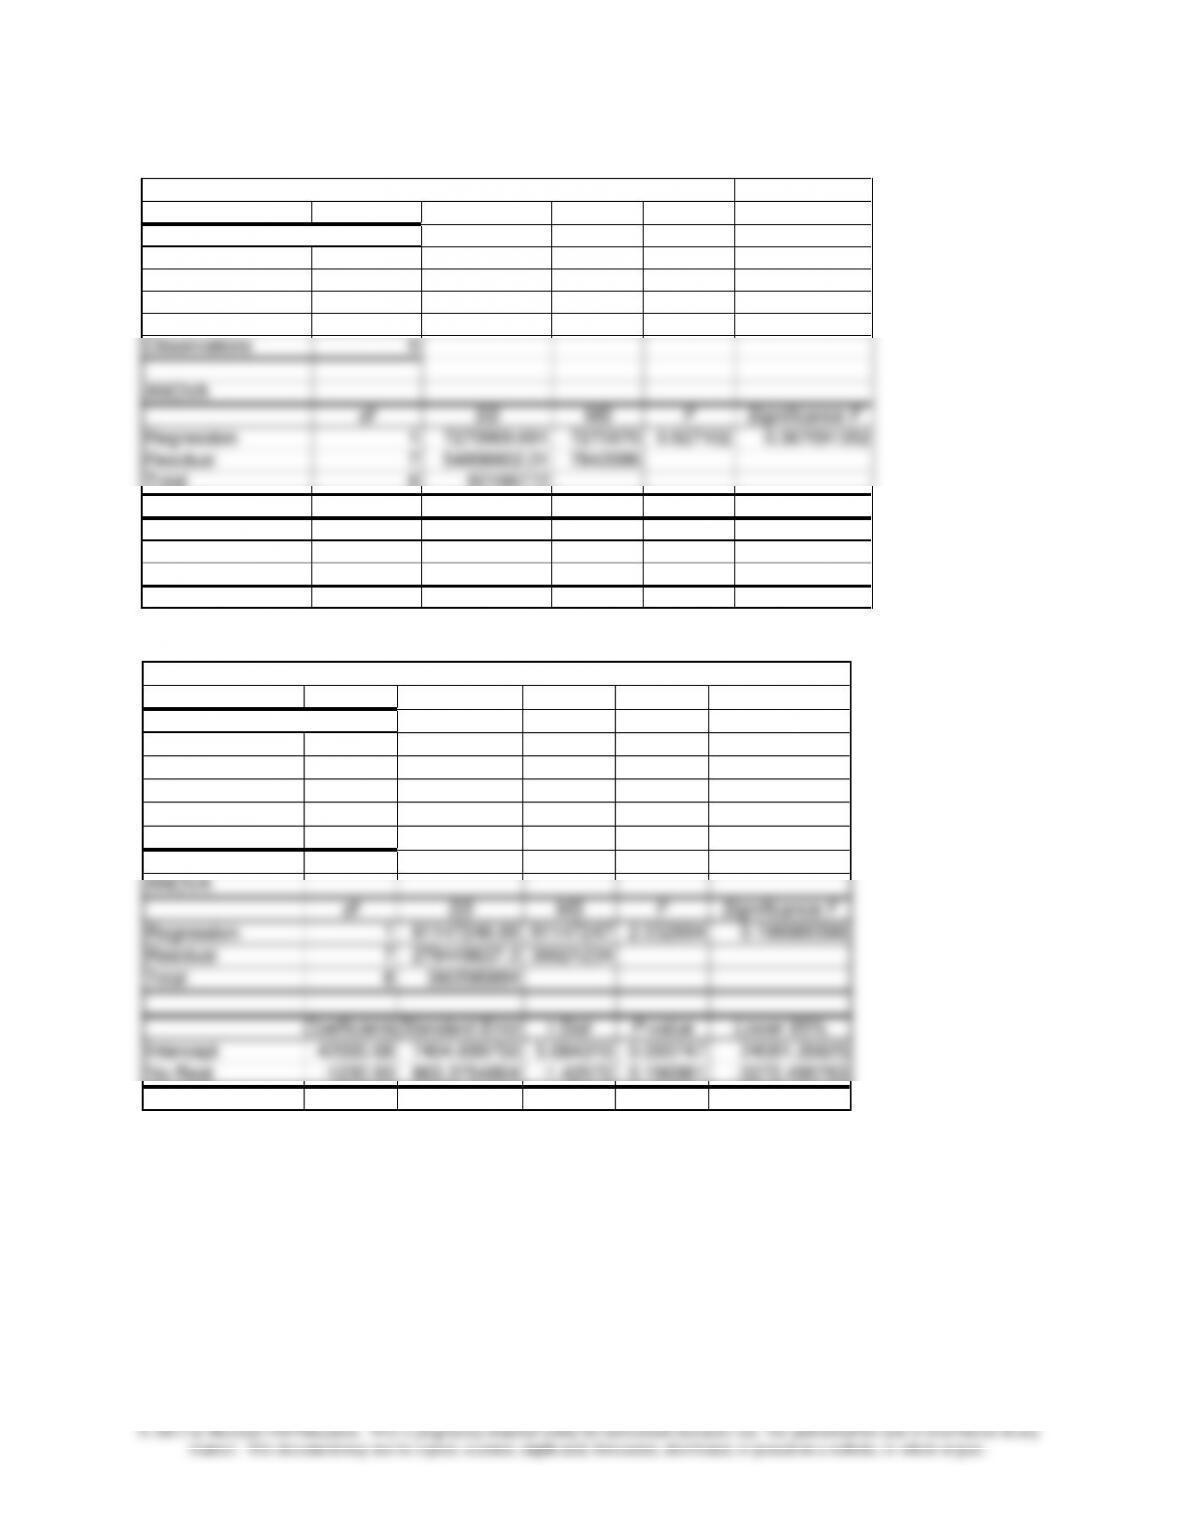
3. The results are shown below. The fit of both models is extremely poor, with R-squared values of less
than 25% and non-significant t-values. This indicates there is not a reliable relationship among these
variables.
Chapter 9 – Short-Term Profit Planning: Cost-Volume-Profit (CVP) Analysis
Regression Using Revenues to Predict Income
Regression Statistics
Multiple R 0.67152894
R Square 0.45095112
Adjusted R Square 0.37251557
Standard Error 19022.0295
Observations 9
ANOVA
df SS MS F
Significance F
Regression 1 2080320311 2.08E+09 5.74932 0.047621648
Residual 7 2532863253 3.62E+08
Total 8 4613183564
Coefficients Standard Error t Stat P-value Lower 95%
Intercept -48955.697 30730.59048 -1.59306 0.155175 –121621.945
Revenue 0.28937999 0.120686932 2.397774 0.047622 0.00400095
Regression Using Square Feet to Predict Casino Revenues
Regression Statistics
Multiple R 0.55818774
R Square 0.31157356
Adjusted R Square 0.21322692
Standard Error 42981.7207
Observations 9
ANOVA
df SS MS F Significance F
Regression 1 5.85E+09 5852867397 3.168116 0.118308732
Residual 7 1.29E+10 1847428316
Total 8 1.88E+10
Coefficients
tandard Error
t Stat P-value Lower 95%
Intercept 44424.571 90202.45 0.492498503 0.637437 -168870.1744
Sq Ft 3.12240888 1.754241 1.779920252 0.118309 -1.025708694
Chapter 9 – Short-Term Profit Planning: Cost-Volume-Profit (CVP) Analysis
9–5
Regression Using Number of Rooms to Predict Room Revenue
Regression Statistics
Multiple R 0.34198458
R Square 0.11695346
Adjusted R Square -0.0091961
Standard Error 2800.47961
Observations 9
ANOVA
df SS MS F Significance F
Regression 1 7270969.691 7270970 0.927102 0.367691352
Residual 7 54898802.31 7842686
Total 8 62169772
Coefficients Standard Error t Stat P-value Lower 95%
Intercept 8987.3477 5536.934271 1.623163 0.148584 -4105.411988
Rooms 9.15857294 9.511829491 0.962861 0.367691 -13.33331366
Regression Using Number of Restaurants to Predict Food and Beverage Revenue
Regression Statistics
Multiple R 0.47438
R Square 0.225037
Adjusted R Square 0.114327
Standard Error 6318.325
Observations 9
ANOVA
df SS MS F Significance F
Regression 1 81147246.68 81147247 2.032684 0.196980598
Residual 7 279448637.3 39921234
Total 8 360595884
Coefficients
Standard Error
t Stat P-value Lower 95%
Intercept 42090.68 7404.699759 5.684319 0.000747 24581.35625
No Rest -1230.93 863.3754864 -1.42572 0.196981 -3272.490763
Chapter 9 – Short-Term Profit Planning: Cost-Volume-Profit (CVP) Analysis
9–6
Case 9-3: CVP Analysis; Service (Hospital); Strategy
1. The strategic role of CVP Analysis for Melford Hospital is to provide a basis for understanding
the relationships between costs, revenues, profits and the level of output for the hospital’s
services. In this case, the hospital needs to be able to analyze the alternative uses of its space for
rental. Will the space be more profitably used by activities within the hospital? What is the proper
rental charge? How should the rental charge change if the level of expected usage increases
significantly? These are questions that the hospital can best answer using CVP analysis.
Similarly, entities such as a psychiatric unit or a pediatric unit which want to rent space from the
hospital can use CVP analysis to assess the potential profitability of doing so, given different
assumptions of expected activity.
2. The breakeven point is determined as follows:
Total Fixed costs:
Melford Hospital charges $2,900,000
Supervising nurses ($25,000 × 4) 100,000
Nurses ($20,000 × 10) 200,000
Aides ($9,000 × 20) 180,000
Total fixed costs $3,380,000
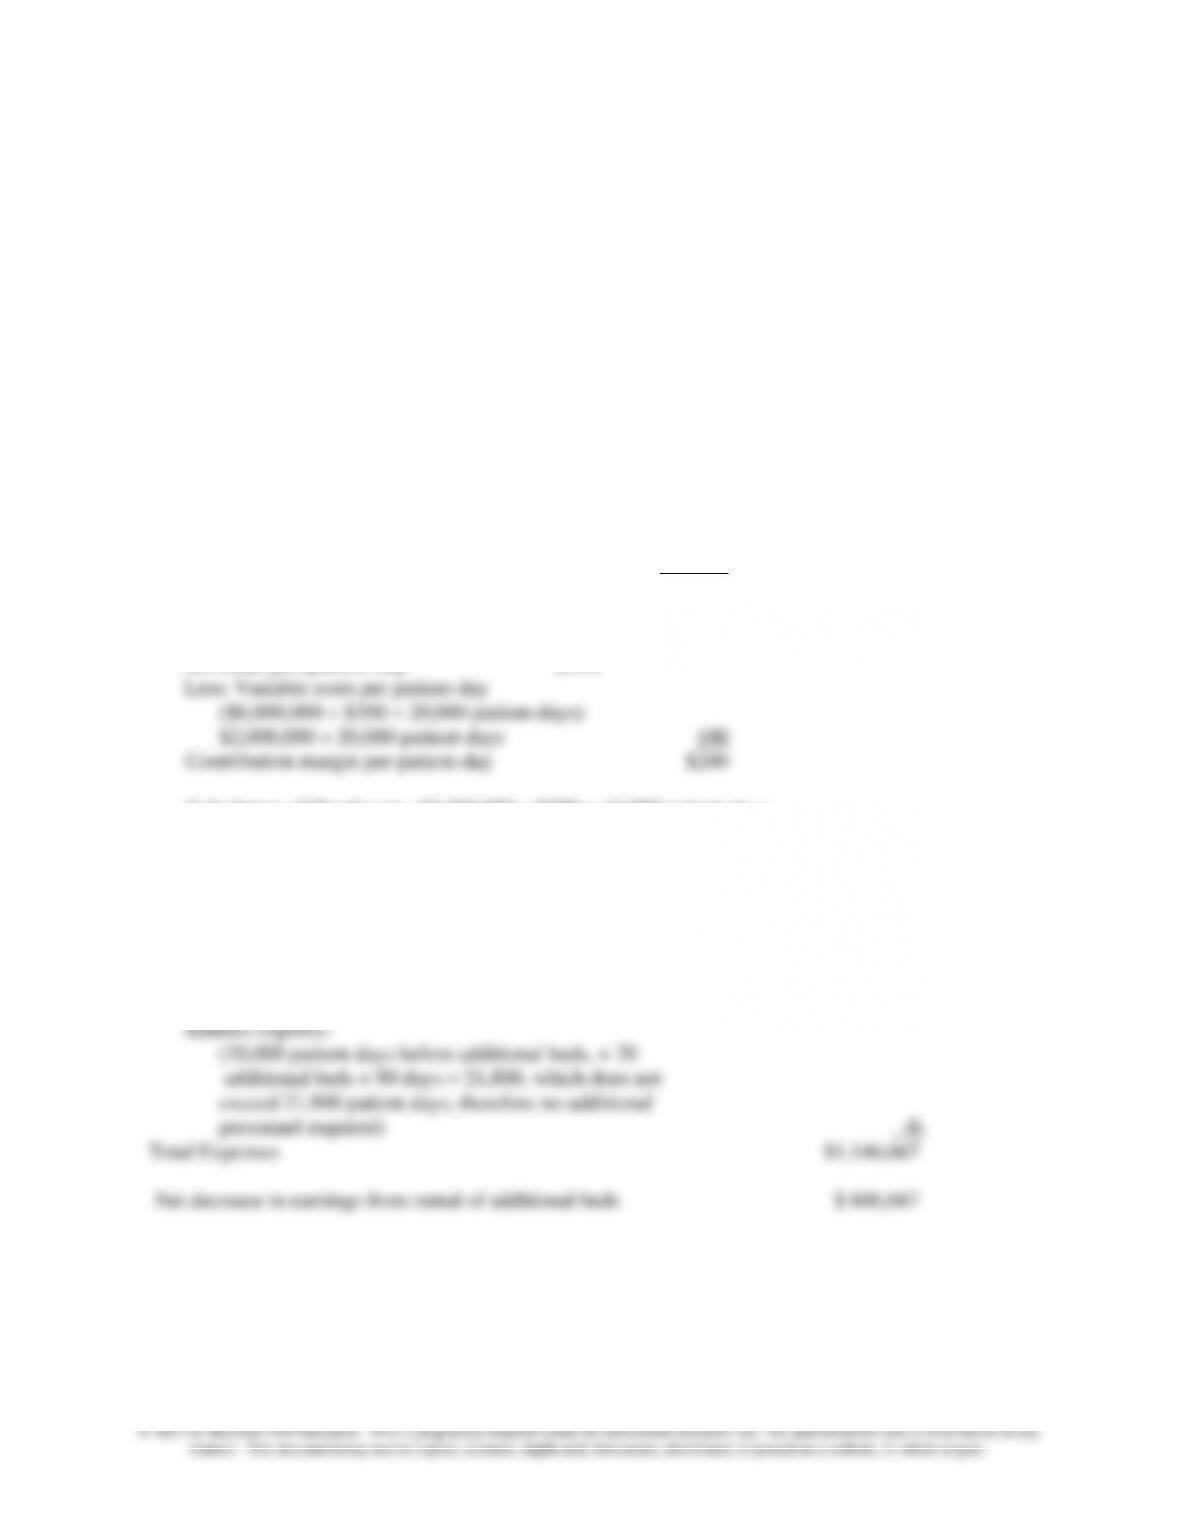
Contribution margin per patient-day:
Revenue per patient day $300
Calculation of Breakeven: $3,380,000 ÷ $200 = 16,900 patient-days
3. Calculation of Loss from Rental of Additional 20 Beds
Increase in revenue (20 additional beds × 90 days × $300 /day) $540,000
Increase in expenses:
Variable expense by Melford Hospital
(20 additional beds × 90 days × $100/day) 180,000
Fixed charges by Melford Hospital
($2,900,000 ÷ 60 beds = $48,333 per bed × 20 beds) 966,667
Chapter 9 – Short-Term Profit Planning: Cost-Volume-Profit (CVP) Analysis
9–7
Case 9-4: ALLTEL Pavilion
1. The best description of the strategy of an entertainment business such as the ALLTEL Pavilion is
differentiation. The mission statement includes: “a concert… it’s better live.” A live concert is certainly
not the least expensive entertainment. What brings a customer to the ALLTEL Pavilion is top name acts
and the experience of enjoying previous shows. The Pavilion knows that and strives to make every
customer’s experience a pleasant one.
Some students may argue that the Pavilion employs both differentiation and low price strategies –
the differentiation strategy for nationally well-known performers and low price for local or regional
each show, the Pavilion considers fundamentally who the customers are, how the show will entertain
these customers, and how to market the show.
2. The determination of the breakeven point is not straight-forward. It requires the student to understand
how both types of customers contribute to the Pavilion’s profits – the paying ticket holders and the comp
ticket holders. To determine the breakeven point:
Since there are many different types of tickets, the best approach is to use total revenues and total variable
costs, rather than to use per capita figures. This means using the contribution margin ratio or the variable
cost ratio. First determine total variable costs and total fixed costs as follows.
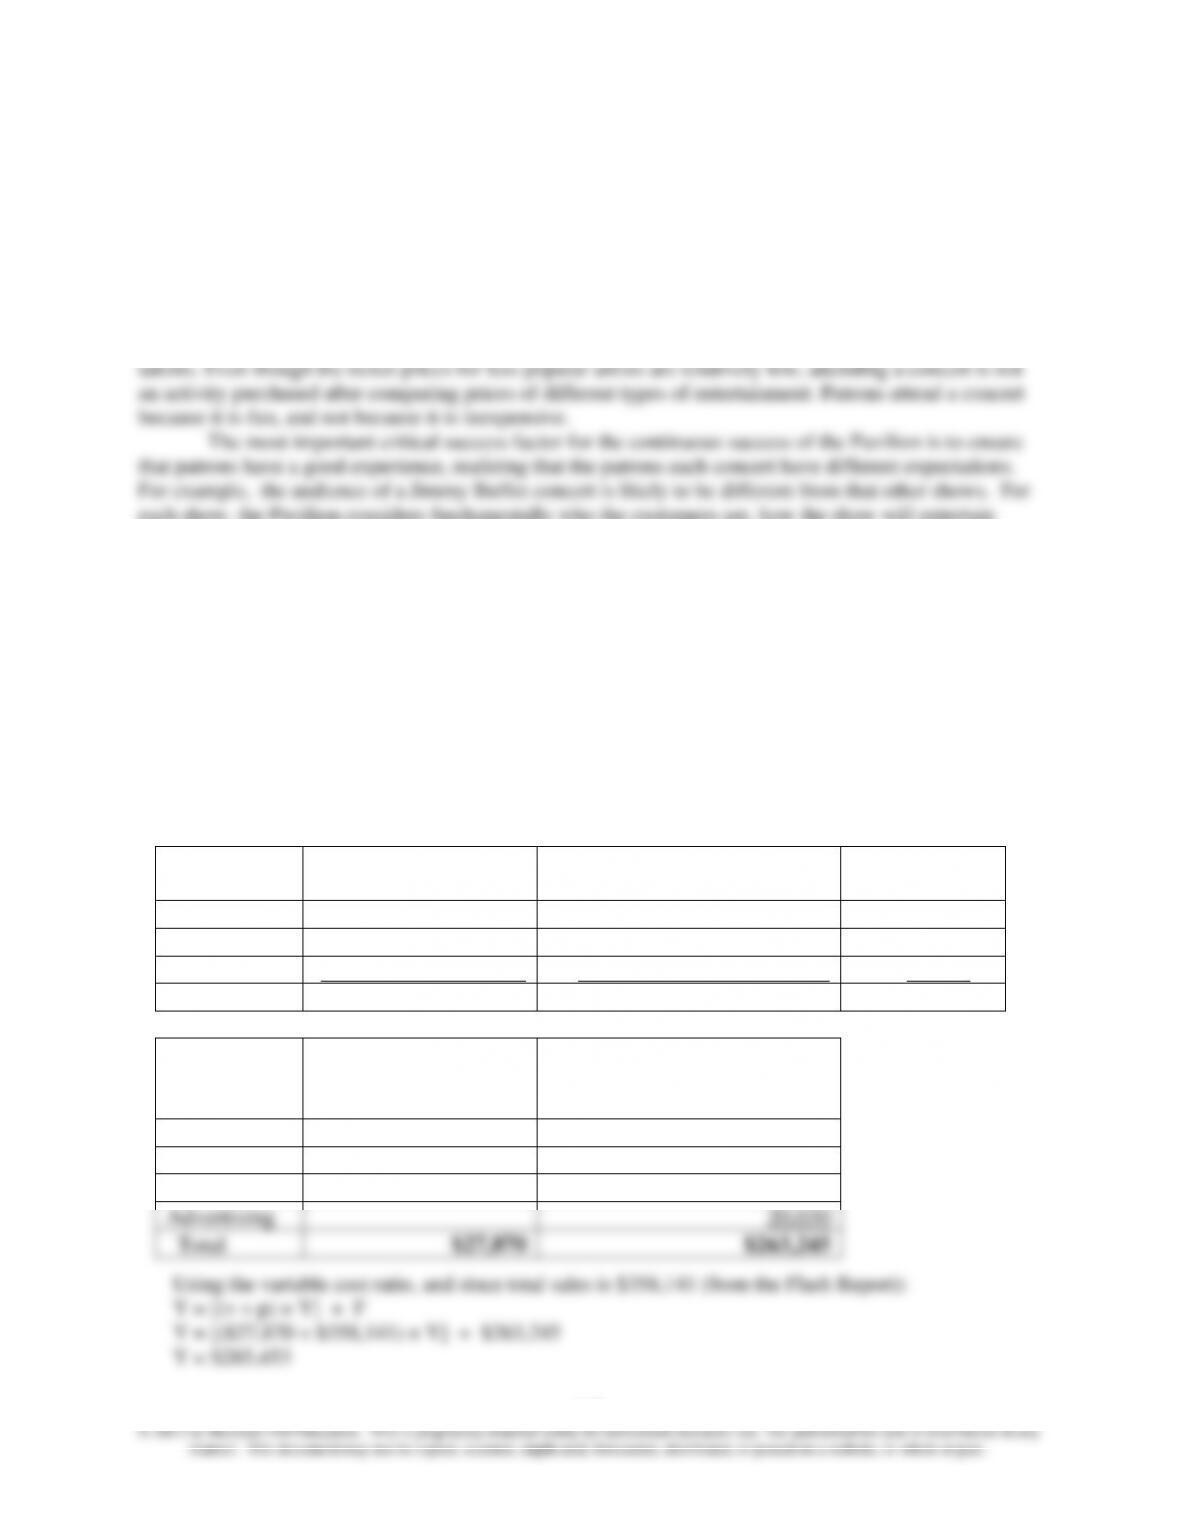
Begin by separating parking, concession and merchandise costs into their variable (10% of revenue) and
fixed components:
Variable
Fixed
Total (from
Flash Report)
Parking
0.1 × 19,767 = $1,977
$4,448 − $1,977 = $2,471
$4,448
Concession
0.1 × 79,273 = $7,927
$43,356 − 7,927 = $35,429
43,356
Merchandise
0.1 × 36,428 = $3,643
$17,826 − 3,643 = $14,183
17,826
Total
$13,547
$52,083
$65,630
Then add other variable and fixed costs
Other
variable
costs
$14,323
Guarantee
$160,635
Production
15,506
Operations
14,991
Advertising
20,030
Total
$27,870
$263,245
Using the variable cost ratio, and since total sales is $358,141 (from the Flash Report):
Y = [(v ÷ p) × Y] + F
Y = [($27,870 ÷ $358,141) × Y] + $263,245
Y = $285,453
Chapter 9 – Short-Term Profit Planning: Cost-Volume-Profit (CVP) Analysis
9–8
© 2013 by McGraw-Hill Education. This is proprietary material solely for authorized instructor use. Not authorized for sale or distribution in any
manner. This document may not be copied, scanned, duplicated, forwarded, distributed, or posted on a website, in whole or part.
This is approximately $285,453 ÷ ($26.99 + 1.91 + 7.66 + 3.52 = $40.08) = 7,122 ticket holders, at
the $26.99 average per capita revenue from ticketing and assuming the per capita revenues for
parking, concessions, and merchandise
Alternatively,
The above approach ignores the contribution of “comp” tickets and uses only paying ticket holders.
However, comp patrons should not be ignored because the also pay for parking and buy food and
merchandise. Thus, a preferred approach would be to include directly in the analysis the fact that
“comp” ticket holders will pay for parking, food, and merchandise, as follows:
a) The contribution per paying customer is $37.03 = $42.08-$3.049
b) The contribution for each comp customer is $10.04 = $13.09 – $3.049, where $13.09 = $1.91 +
7.66 + 3.52
Assumptions and Discussion Points
The above analyses assumes a constant purchase mix of ticket types, as set out in Exhibit A. Also, there
are a number of other key assumptions.
1. Our solution assumes that the $1.74 of other variable expense applied to both paying ticket
holders and comp ticket holders. That is, the COGS for the concessions and insurance are applicable to
each customer, whether paying or not. Some students will note that the Flash Report provided to me by
Alltel Pavilion staff is inconsistent with this because it shows project variables expense of $1.74 × 8,251
= $14,323. The Alltel staffs’ calculation seems to imply that only paying customers cause these costs. I
decided to leave this discrepancy in the case to add some realism—I can add it to the class discussion and
use it to reinforce the importance of accuracy and consistency; depending on my goals for the class I
might correct this number in the case and replace the $14,323 with the correct calculation of $1.74 ×
10,349 = $18,007.
Note there are also embedded inconsistencies in other parts of the Flash Report, for example the
total admissions of $182,479 does not agree with the number of seats and seat prices, and also the drop
count of 10,349 does not exactly equal the number of paying ticket holders + 25%. Some students will
observe these discrepancies.
2. In my experience with the case, a number of students will assume the costs provided in the
Flash Report for the ancillaries (parking, food, and merchandise) are fixed costs only. I remind them of

Chapter 9 – Short-Term Profit Planning: Cost-Volume-Profit (CVP) Analysis
9–9
the case information that states that the concession contractors are paid on a basis of both a fixed fee and a
percentage of revenue (and therefore a variable cost). After a question or two the class seems to then
understand this point.
3. Relatively few students attempt to account for the ancillary revenues from the comp ticket
holders in their initial analysis. I allow plenty of time to explain this point.
4. Some students fail to see that the revenue per ticket includes both ticket price (average of
$22.12) and other payments to Alltel Pavilion based on tickets sold (facility charge and S/C rebates), so
that the relevant figure to use is $26.99 per paying ticket holder.
I show this in class as follows:
Ticket price $22.12
Facility charge 2.91
Rebates 1.96
Total revenue per paying ticket holder $26.99
Note that the $17.63 per ticket holder calculated in the flash report just above the facilities charges is in
error; it is apparently calculated from the total admissions of $182,479 (a correct number) by the drop
count of 10,349. This is wrong because the drop count includes comp tickets. The correct calculation is
$182,479 ÷ 8,251 = $22.12 which is shown near the top of the flash report. The $17.63 calculation was
included in the original case provided to me by Alltel Pavilion staff. I decided to leave this discrepancy in
the case to add some realism; depending on my goals for the class I might correct this number in the case
and replace the $17.63 with $22.12.
Also, note that the fact there are extensive key assumptions and a significant amount of uncertainty
involved in the case, the calculation of a breakeven point must be accompanied by a caution regarding
these uncertainties. It also argues for an explicit sensitivity analysis, as described in the answer to
question 4 below.
3. This question explores the relevance of operating leverage for the Alltel Pavilion. The breakeven
analysis is likely to be more important for a fixed fee type of performer because the fixed costs (performer
fee included) will be larger, and the risk of loss from poor attendance is greater. For this reason, including
the greater difficulty in attracting fans to the relatively weaker fixed-pay performers, the per-capita artists
are likely to be preferred.
We can also look at this question from both the Pavilion’s and the Performer’s point of view:
From the Pavilion’s Point of View:
For the more popular performers for whom we expect to fill all the seats, the Pavilion would
prefer to have a fixed pay contract, to take advantage of operating leverage–the profits to the Pavilion
would be relatively high if variable costs are low (i.e., with a fixed rather than a per capita contract) and
volume is high. In contrast, for the relatively unknown performer for who the attendance is substantially
in doubt, a per capital contract would be preferable. The performer in this case shares the risk, and the
Pavilion’s relatively low operating leverage protects it from relatively higher losses.
From the Performer’s Point of View:
The popular performer is likely to be able to insist on the type of contract that is preferable the
them, presumably either a per capita type of contract or a fixed pay contract that has a very high fixed pay
amount (the performer might calculate what the Pavilion might earn from the contract based on their

Chapter 9 – Short-Term Profit Planning: Cost-Volume-Profit (CVP) Analysis
9–10
knowledge of the cost structures of Pavilions generally, and use this to negotiate with the Alltel Pavilion).
The Pavilion is likely to prefer a per capita contract with this type of performer because of the relatively
higher risk for a high fixed pay contract.
The unknown performer, in contrast, is likely to prefer a fixed pay contract to guarantee a small
or modest pay, irrespective of attendance. The Alltel Pavilion would then need to take care to make sure
that the
The Alltel Experience
Driven in part by the performer’s preferences, the Alltel Pavilion’s contracts tend to be per capita
for the most popular performers and fixed pay for the less popular performers.
4. Sensitivity analysis could be used to evaluate the risk of a potential loss on the KFBS Allstars event.
Some of the methods that might be used include spreadsheet modeling, including graphical analysis to
depict the change profits as attendance levels change and the use of spreadsheet analysis tools such as
Crystal Ball in which the user can make certain aspects of the uncertainty of the situation explicit and then
see how these risk assessments affect overall profitability.
An example of a spreadsheet model for Alltel Pavilion is shown in Exhibit TN-1. If there is sufficient
class time, I demonstrate this spreadsheet for the class at the end of the class discussion, to illustrate the
simplicity and ease of analysis. I will usually take a selection of three or four different values for
projected attendance and show the changes effect projected profit. Note that the projected profit in the
spreadsheet differs from that in the flash report for an attendance of 8,251 because of the difference in the
handing of other variable expenses as explained above and due to a certain amount of rounding error.
A Simulation Model of Alltel Pavilion’s Profit: Crystal Ball
As a further extension of the sensitivity analysis shown in the spreadsheet (Exhibit TN-1), and
again, if I have sufficient class time, I will demonstrate the use of the Excel Add-in Crystal Ball to
analyze the uncertainty in the case. Crystal Ball was recently acquired by Oracle, Inc., and is available for
site license; it is an easy to use tool for developing a probabilistic simulation of a planning context such as
for the Alltel Pavilion case. See the advanced lecture notes in Chapter 9 of the Instructor’s Resource
Guide for more information about Crystal Ball.
Note: As of March 2008, the Alltel Pavilion has been renamed, and is now called the Time Warner
Cable Music Pavilion at Walnut Creek.

Chapter 9 – Short-Term Profit Planning: Cost-Volume-Profit (CVP) Analysis
9–11
TN-1: Example of Spreadsheet Solution for Alltel Case
Alltel Pavilion
EXPECTED PAYING ATTENDANCE
8,251
GIVEN
TOTAL REVENUE FROM TICKETING
PER CAPITA
$ 26.99
GIVEN
TOTAL REVENUE FROM
ANCILLARIES PER CAPITA
$ 13.09
GIVEN
LESS 10% OF REVENUE
1.31
13.09 × 0.1
LESS VARIABLE EXPENSES
1.74
0.17 + 0.35 + 1.1.2 + 0.08 + 0.02
CONTRIBUTION FROM ANCILLARIES
PER CAPITA
$ 10.04
13.09 − (13.09 × 0.10) − 1.74
CONTRIBUTION MARGIN FOR
PAYING CUSTOMERS
305,535
(26.99 + 10.04) × ATTENDANCE
CONTRIBUTION MARGIN FOR
NONPAYING CUSTOMERS
20,710
10.04 × (0.25 × ATTENDANCE)
TOTAL CONTRIBUTION
$ 326,245
Less: FIXED COSTS
263,247
15,506 + 14,991 + 2,030 + 52,083 +
160,635
PROFIT
$ 62,997.54