Chapter 8 – Cost Estimation
8-1
CHAPTER 8: COST ESTIMATION
QUESTIONS
8-1 Cost estimation is the process of developing a well-defined relationship between
a cost object and its cost driver for the purpose of predicting the cost. The cost
predictions are used in each of the management functions:
Strategic Management: Cost estimation is used to predict costs of alternative
standards, as a basis for evaluating performance.
Product and Service Costing: Cost estimation is used to allocate costs to
products and services or to charge users for jointly incurred costs.
8-2 The strategic role of cost estimation includes:
a. Accurate prediction of future costs using volume-based, activity-based,
8-3 The two methods of cost estimation are:
a. High-Low. Because of the precision in the development of the equation, it
provides a more consistent estimate than the visual fit and is not difficult to use.
the effort, expense, and expertise necessary to utilize this method.
8-4 Implementation problems with cost estimation include:
a. Cost estimates outside of the relevant range may not be reliable.
b. Sufficient and reliable data may not be available.
c. Cost drivers may not be matched to dependent variables properly in each
e. Dependent variables and cost drivers may be affected by trend or seasonality.
f. When extreme observations (outliers) are used the reliability of the results will
be diminished.
8-2
© 2013 by McGraw-Hill Education. This is proprietary material solely for authorized instructor use. Not authorized for sale or distribution in any
manner. This document may not be copied, scanned, duplicated, forwarded, distributed, or posted on a website, in whole or part.
g. When there is a shift in the data, as, for example, a new product is introduced
or when there is a work stoppage, the data will be unreliable for future estimates.
8-5 The six steps in cost estimation are as follows:
a. Define the cost to be estimated.
f. Assess the accuracy of the cost estimate.
Choosing the cost drivers is often the most important step since the model’s
accuracy is based upon selecting the relevant and appropriate cost drivers.
8-6 The contrast between regression analysis and high-low analysis is as follows:
a. Regression analysis estimates the cost function by using a statistical model
that relates the average change in the dependent variables to a unit change in
because it employs a statistical method and uses more data points in the
analysis.
8-7 Cost estimation methods could be used to help identify activity cost drivers in
activity-based costing. For example, if a firm using activity-based costing is
determine which of the cost drivers is a better fit.
8-8 The dependent variable is the cost object of interest in the cost estimation. An
important issue in selecting a dependent variable is the level of aggregation in
the variable. For example, the company, plant, or department may all be
possible levels of data for the cost object. The choice of aggregation level
and do not duplicate other independent variables.
8-3
8-9 Nonlinear cost relationships are cost relationships that are not adequately
explained by a single linear relationship for the cost driver. In accounting data, a
common type of nonlinear relationship is trend and seasonality. For a trend
example, if sales increase by 8% each year, the plot of the data for sales will not
be linear with the driver, the number of years. Similarly, sales which fluctuate
output increases due to greater productivity from learning from experience.
8-10 The advantages of using regression analysis include that it:
a. Provides an estimation model with best fit (least squared error) to the data
e. Results in a model that is unique for a given set of data
8-11 A dummy variable is an independent variable assigned the value of 0 or 1 in the
regression analysis. It can improve the accuracy of the regression analysis if it is
8-12 High correlation exists when the changes in two variables occur together. It is a
measure of the degree of association between the two variables. Because
correlation is determined from a sample of values, there is no assurance that it
8-13 The coefficient of determination (R-squared) measures the degree to which
changes in the dependent variable can be predicted by changes in the
BRIEF EXERCISES
8-15 The R-squared statistic indicates the degree to which changes in the dependent
variable can be predicted by changes in the independent variable. The t-value
8-16
a = Y – (b x X)
OR: a= $3,000 = $6,000 – $1 x 3,000
8-17
Possible independent variables for analysis of financial data include wage rate,
8-18
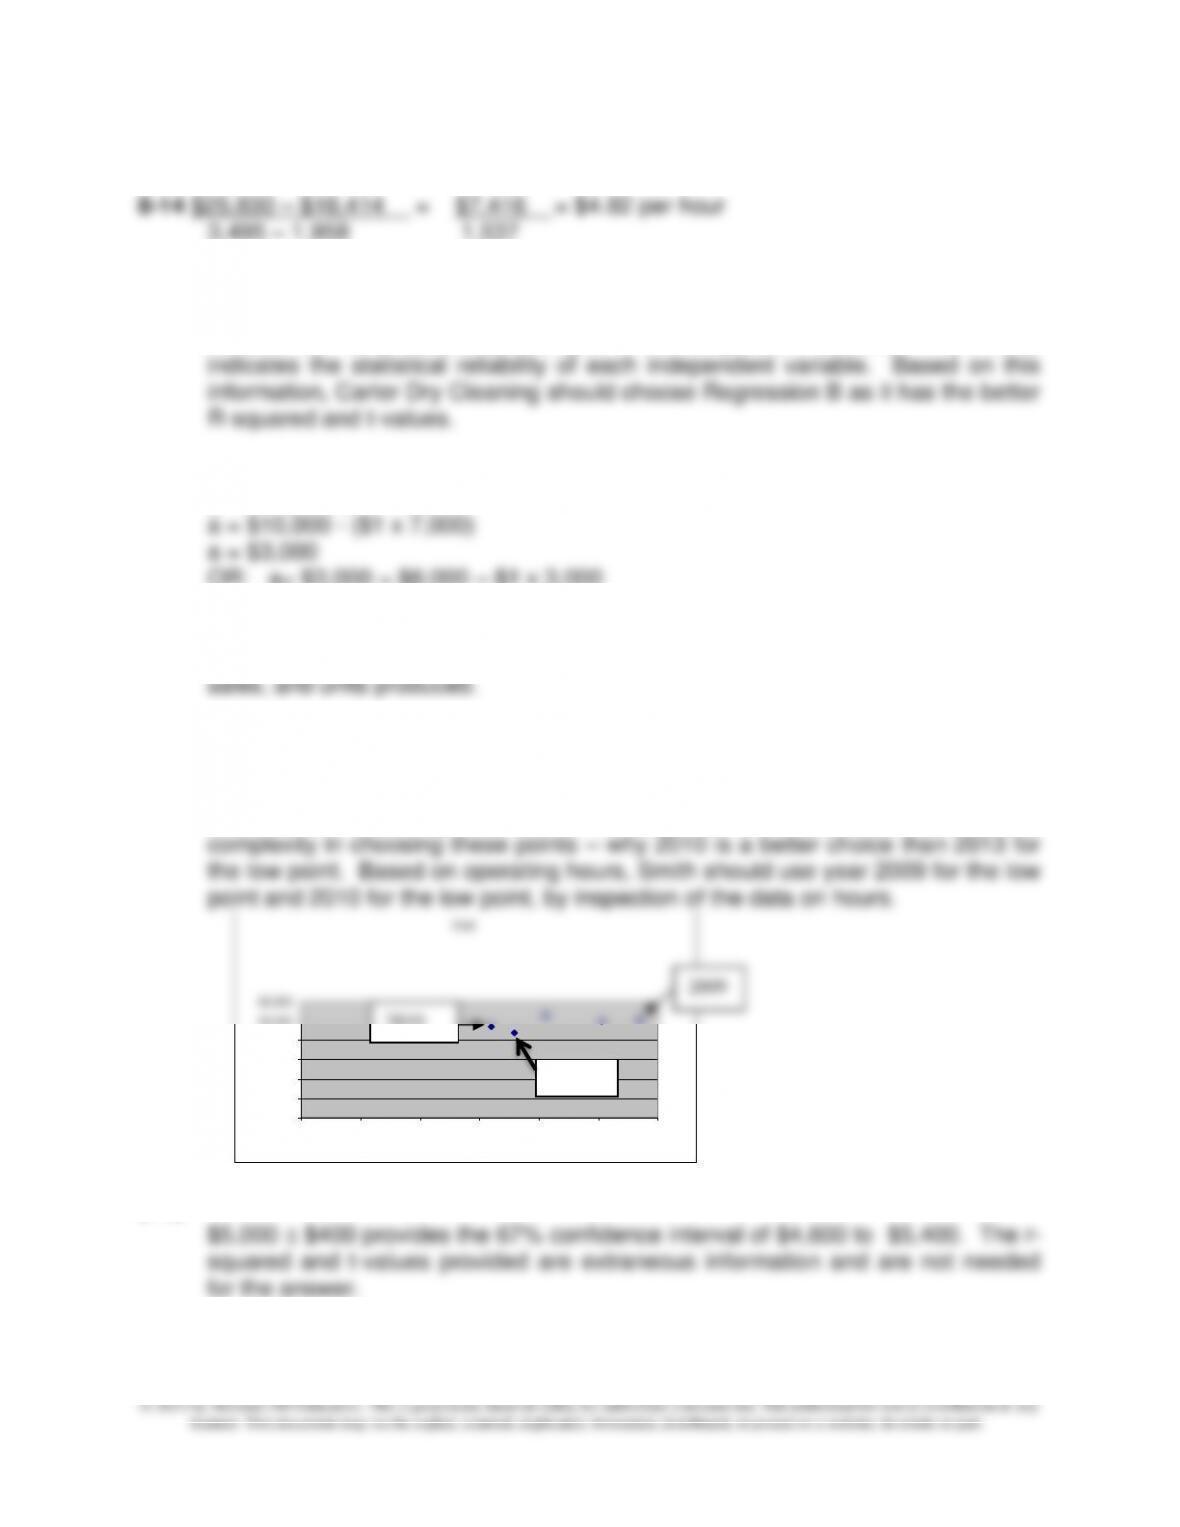
Answers are likely to vary, with 2010 or 2013 likely to chosen as the low points
and 2009 as the high point. A useful extension of this exercise in class would be
to show the following (or equivalent) graph of the data, which shows the
8-19
0
10,000
20,000
30,000
40,000
50,000
60,000
0 1,000 2,000 3,000 4,000 5,000 6,000
Cost
2009
2010
2013
Chapter 8 – Cost Estimation
8-5
8-20 $20,000 – $10,000 = $10,000 = $0.02 per key
3,000,000 – 2,500,000 500,000
8-21
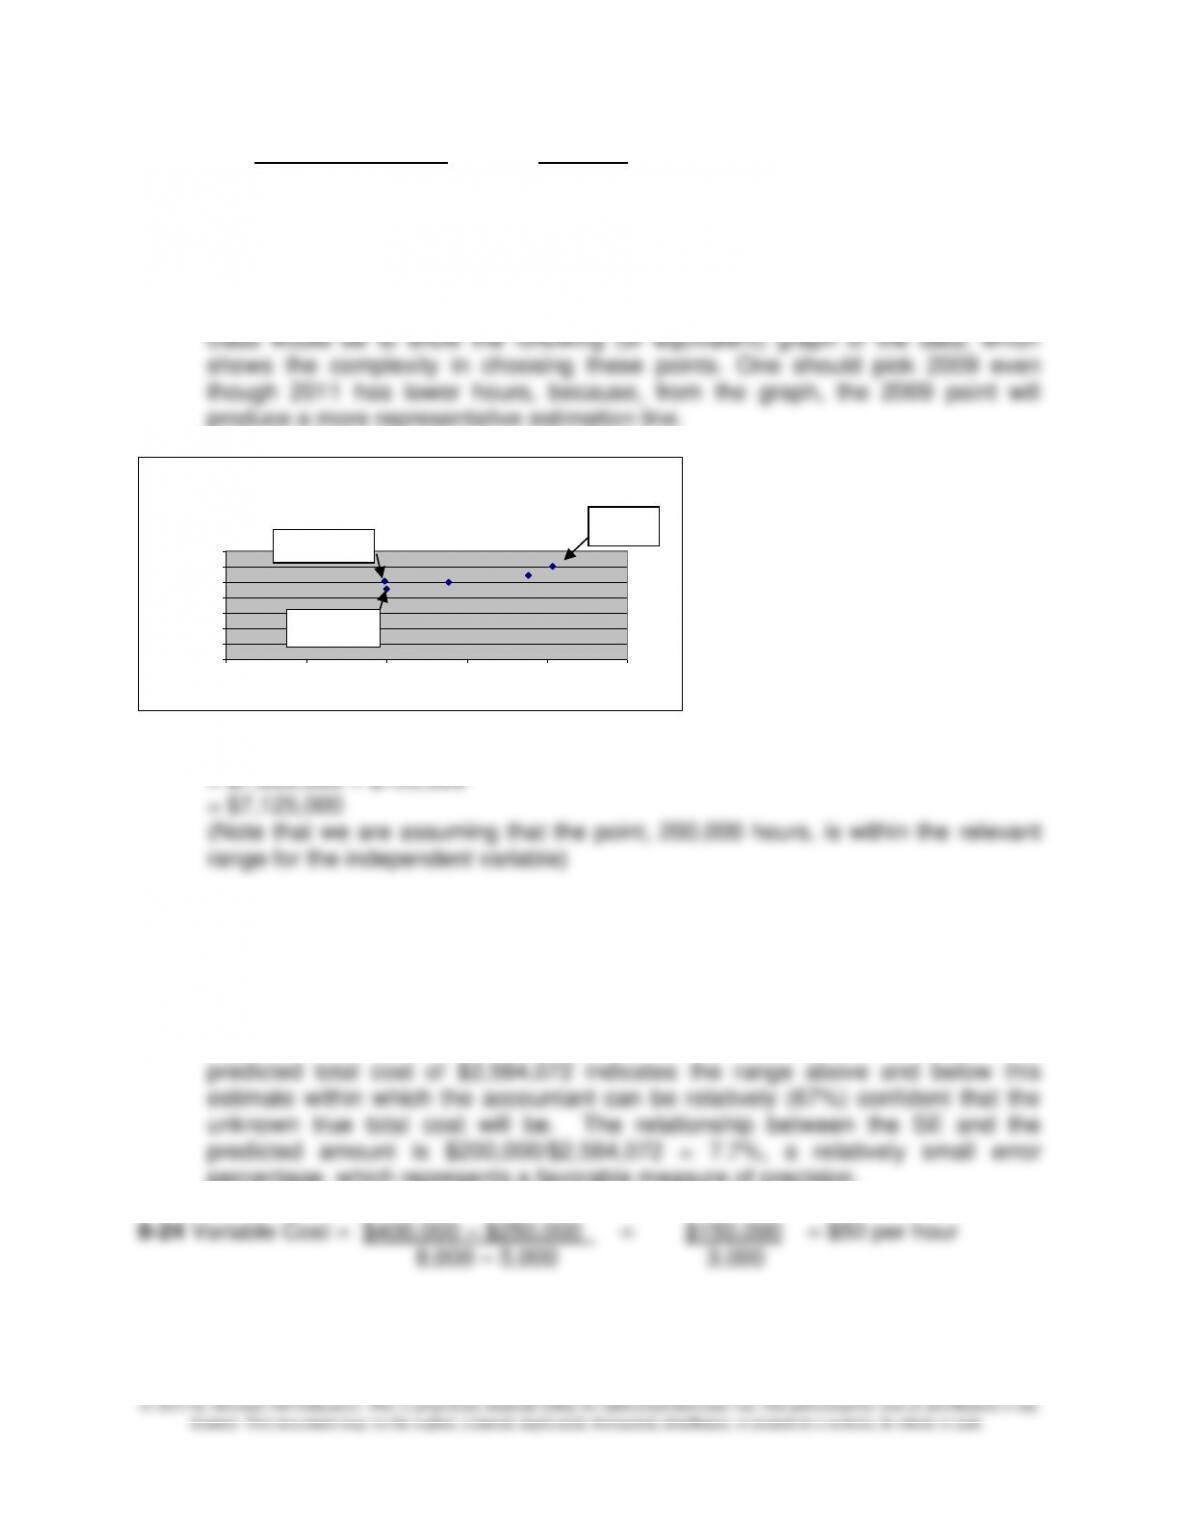
The clear choice for the high point is 2012, but the low point is more difficult to
determine. Answers are likely to vary, with 2009 or 2011 likely to chosen as the
low points and 2012 as the high point. A useful extension of this exercise in
produce a more representative estimation line.
8-22 Total Cost= 200,000 x $35 + $125,000
= $7,000,000 + $125,000
8-23
The R-squared value of .6 tells you that changes in the independent variable do
not predict changes in the dependent variable very well; usually we would expect
the R-squared to be above approximately 80%. The t-value of 2.3 indicates
there is a reasonably reliable relationship between the independent and
dependent variables. The standard error of the estimate (SE) of $200,000 on a
percentage, which represents a favorable measure of precision.
0
100,000
200,000
300,000
400,000
500,000
600,000
700,000
0 50,000 100,000 150,000 200,000 250,000
Handling Cost ($)
2009
2012
2011
8-6
8-25 a = $80,000 – (30,000 x $2)
8-26 Total cost for bandwidth of 9 GB would be the minimum charge of $45
Chapter 8 – Cost Estimation
8-7
EXERCISES
8-27 Estimating Costs in an Uncertain Environment (10 min)
Southwest Airlines updates its cost estimates as follows:
1. Labor Costs: Southwest Airlines (SW) updates its estimates of
labor costs twice a month
2. Fuel costs: SW updates these estimates weekly
6. Aircraft ownership costs: SW updates these costs quarterly
Fuel costs are updated most frequently because of the volatility in aircraft
gasoline costs; the fluctuations in these costs mirrors the wide fluctuations
in the costs of gasoline and home heating oil that affect consumers broadly.
Labor costs, maintenance spending, and airport fees are managed by the
airline by careful scheduling of employees and aircraft maintenance as
Advertising spending is an important cost element but is not driven by
customer demand, so it is more discretionary. Monthly updates are
adequate.
Aircraft ownership costs, the lease payments for the aircraft and related
expenses, are largely fixed and therefore the estimates fluctuate less
widely and the estimates can be updated less frequently.
8-8
Source: Matthew G. Lamoreaux, “Planning for Uncertainty,” Journal of
Accountancy, October 2011, pp 32-37.
8-28 Regression Analysis and the Insurance Industry (15 min)
1. As noted in the question, data mining is used in certain industries to
help companies in selecting the most profitable products and
services, setting prices, and increasing consumer demand for their
2. The potential ethical issue is privacy. When customers use their
loyalty card, they may not be aware that the company is using this
data to target products and services to them. Additionally, as noted
in an article by Thomas H. Davenport and Jeanne G Harris,
cholesterol foods) food products to incidence of health problems and
medical claims.
Source: Thomas H. Davenport and Jeanne G. Harris, “The Dark Side of
Customer Analytics,” Harvard Business Review, May 2007, pp 37-41; see
also, Charles Duhigg, “How Companies Learn Your Secrets,” The New
York Times Magazine, February 19, 2012, pp. 32-55; and General
Electric’s $1 billion investment in predictive analytics, Tim Catts, “GE
Heads West With $1 Billion to Spend,” Bloomberg Businessweek, April
30, 2012, pp. 38-39.
Chapter 8 – Cost Estimation
8-9
8-29 Cost Classification
1. b
2. f
10. g
8-10
8-30 Cost Relationships (10 min)
N = Number of Cleaning Services
The cost function equation is:
Total annual cost is:
(Note: 100 service calls per month = 1,200 service calls per year)
= $ 165,000 + ($35 x 1,200)
= $207,000
Average cost per service call is:
8-11
8-31 Cost Relationships (15min)
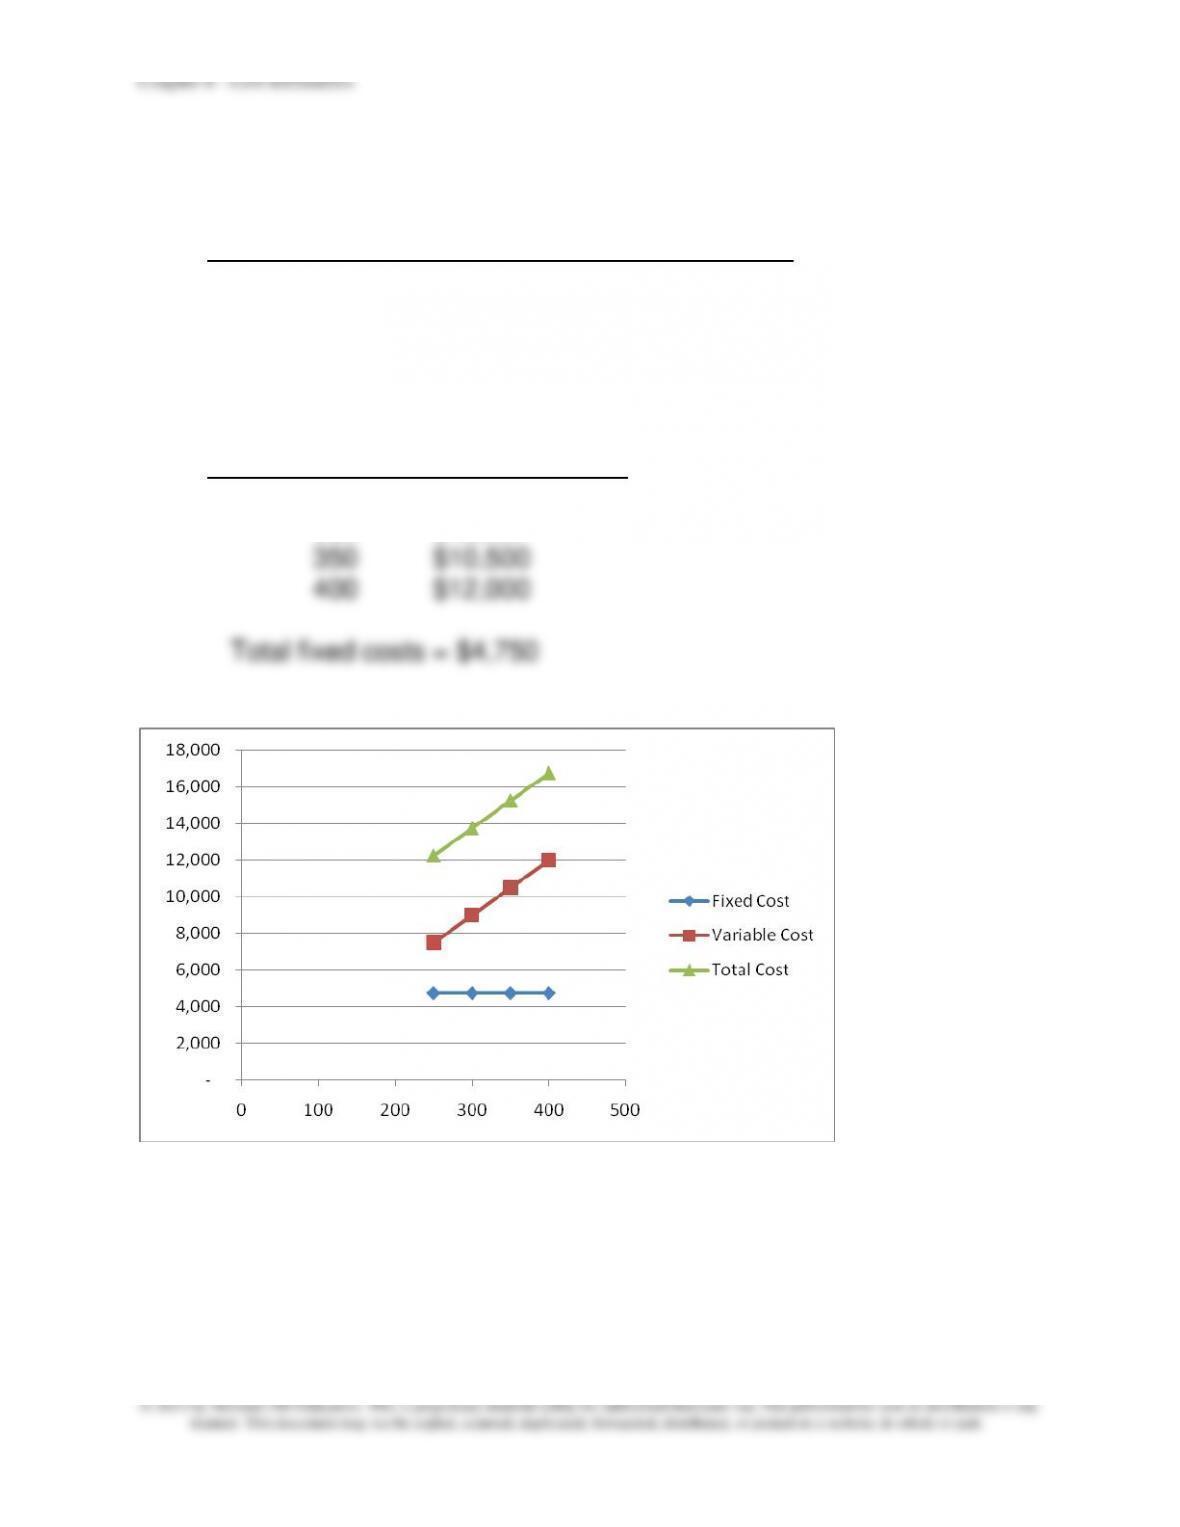
1. Total costs: See Exhibit below
Output Total Costs Total Costs Per Unit
250 $12,250 $49.00
300 $13,750 $45.83
350 $15,250 $43.57
400 $16,750 $41.88
Total variable costs:
Output Total Variable Costs
250 $ 7,500
300 $ 9,000
2. Per-unit total cost: See Exhibit below
Per unit variable costs:
$7,500 / 250 = $30
8-12
8-31 (continued -1)
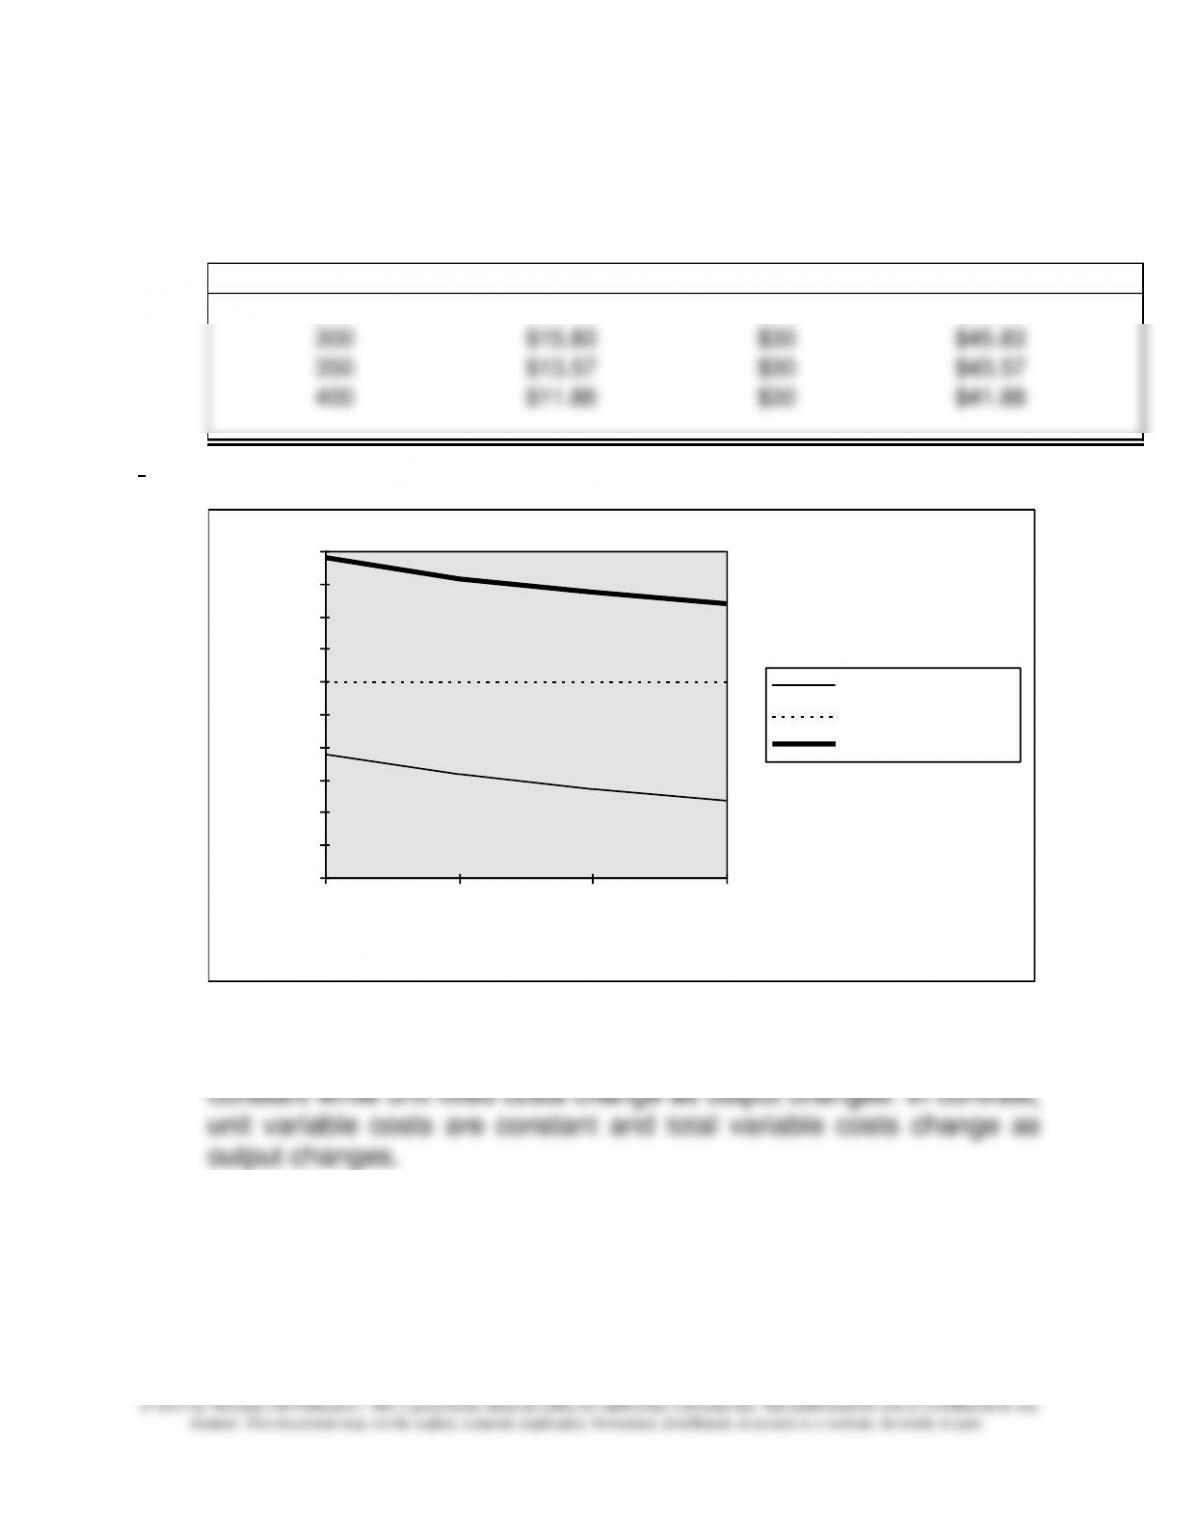
Per–unit costs:
Output in Units Fixed Costs/unit Variable Costs/unit Total Costs/unit
250 $19.00 $30 $49.00
300 $15.83 $30 $45.83
350 $13.57 $30 $43.57
400 $11.88 $30 $41.88
\
0.00
5.00
10.00
15.00
20.00
25.00
30.00
35.00
40.00
45.00
50.00
250 300 350 400
Output
Cost
per Unit Fixed Cost
per Unit Variable Cost
per Unit Total Cost
3. The important point of these graphs is that total fixed costs are
8-13
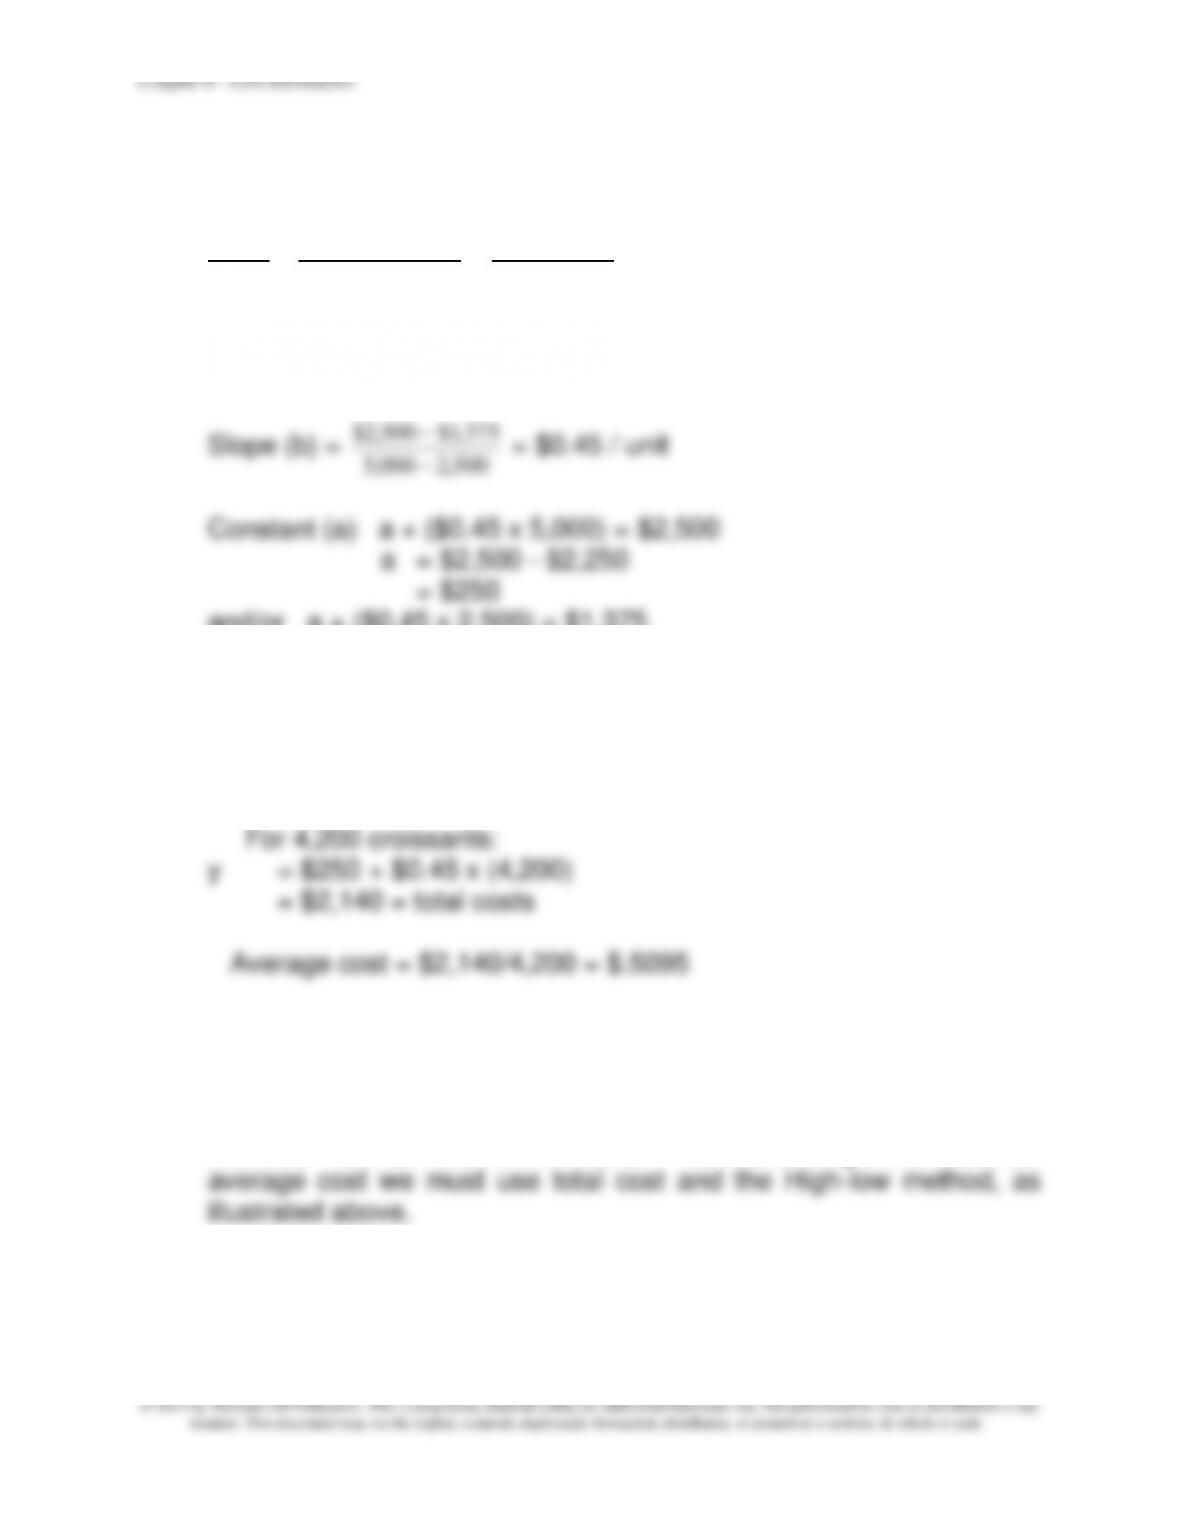
8-32 Cost Estimation; Average Cost (15 min)
Compute total cost for each batch:
Units x Average Cost = Total Cost
2,500 x $0.55 = $1,375
5,000 x $0.50 = $2,500
Use high-low analysis and compute cost function:
375,1$500,2$
−
and/or a + ($0.45 x 2,500) = $1,375
a = $250
The cost function is:
y = a + b x Number of croissants produced
y = $250 + [$0.45 x (croissants produced)]
The point of this exercise is that the unit average cost cannot be
determined simply by taking the simple average of $.50 and $.55,
because these average costs include fixed costs which decline at a
nonlinear rate as volume increases. Therefore, to get the accurate
8-14
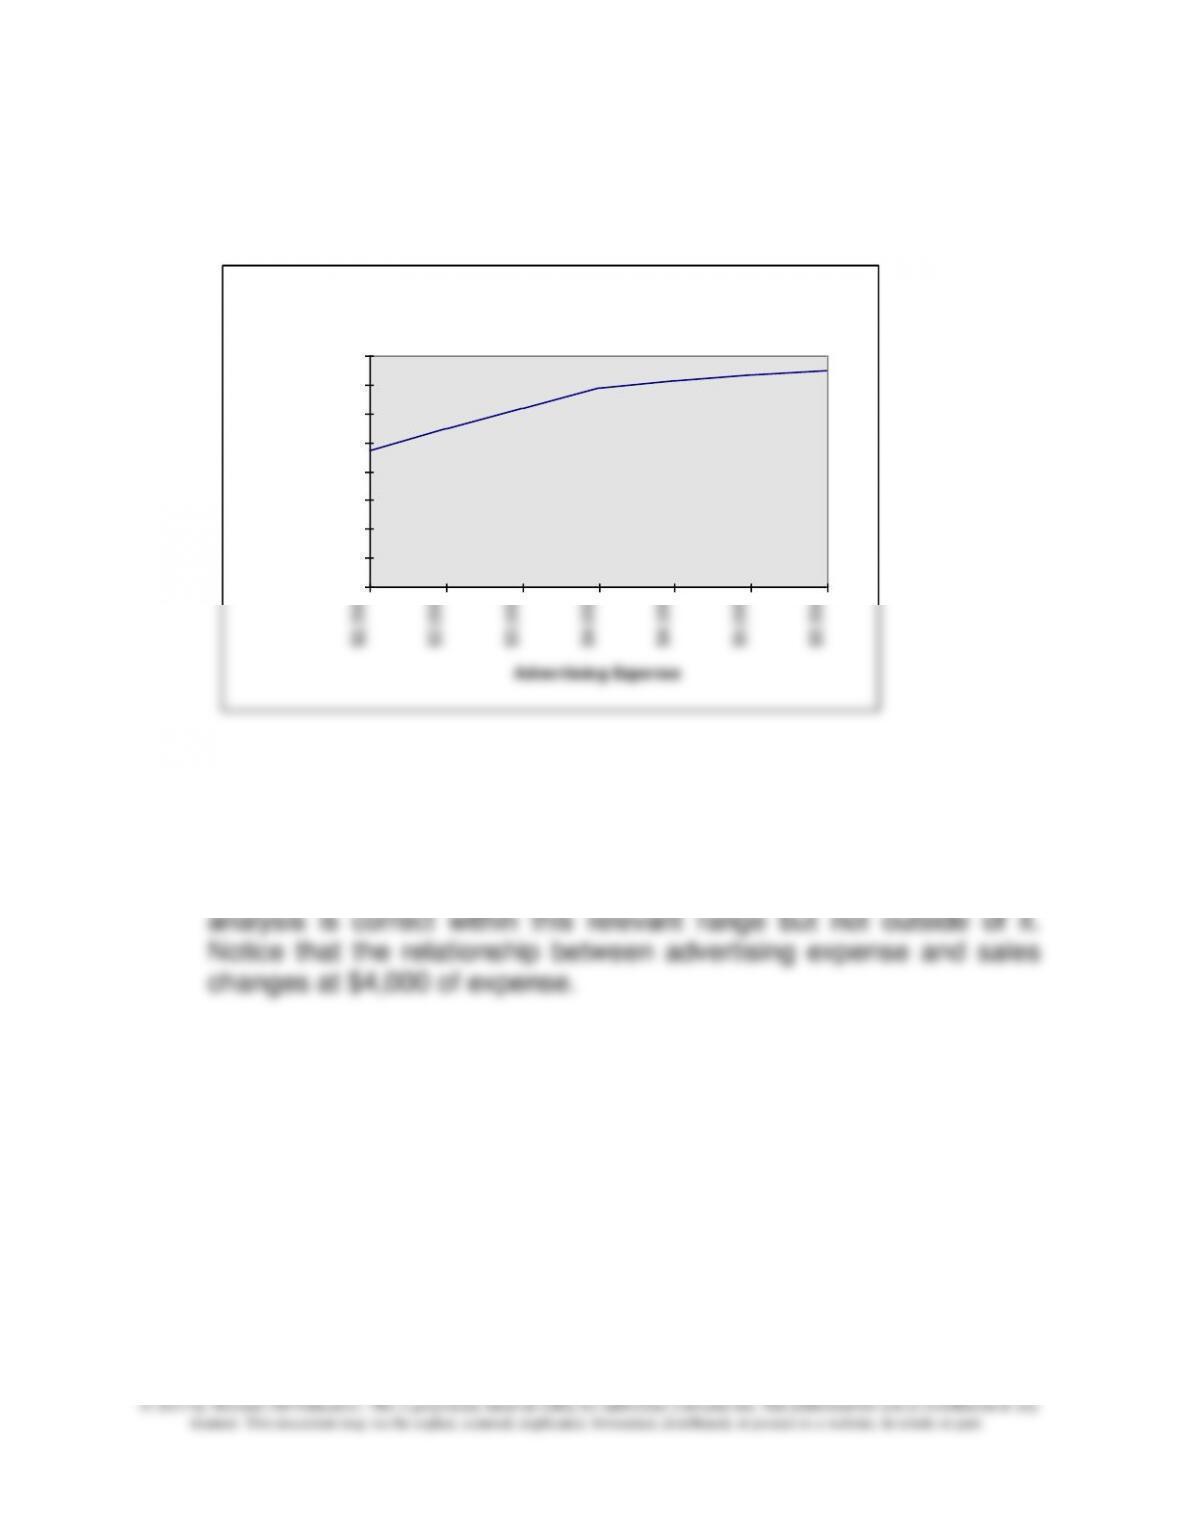
8-33 Cost Estimation Using Graphs (15 min)
1.
2. There seems to be a positive linear relationship for the data
between $2,500 and $4,000 of advertising expense. Lawson’s
Sales and Advertising Expense
$-
$20,000
$40,000
$60,000
$80,000
$100,000
$120,000
$140,000
$160,000
$2,500
$3,000
$3,500
$4,000
$4,500
$5,000
$5,500
Advertising Expense
Sales
8-15
8-34 Analysis of Regression Results (10 min)
Regression one uses only labor hours, regression two uses only machine
hours, and regression three uses them both.
Regression 2 is clearly inferior as it has the lowest R-squared, the highest
SE, and an unsatisfactory t-value
Regressions 1 and 2 have comparable SE and R-squared values, though
regression 3 is marginally better. Note however, that the t-values show
that, in regression 3, labor hours is marginally satisfactory (not quite 2) and
machine hours still has an unsatisfactory t. This finding for the t-values in
regression three likely indicates that the two variables, labor hours and
either regression one or three will work, but if there is a plan to use the
coefficients of the two variables to approximate unit labor costs or unit
machine time costs, then regression three should not be used – the poor t-
values indicate that the relationships developed in the regression for these
two independent variables are not statistically significant (the t-values are
less than 2), and moreover, there is evidence of multicollinearity between
these two variables. The regression 1 coefficient for labor hours could be