8-46
8-49 (continued -3)
2. If Lexon is involved in global production of its products, then expenses
incurred from returns must be analyzed by production facility, as these

Chapter 8 – Cost Estimation
8-47
8-50 Regression; Applicants for M.B.A. Programs (50 min)
1.The regression results are shown below. We expect a positive
relationship which would confirm that an increase in the unemployment rate
is associated with an increase in the number of GMAT takers. The results
show little relationship between the unemployment rate and the percentage
change in the number of GMAT takers in the same year. Limitations of
The following uses the unemployment rate for college graduates 25 years
or older (also from the Bureau of Labor Statistics site). The results are
marginally better, but not statistically significant.
Regression Statistics
Multiple R 0.210752813
R Square 0.044416748
Adjusted R Square -0.092095145
Standard Error 7.675445647
Observations 9
ANOVA
df SS MS F Significance F
Regression 1 19.1682944 19.16829 0.325369 0.586233597
Residual 7 412.387261 58.91247
Total 8 431.555556
Coefficients
Standard Erro
t Stat P-value
Intercept 14.15031847 21.0673268 0.671671 0.523334
L
Unemployment Rate -2.343949045 4.10922604 –0.57041 0.586234
Regression Statistics
Multiple R 0.326760575
R Square 0.106772474
Adjusted R Square -0.020831459
Standard Error 7.420794156
Observations 9
ANOVA
df SS MS F Significance F
Regression 1 46.07825417 46.07825 0.836749 0.390749012
Residual 7 385.4773014 55.06819
Total 8 431.5555556
Coefficients Standard Error t Stat P-value
Intercept 14.26733922 13.39812623 1.064876 0.322279
College grad Rate -5.113493064 5.590106066 –0.91474 0.390749
8-50 (continued –1)
2.
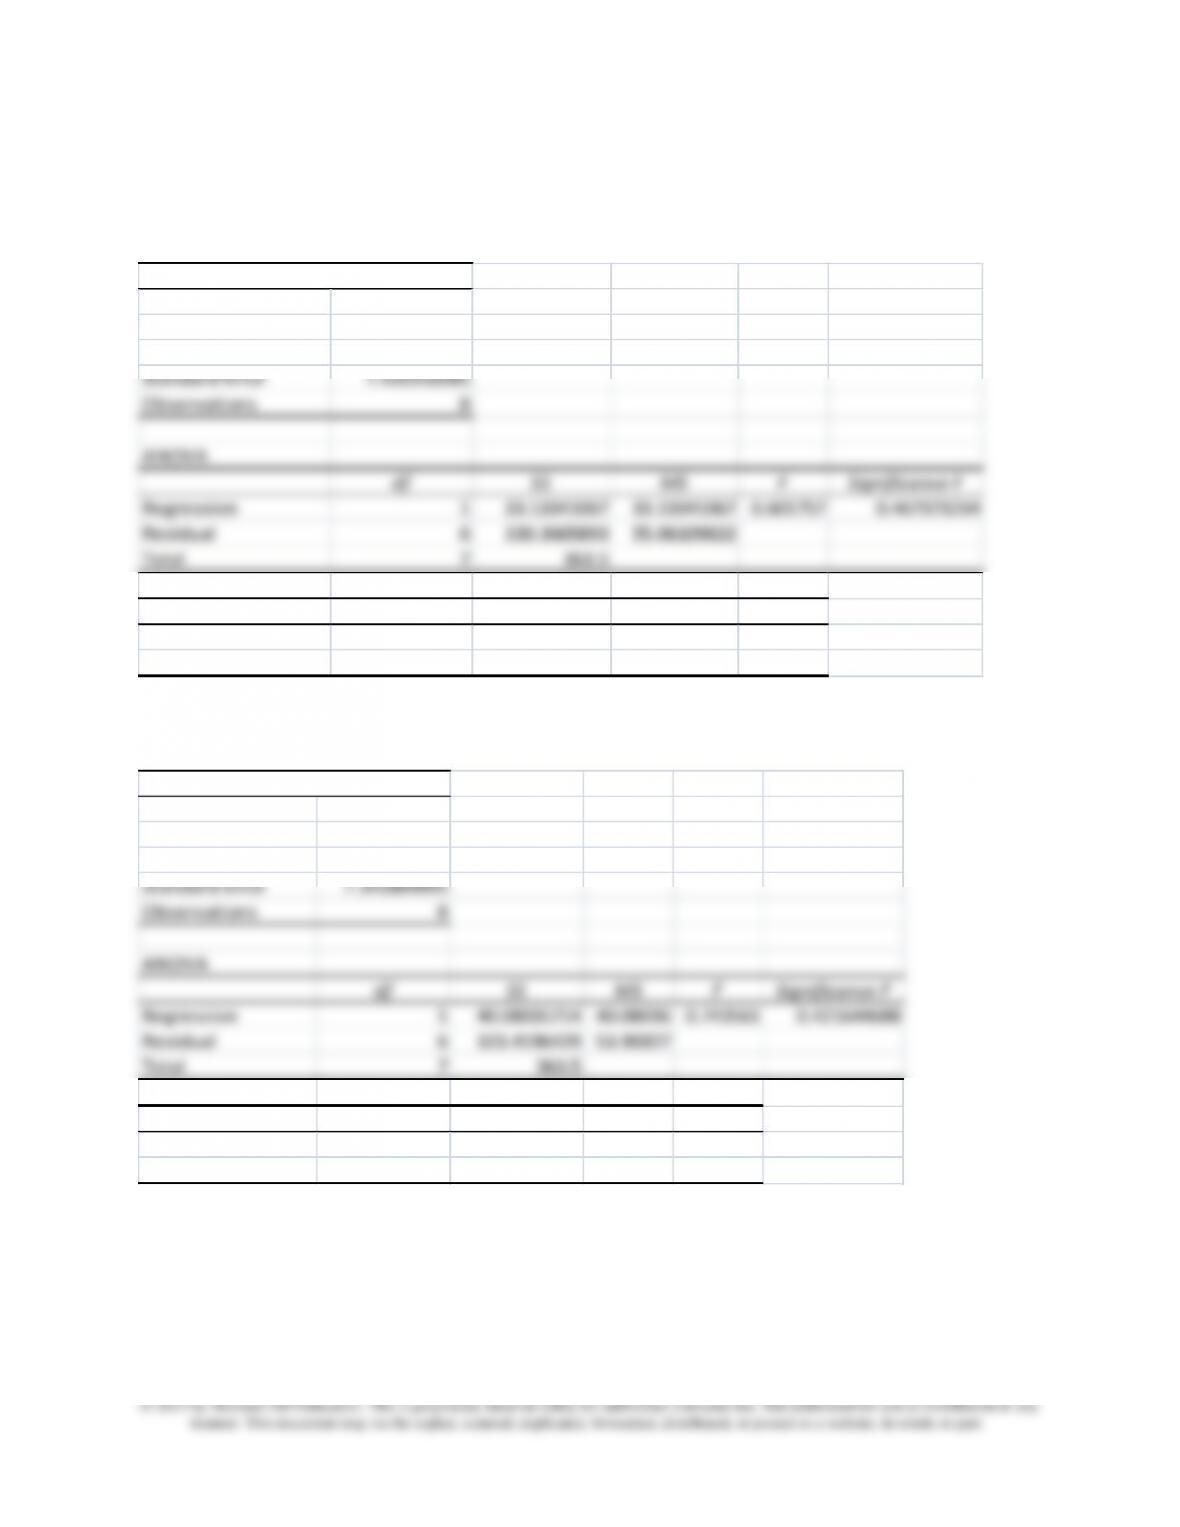
The results for a one-year lag for the full employment data are as follows.
This is somewhat better than the unlagged model, but still not significant.
The lagged model with college graduates is below. Again, a small
improvement, but not statistically significant.
Overall, there appears to be no significant relationship, for our data,
Regression Statistics
Multiple R 0.30191234
R Square 0.091151061
Adjusted R Square –0.060323762
Standard Error 7.420316585
Observations 8
ANOVA
df SS MS F Significance F
Regression 1 33.13341067 33.13341067 0.601757 0.467373234
Residual 6 330.3665893 55.06109822
Total 7 363.5
Coefficients Standard Error t Stat P-value
Intercept –19.23781903 26.5409938 –0.724834163 0.495837
Unemployment Rate(%
3.921113689 5.054739717 0.775730089 0.467373
Regression Statistics
Multiple R 0.332057722
R Square 0.110262331
Adjusted R Square –0.038027281
Standard Error 7.341884895
Observations 8
ANOVA
df SS MS F Significance F
Regression 1 40.08035714 40.08036 0.743561 0.421644688
Residual 6 323.4196429 53.90327
Total 7 363.5
Coefficients Standard Error t Stat P-value
Intercept –13.40625 17.19377118 -0.77972 0.465193
College grad Rate 5.982142857 6.937429138 0.8623 0.421645

Chapter 8 – Cost Estimation
8-49
8-50 (continued –2)
In contrast, there is an apparent association between the unemployment
rate and the number of applicants for community colleges. See article cited
below.
Source: Anjali Athavaley, “Escape Route: Seeking Refuge in an M.B.A.
Program,” The Wall Street Journal, October 14, 2008, p. D1. For
information about the effect of unemployment on community colleges, see
Sara Murray, “Weighing the Two–Year Option,” The Wall Street Journal,
January 28, 2009, p D1.
For a more recent update to the above, see “College Grads Gain on
MBAs,” The Wall Street Journal,” October 6, 2011, p. B5. This articles
makes the case that, in 2011, the gap is closing between MBAs and
business undergrad students on a number of dimensions of employment.
For another useful reference, see Businessweek, August 24, 2009 p 21 in
the section entitled “Busts and MBAs” which shows data indicating an
increase in the number of applicants for the Graduate Management
Admissions Test (GMAT) from 1968 through 2009, with a sharp increase in
2009 (note, the 2009 data was not available when the GMAC data was
used to prepare this problem in March 2009).
Also, there is evidence that the relationships among variables affecting
unemployment have changed significantly since the recession began in
2007. See Justin Lahart, “On Jobs, No Celebratory Beveridge,” The Wall
Street Journal, April 11, 2012, p C14. The word Beveridge refers to the
Beveridge Curve, a data-based correlation model which predicts the
(inverse) relationship between the job vacancy rate in the economy and the
unemployment rate. Job unemployment rates are much higher relative to
vacancy rates since the 2007 recession, reflecting (the author argues) that
the economy has become less efficient at matching available workers with
jobs. This can mean a less productive economy, at least for the present
time.
8-50
8-51 Learning Curves (20 min)
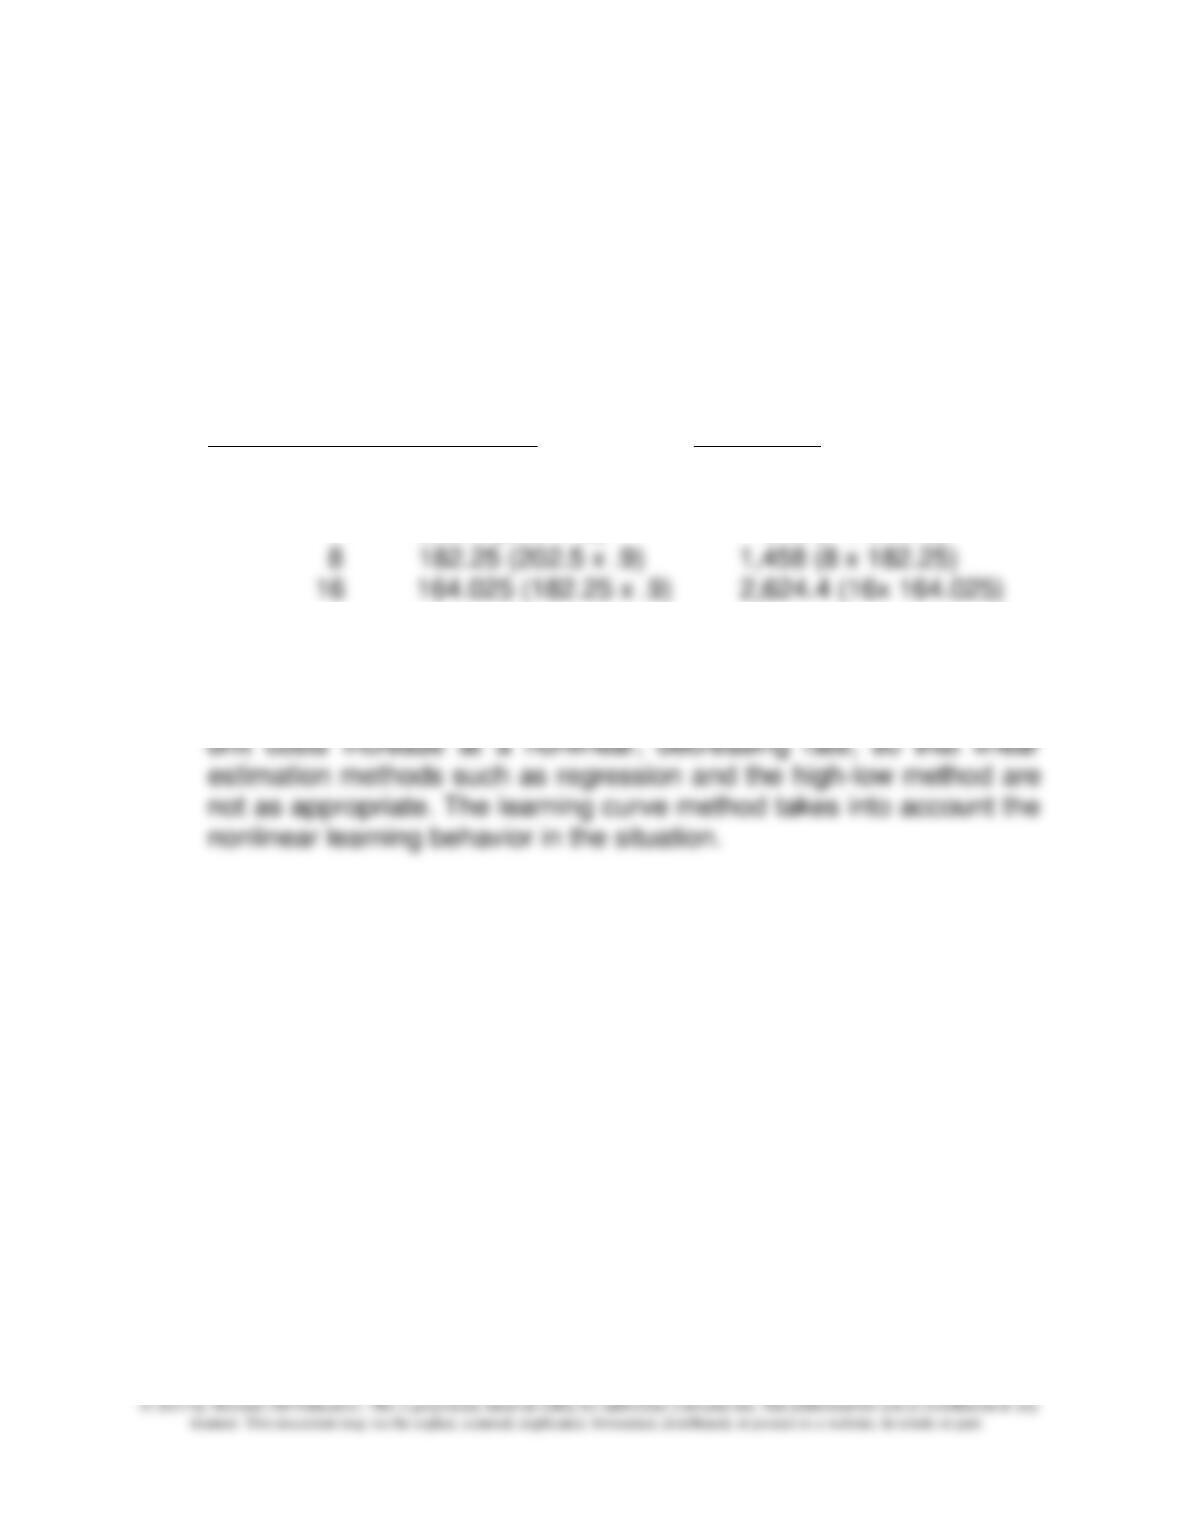
The average production hours per unit obviously decreased as the
output increased. This decrease corresponds very closely to that of a
90% learning curve.
1. An estimate of the hours required to build 16 aircraft is 2,624
hours.
Output Avg. Time Total Time
1 250 250
2 225 (250 x .9) 450 (2 x 225)
4 202.5 (225 x .9) 810 (4 x 202.5)
2. The role of learning curves is to help predict future costs when
significant learning takes place in the work. When learning is present,
8-51
8-52 Learning Curves (20 min)
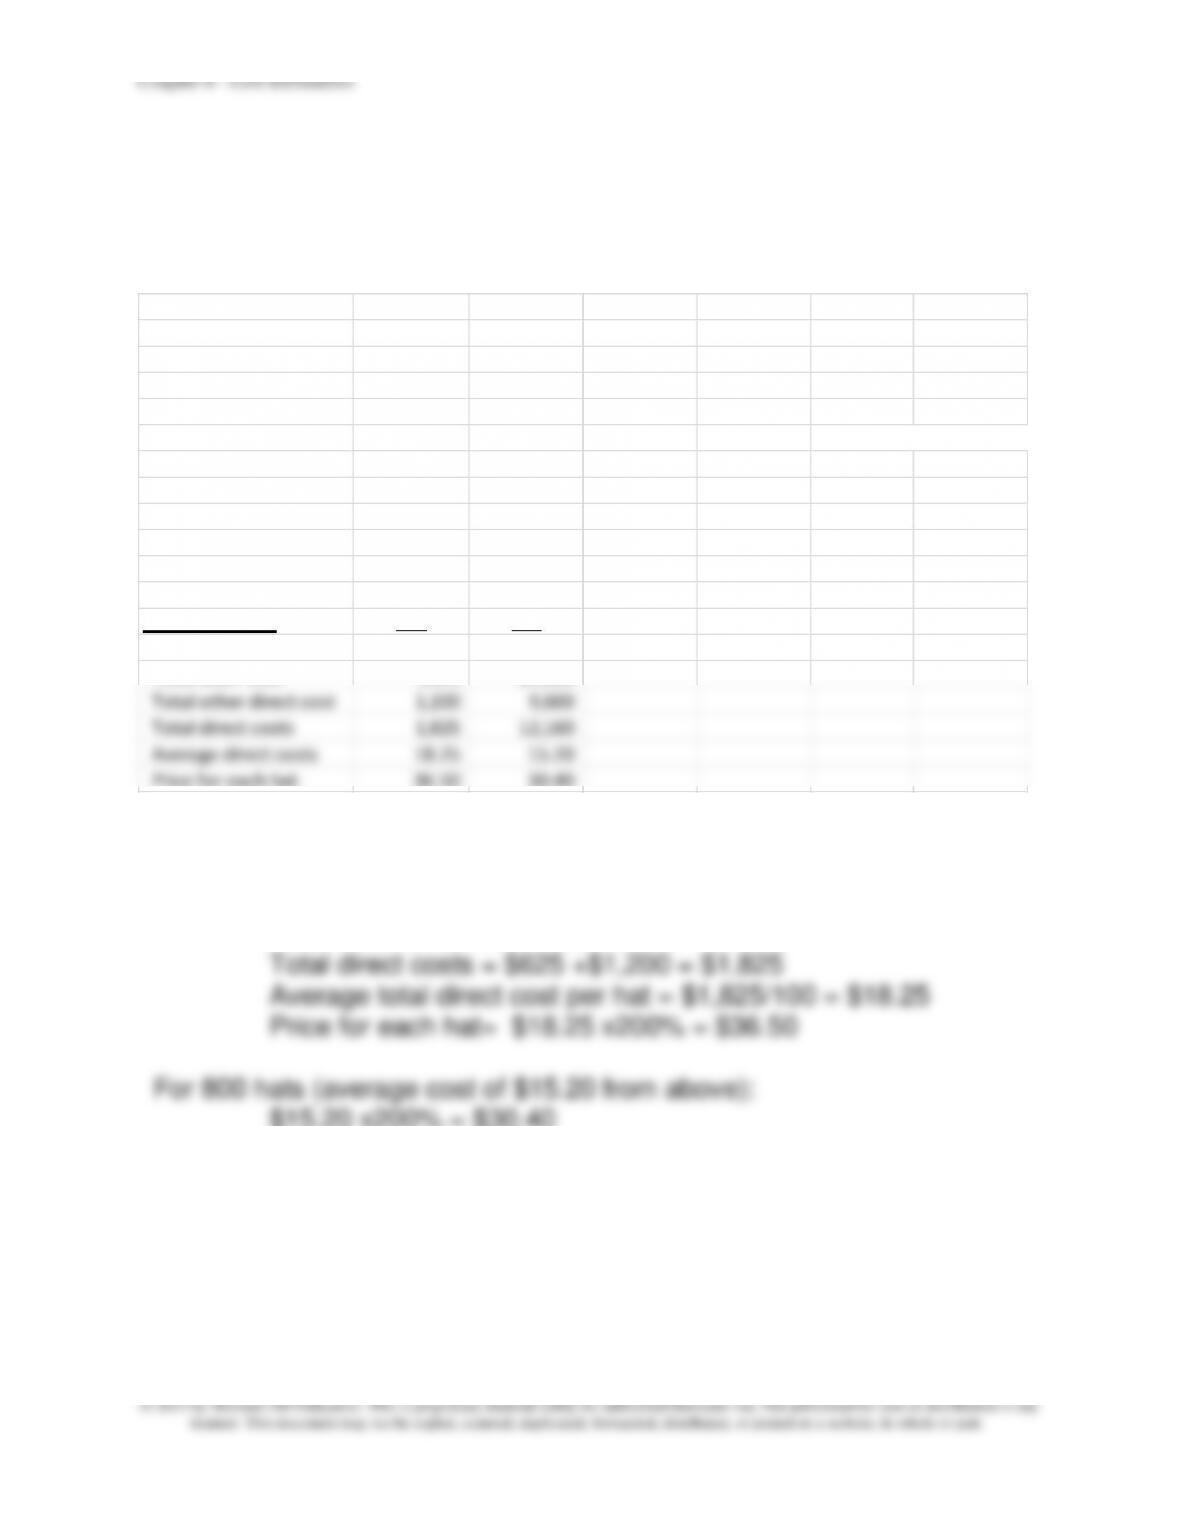
The average labor hours for the first 100 hats is 25/100 = .25 hours per hat
Labor rate per hour $25
Other direct costs $12
Learning Rate 0.8
Selling price to cost 200%
Average Total Total Tot. Other Average Total
Cumulative Output Labor Hours Labor Hours Labor Cost Direct Cost Total Cost Cost
100 0.25 25 $625 $1,200 $1,825 $18.25
200 0.2 40 1,000 2,400 3,400 17.00
400 0.16 64 1,600 4,800 6,400 16.00
800 0.128 102.4 2,560 9,600 12,160 15.20
Number of Hats 100 800
Total labor hours 25 102.4
Total labor cost $625 $2,560
Total other direct cost 1,200 9,600
Total direct costs 1,825 12,160
Average direct costs 18.25 15.20
Price for each hat 36.50 30.40
For 100 hats:
Total labor hours = 25
Total labor cost = 25 x $25 = $625
Total other direct cost = 100 x $12 = $1,200
$15.20 x200% = $30.40
8-52
8-53 Learning Curves (30 min)
Assuming an 80% learning curve, the production time will likely follow
the schedule below:
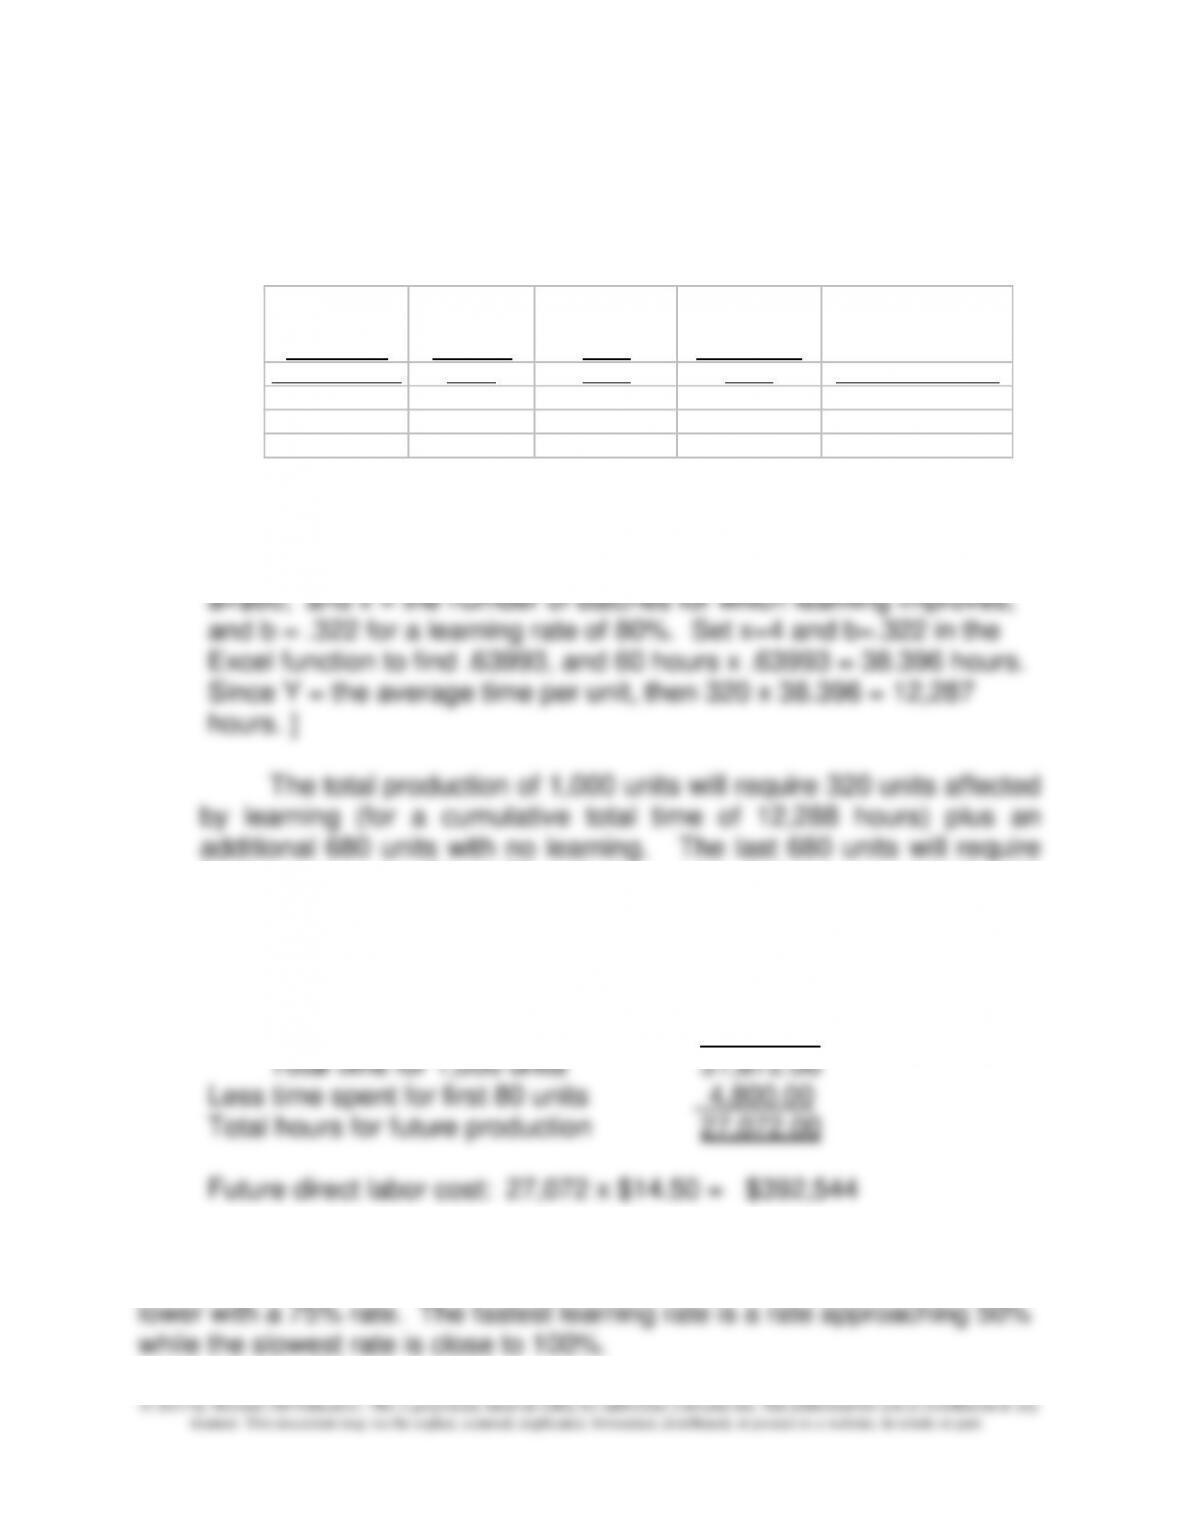
[Note to instructor: the total time of 12,288 can also be derived by
using the power function in Excel (one of the “Math and Trig.”
functions). Use the formula Y=ax-b , where Y = average time per unit,
28.8 hours each. Since 80 units have already been completed, only
920 need to be manufactured to calculate “future” direct labor costs:
Total time for 920 additional units is:
For first 320 units 12,288.00
For last 680 units x 28.8 hrs= 19,584.00
2. The 75% learning rate is faster than the 80% rate used in the
above analysis, so that the labor hours and direct labor costs would be
Total Units Average Total Increase in
Increase in
Time/Increase in
units =
(80 per batch) Time Time Time Increase per Unit
80 60.00 4,800.00 4,800.00 60.00
160 48.00 7,680.00 2,880.00 36.00
320 38.40 12,288.00 4,608.00 28.80
8-53
8-53 (continued –1)
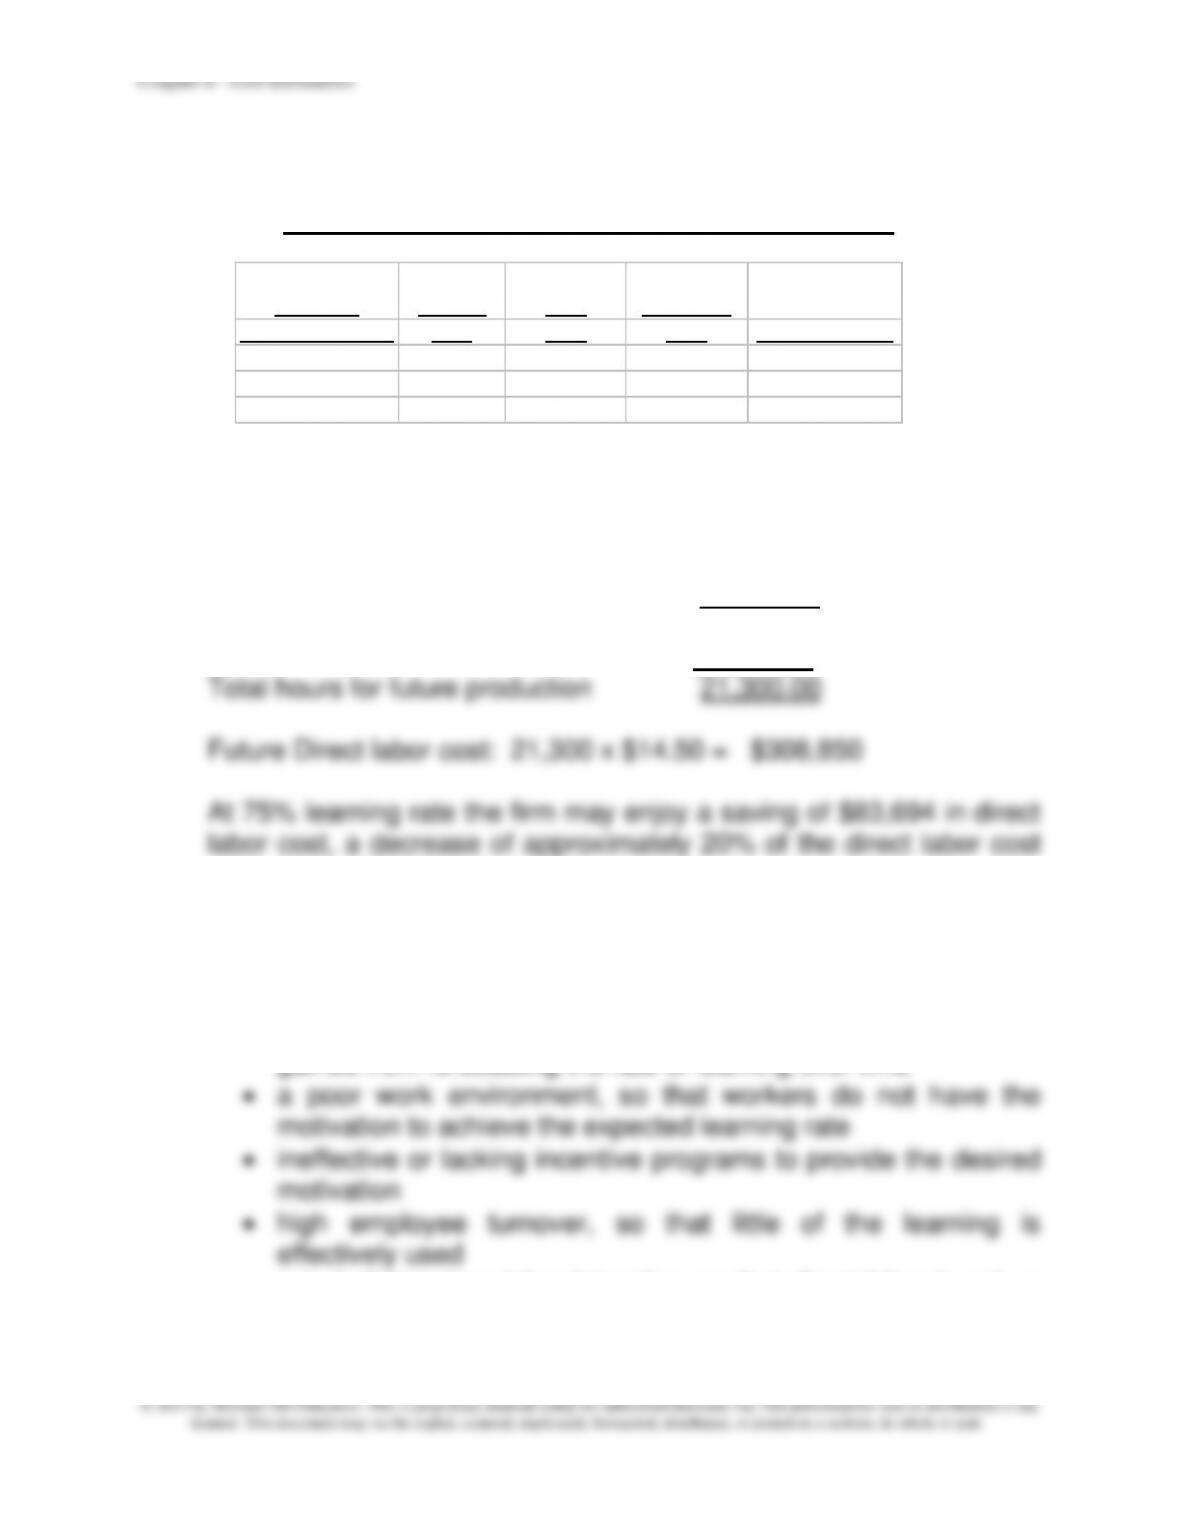
Estimated Production Time at 75% Learning Rate
At 75% learning rate, the total time for 920 additional units is:
Total time for 920 additional units is:
For first 320 units 10,800.00
For last 680 units x 22.5 hrs= 15,300.00
Total time for 1,000 units 26,100.00
Less time spent for first 80 units 4,800.00
estimated at 80% learning rate.
3. Conditions that might reduce the potential for the benefits from
learning curve analysis include:
• a simple task that is quickly learned, so that there is little to be
gained from forecasting the rate of learning over time
• a task that is less labor intensive, so that direct labor is only a
relatively small part of total costs
Total units Average Total Increase in
Time/Increase in
Units =
(80 units per batch) Time Time Time Increase per unit
80 60.00 4,800.00 4,800.00 60.00
160 45.00 7,200.00 2,400.00 30.00
320 33.75 10,800.00 3,600.00 22.50
8-54
8-53 (continued –2)
Strategically, firms like Hauser that are better able to predict costs
using learning curves and/or other methods will also be in a stronger
competitive position – the firm’s planning will be more focused and
effective. For example, firms that determine whether to manufacture
8-54 Cross-Sectional Regression; Analysis of Rankings
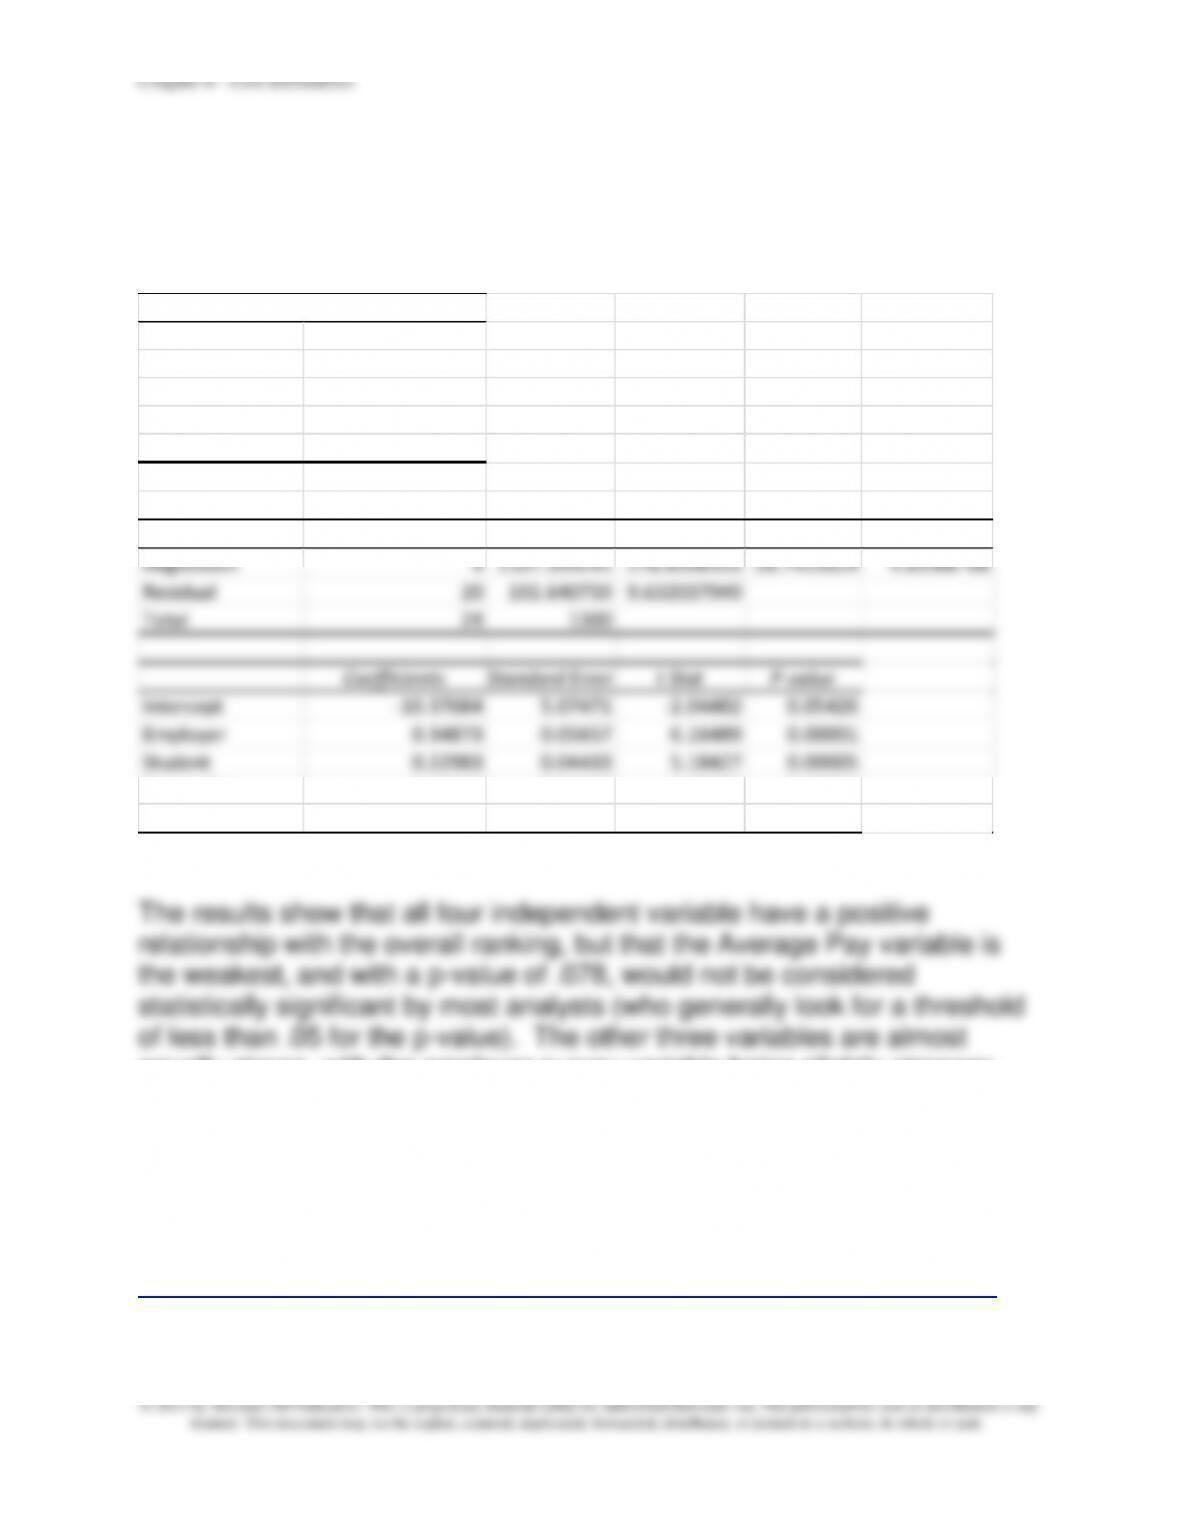
The regression results for the four independent variables with ranking of
the top 25 organizations as the dependent variable is shown below.
equally strong, with the employer survey variable being slightly stronger.
The results indicate that Businessweek appears to rely primarily on the
survey data, and particularly on that of the employer, in determining the
overall rank for these companies.
For the most recent information on the Bloomberg Businessweek rankings,
Regression Statistics
Multiple R 0.922938135
R Square 0.851814801
Adjusted R Square 0.822177761
Standard Error 3.103552472
Observations 25
ANOVA
df SS MS F Significance F
Regression 4 1107.359241 276.8398103 28.7415614 4.8596E-08
Residual 20 192.640759 9.632037949
Total 24 1300
Coefficients
Standard Error
t Stat P-value
Intercept –10.37684 5.07471 -2.04482 0.05426
Employer 0.34873 0.05657 6.16489 0.00001
Student 0.22983 0.04433 5.18427 0.00005
Career Svs 0.19467 0.04118 4.72703 0.00013
Pay 0.15062 0.08134 1.85176 0.07888