Unlock document.
This document is partially blurred.
Unlock all pages and 1 million more documents.
Get Access
Chapter 7 - Cost Allocation: Departments, Joint Products, and By-Products
7-58
7-45 (continued -2)
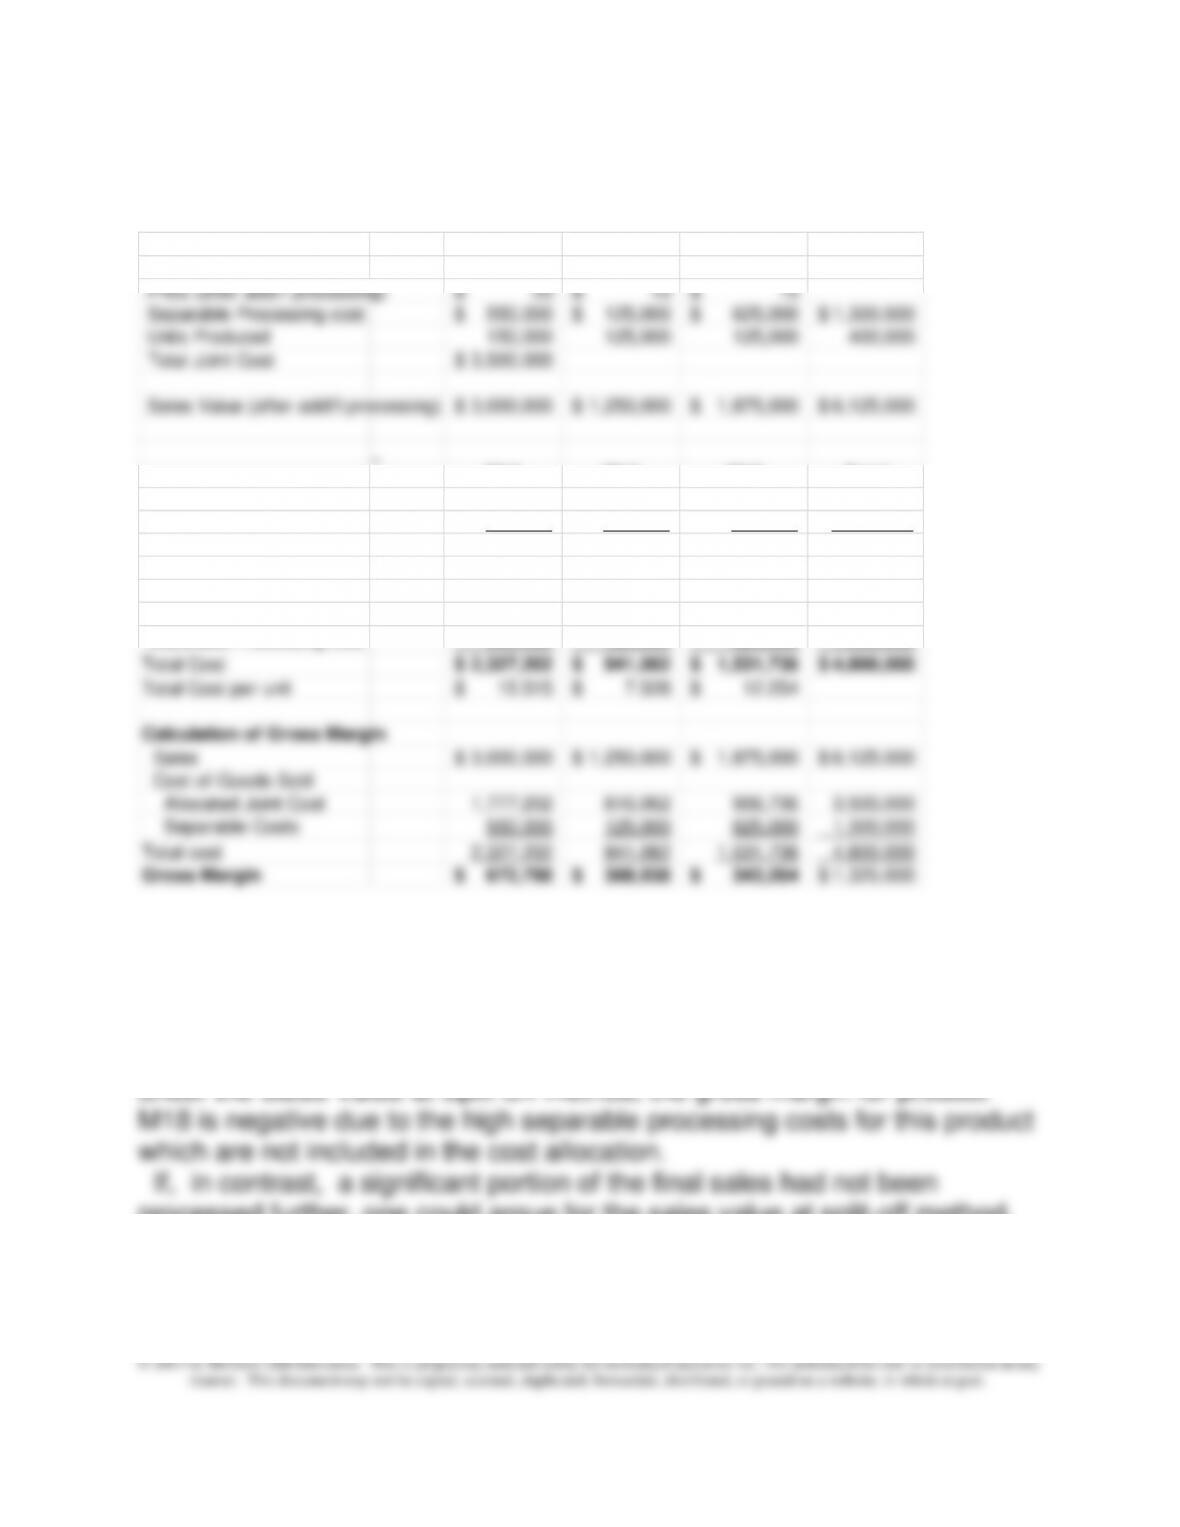
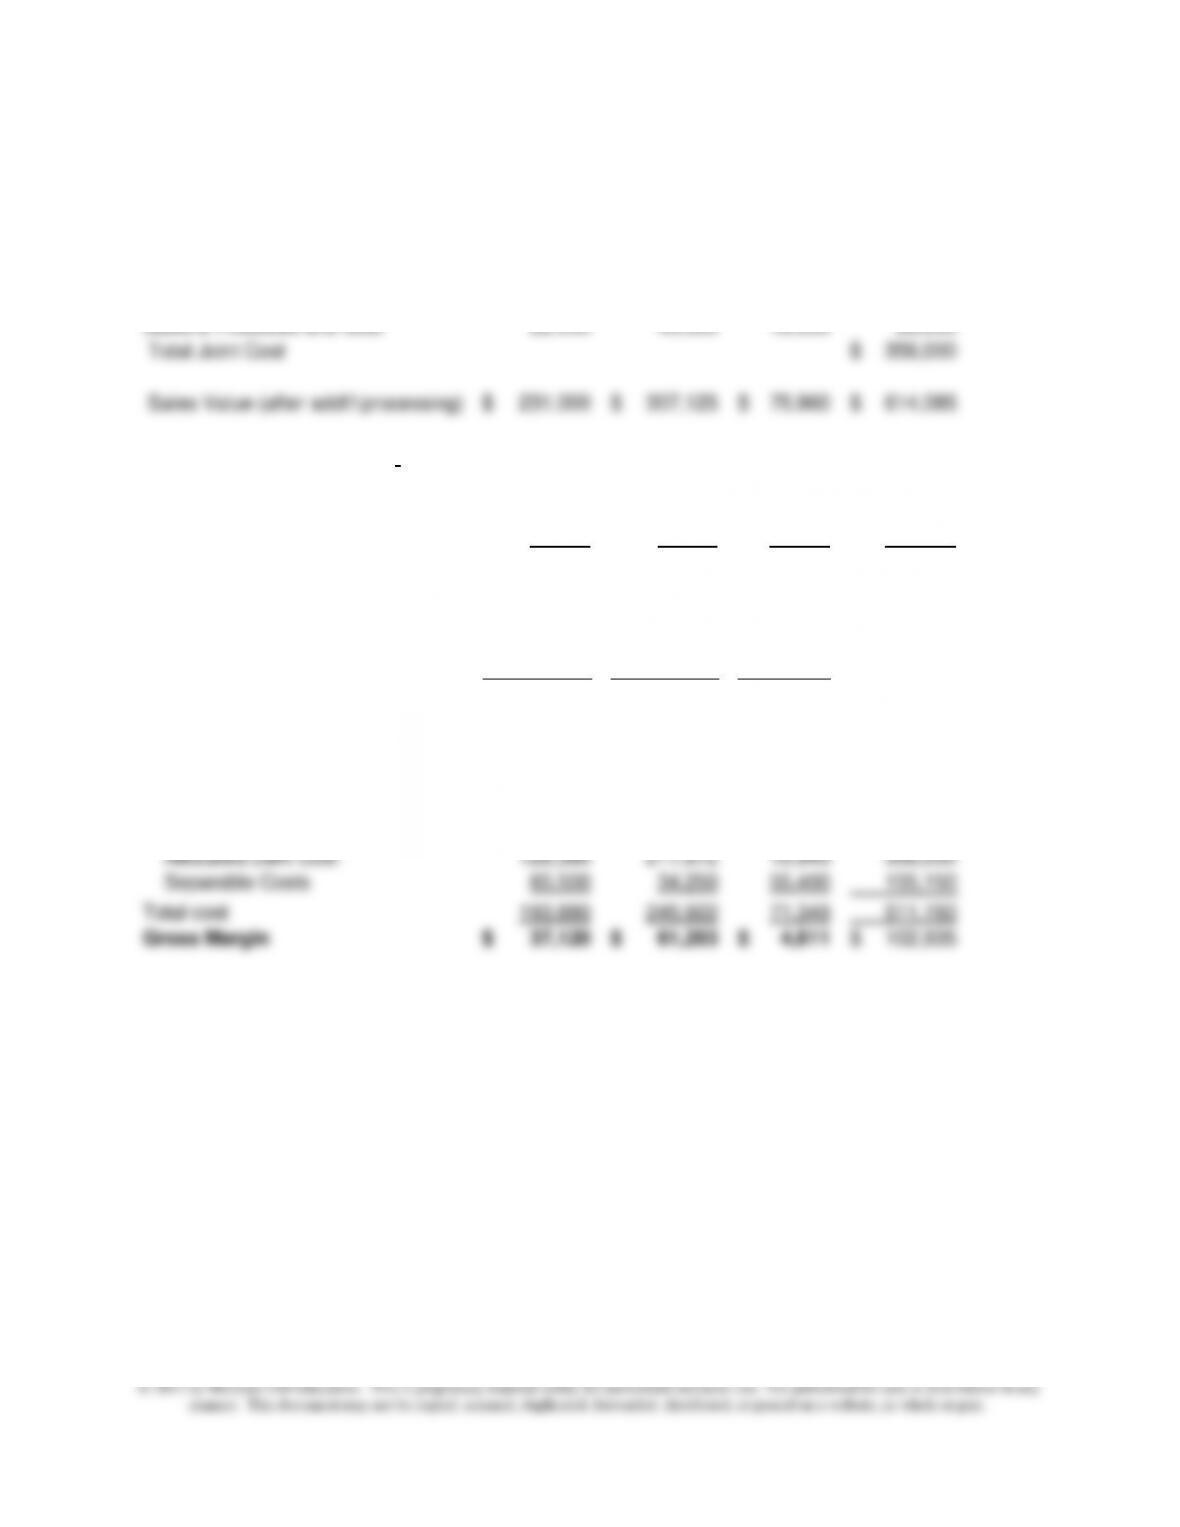
Net Realizable Value Method
M10 M15 M18 Total
Units Sold 150,000 125,000 125,000 400,000
Price (after addt'l processing) 20$ 10$ 15$
Separable Processing cost 550,000$ 125,000$ 625,000$ 1,300,000$
Units Produced 150,000 125,000 125,000 400,000
Total Joint Cost 3,500,000$
Sales Value (after addt'l processing) 3,000,000$ 1,250,000$ 1,875,000$ 6,125,000$
M10 M15 M18 Total
Sales Value of Production 3,000,000$ 1,250,000$ 1,875,000$ 6,125,000$
Less: Separable Costs 550,000 125,000 625,000 1,300,000
Net Realizable Value 2,450,000 1,125,000 1,250,000 4,825,000
Percent of Total NRV 50.7772% 23.3161% 25.9067% 100%
Allocated Joint Cost 1,777,202 816,062 906,736 3,500,000
Separable Processing cost 550,000 125,000 625,000 1,300,000
Total Cost 2,327,202$ 941,062$ 1,531,736$ 4,800,000$
Total Cost per unit 15.515$ 7.528$ 12.254$
Calculation of Gross Margin
Sales 3,000,000$ 1,250,000$ 1,875,000$ 6,125,000$
Cost of Goods Sold
Allocated Joint Cost 1,777,202 816,062 906,736 3,500,000
Separable Costs 550,000 125,000 625,000 1,300,000
Total cost 2,327,202 941,062 1,531,736 4,800,000
Gross Margin 672,798$ 308,938$ 343,264$ 1,325,000$
processed further, one could argue for the sales value at split-off method.
Chapter 7 - Cost Allocation: Departments, Joint Products, and By-Products
7-59
7-46 Joint Products; By-Products (Appendix) (50 min)
1. The relative sales value method of joint cost allocation assigns
cost in proportion to each product's sales value to the sales value of
all products. If there is no sales value at split-off, then the value at
the first sales point less separable costs is used. If joint products
have a sales value at the split-off point, the margin for all joint
products at the split-off point will be the same.
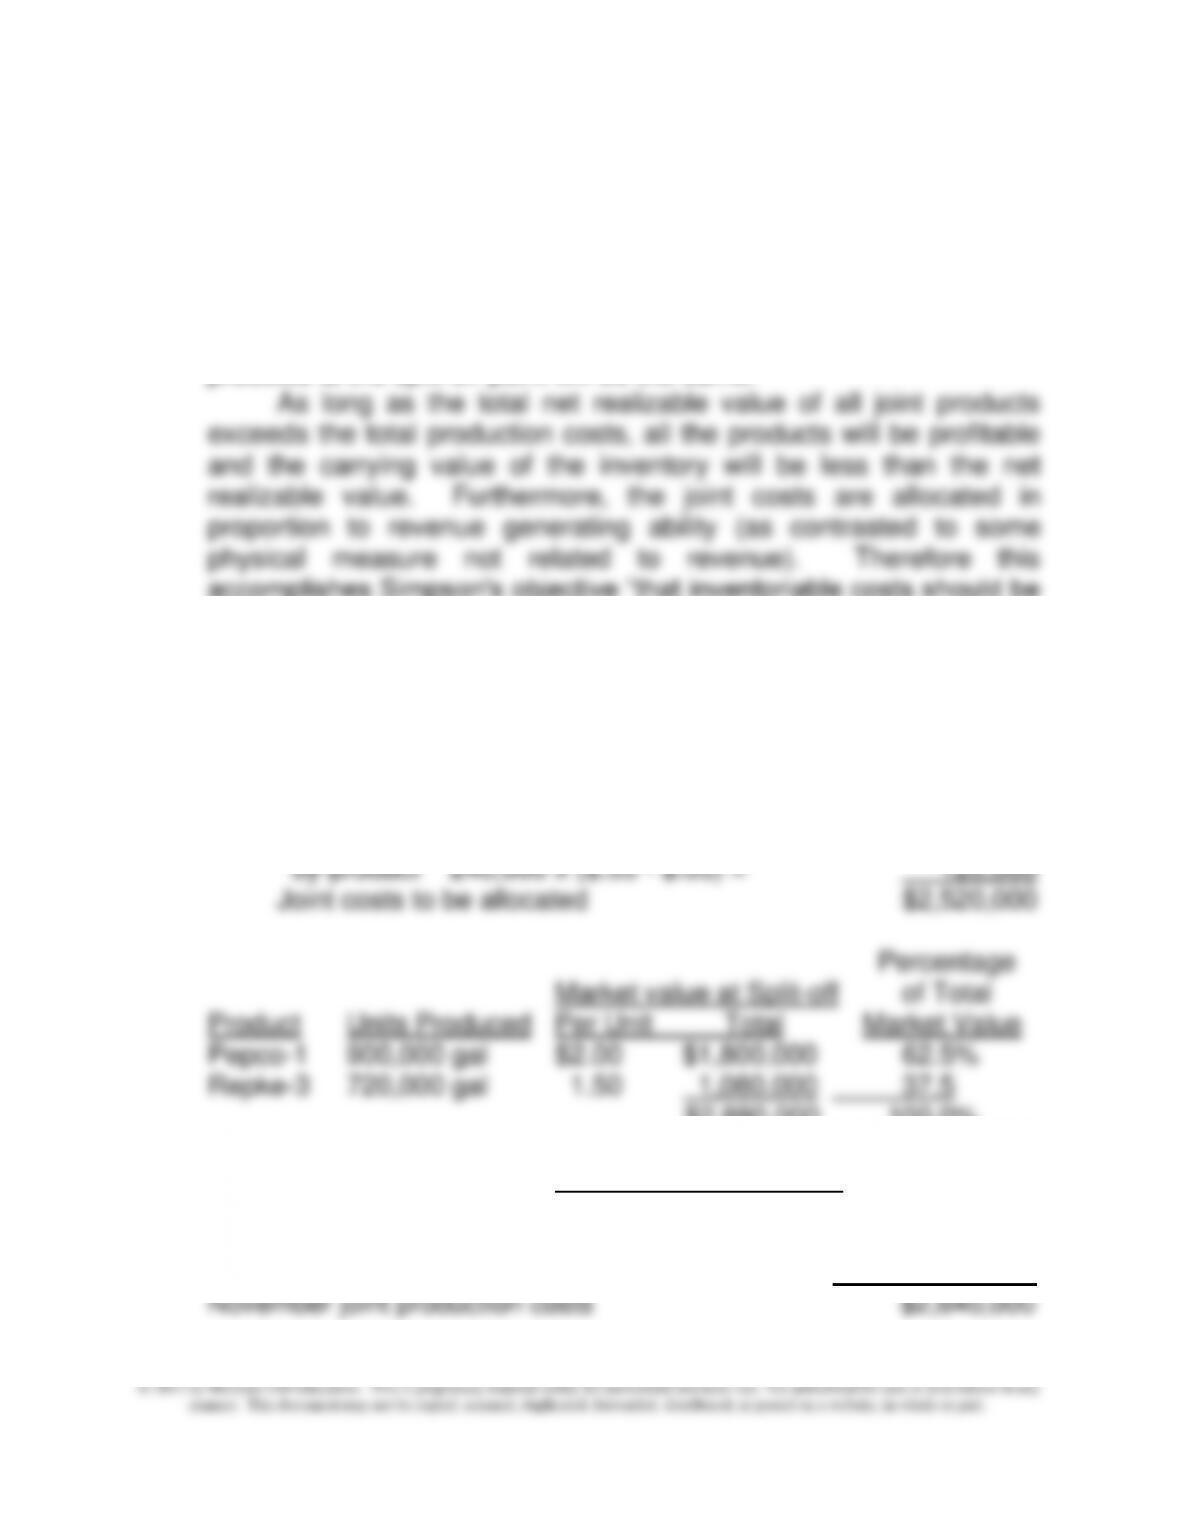
accomplishes Simpson's objective “that inventoriable costs should be
based on each product's ability to contribute to the recovery of joint
production costs.”
2. Because both main products have a market value at the split-off
point, this value is used to allocate the joint cost rather than the final
sales value.
Joint production costs to be allocated $2,640,000
Less net realizable value of
$2,880,000 100.0%
Allocation of Joint Costs
Pepco-1 ($2,520,000 x .625) $1,575,000
Repke-3 ($2,520,000 x .375) 945,000
SE-5 120,000
Chapter 7 - Cost Allocation: Departments, Joint Products, and By-Products
7-60
7-46 (continued -1)
By-Product
Pepco-1 Repke-3 SE-5 Total
Units Sold 800,000 700,000 200,000 1,700,000
Units Produced 900,000 720,000 240,000 1,860,000
Final Sales Price 5.00$ 4.00$
Sales Price at Split-off 2.00$ 1.50$ 0.55$
Sales Value at Split-off 1,800,000$ 1,080,000$ 132,000$
Sales Value of Joint Products 1,800,000$ 1,080,000$ -$ 2,880,000$
Less: Separable costs 1,800,000 720,000 -
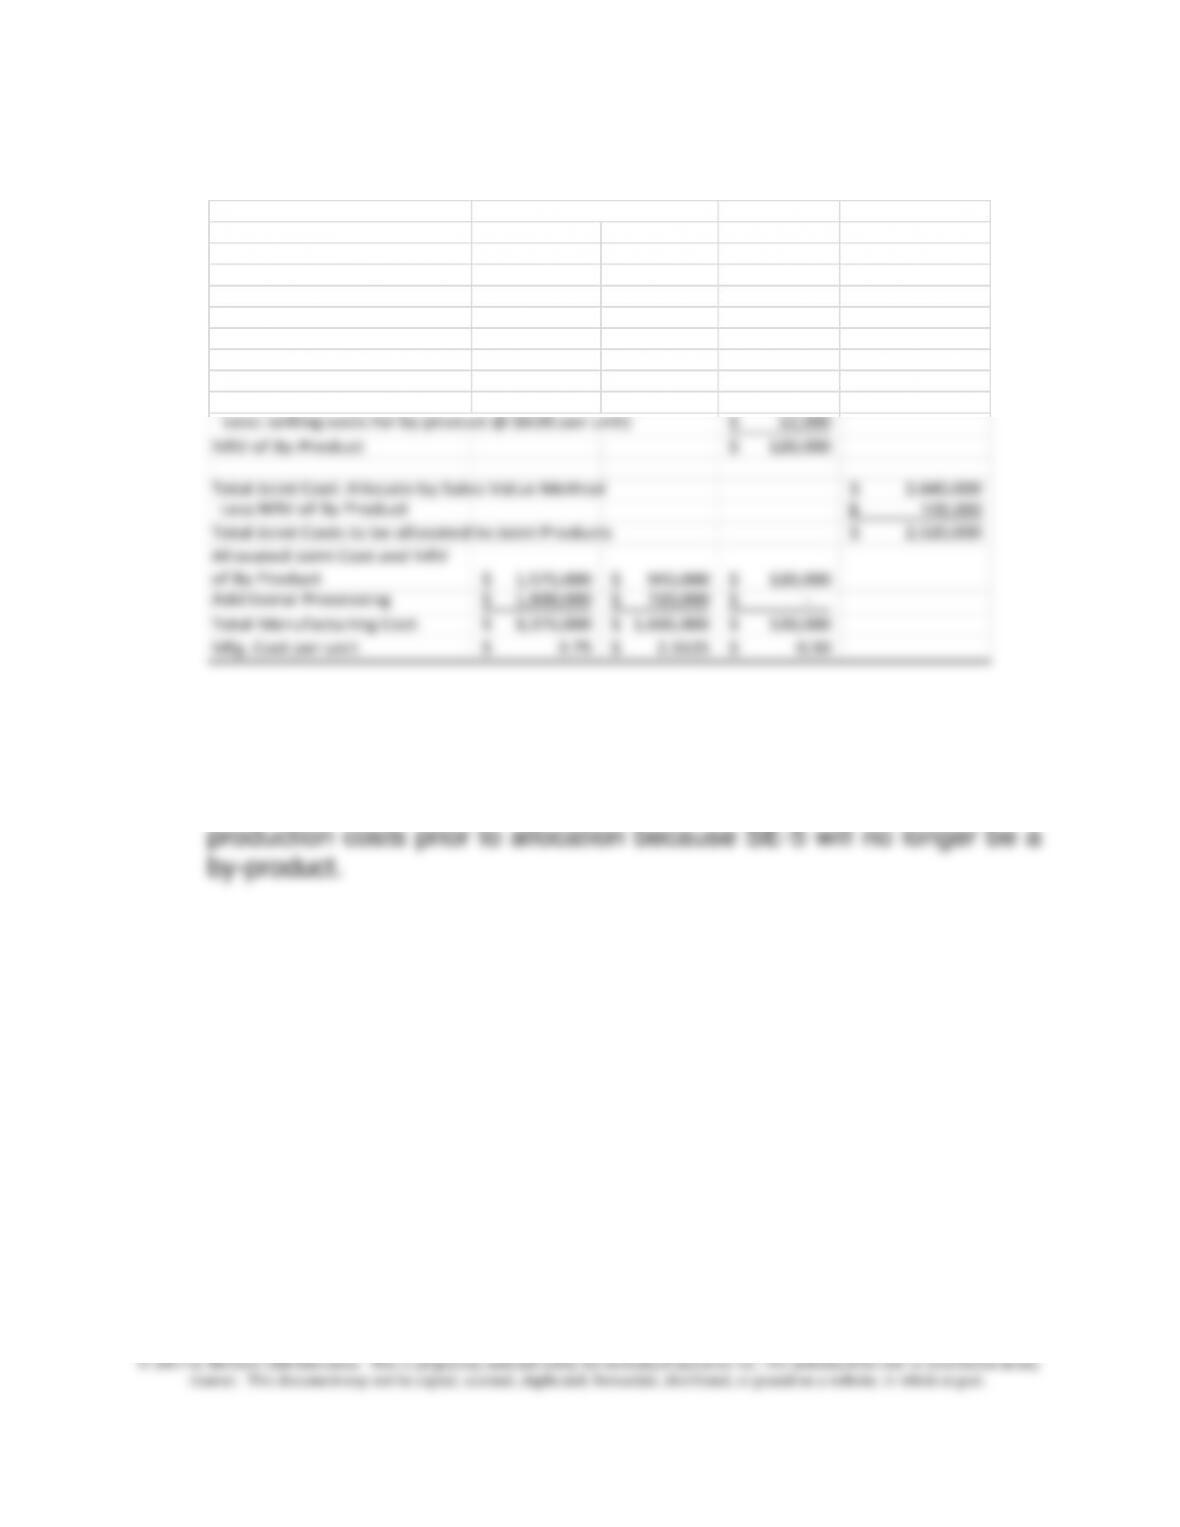
Net Realizable Value (NRV) 132,000$
Less: selling costs for by product @ $0.05 per unit) 12,000$
NRV of By-Product 120,000$
Total Joint Cost: Allocate by Sales Value Method 2,640,000$
Less NRV of By Product 120,000$
Total Joint Costs to be allocated to Joint Products 2,520,000$
Allocated Joint Cost and NRV
of By Product
1,575,000$ 945,000$ 120,000$
Additional Processing 1,800,000$ 720,000$ -$
Total Manufacturing Cost 3,375,000$ 1,665,000$ 120,000$
Mfg. Cost per unit 3.75$ 2.3125$ 0.50$
Joint Products
3. When SE-5 becomes a main product, the joint production costs
would be proportionally allocated to all three products on the basis of
the sales value of each product at the split-off point. The net
realizable value of SE-5 will no longer be deducted from the joint
Chapter 7 - Cost Allocation: Departments, Joint Products, and By-Products
7-61
7-47 Joint Products (40 min)
1. Because by-products are assigned an inventory cost equal to their
net realizable value (NRV) at the time they are produced, the NRV of
M-13 must be deducted from the joint production costs prior to
allocation. The allocation of Texchem’s November joint production
costs would be $1,319,553 to PX-105, $425,447 to GZ-233, and
$55,000 to M-13, as calculated below.
By-Product
PX-105 GZ-233 M-13 Total
Units Sold 450,000 225,000 50,000 725,000
Units Produced 600,000 300,000 100,000 1,000,000
Sales Price at Split-off 2.00$ 4.00$ 0.70$
Separable Processing Costs 550,000 633,000
Final Sales Price 8.50 7.00 -
Sales Value of By-Product 70,000
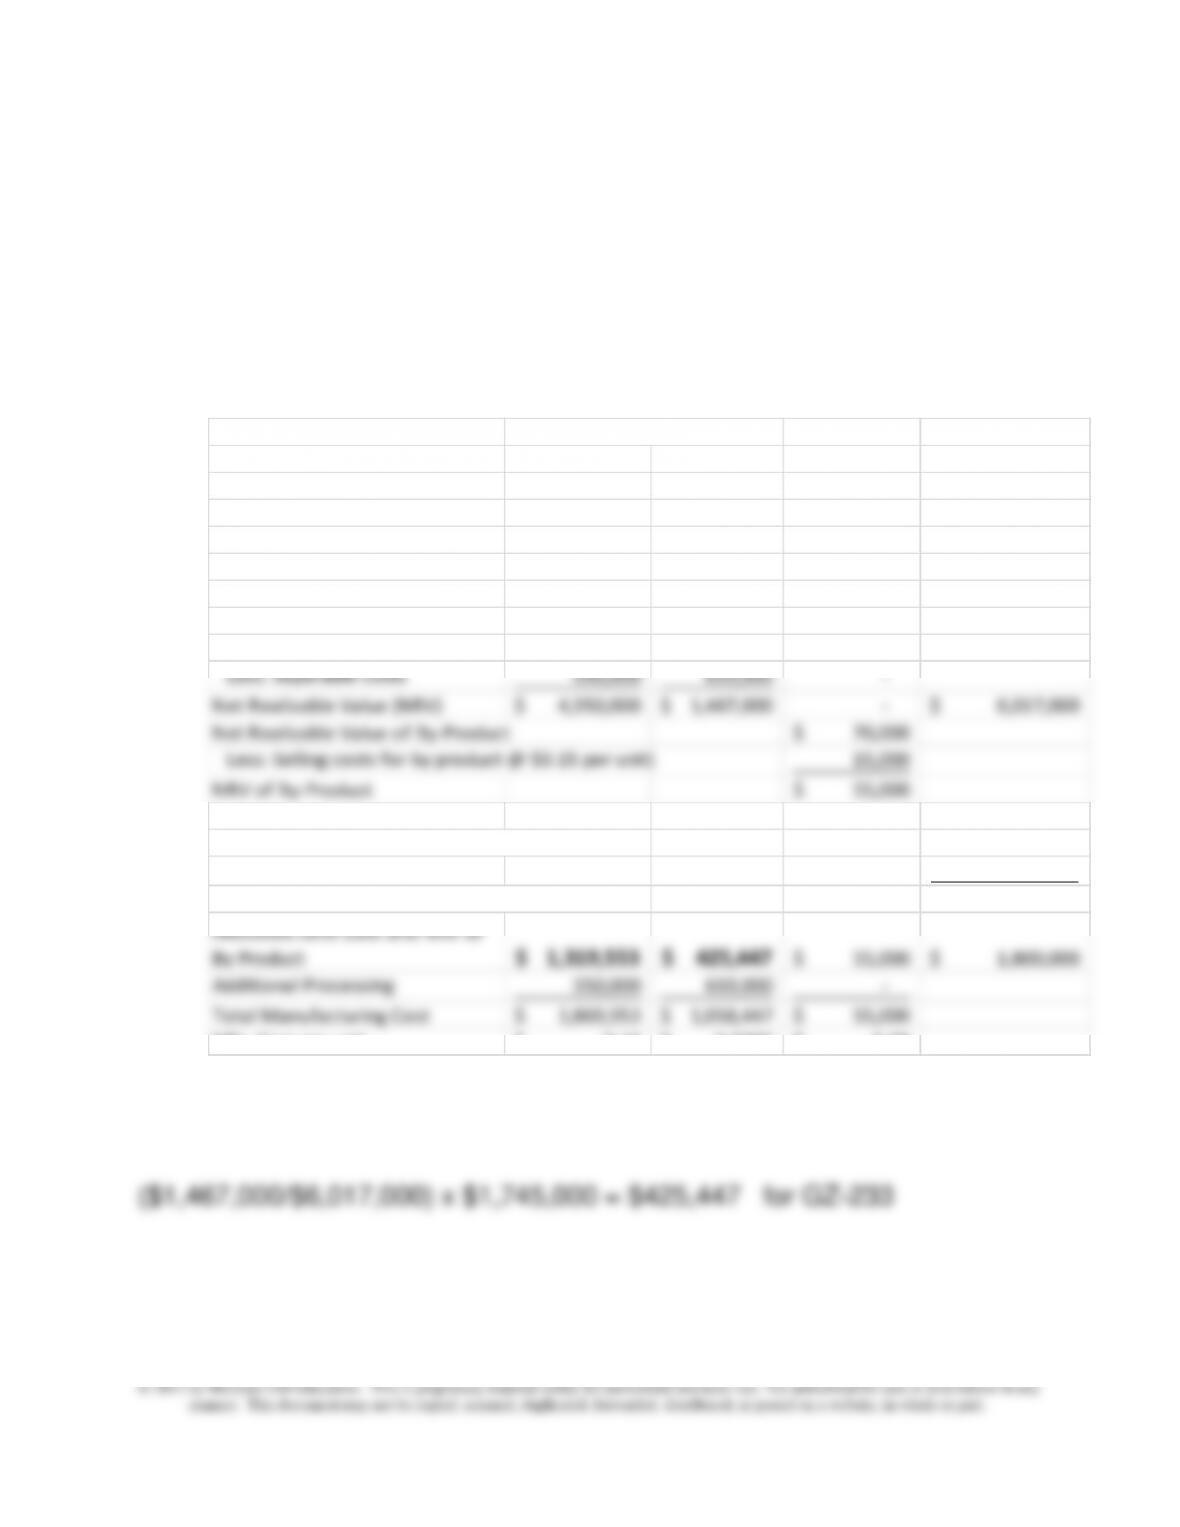
Sales Value of Joint Products 5,100,000 2,100,000 - 7,200,000
Less: Separable costs 550,000 633,000 -
Net Realizable Value (NRV) 4,550,000$ 1,467,000$ - 6,017,000$
Net Realizable Value of By-Product 70,000$
Less: Selling costs for by product @ $0.15 per unit) 15,000
NRV of By-Product 55,000$
Total Joint Cost: Allocate by Sales Value Method 1,800,000$
Less NRV of By Product 55,000
Total Joint Costs to be allocated to Joint Products 1,745,000$
Allocated Joint Cost and NRV of
By Product
1,319,553$ 425,447$ 55,000$ 1,800,000$
Additional Processing 550,000 633,000 -
Total Manufacturing Cost 1,869,553$ 1,058,447$ 55,000$
Mfg. Cost per unit 3.12$ 3.5282$ 0.55$
Joint Products
Calculation of Joint Cost Allocation for Joint Products:
($4,550,000/$6,017,000) x $1,745,000 = $1,319,553 for PX-105
7-62
7-47 (continued -1)
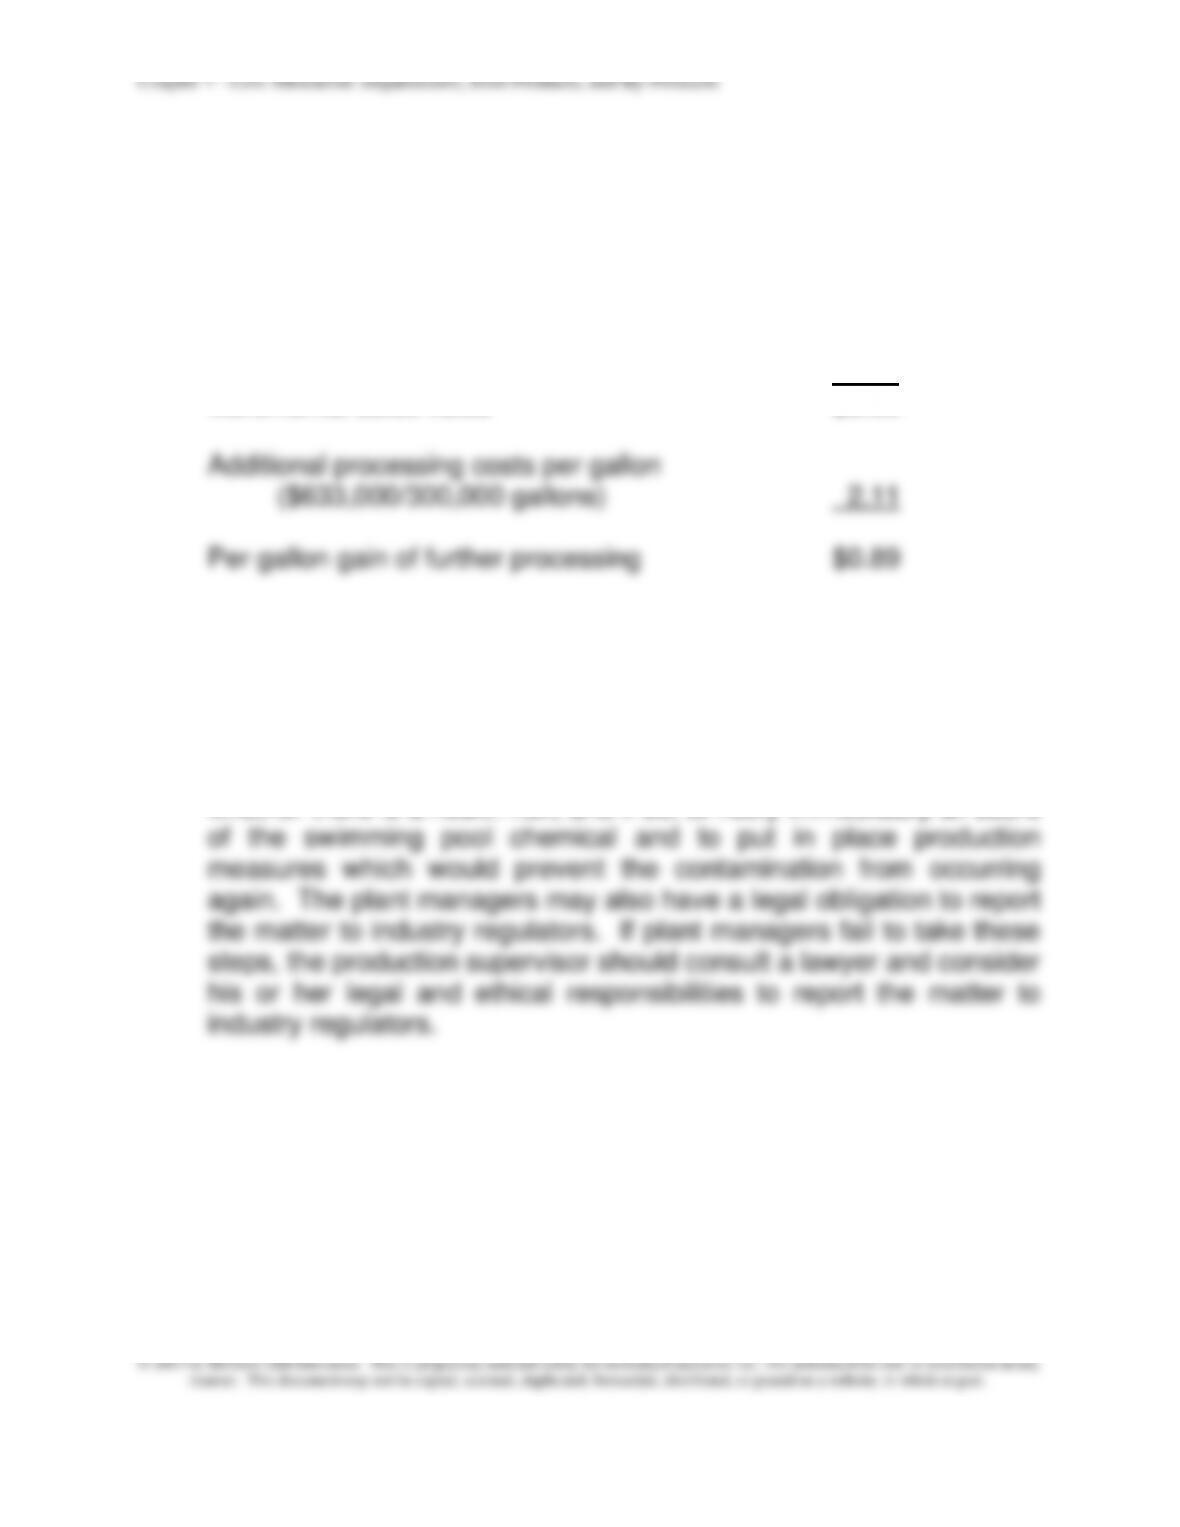
2. Texchem should sell GZ-233 after additional processing as the
incremental revenue of the sales beyond the split-off point is greater
than the incremental cost of further processing.
Per gallon sales value beyond the split-off point $7.00
Per gallon sales value at the split-off point 4.00
Incremental sales value $3.00
3. There is a clear ethical issue here, as the pesticide, GZ-233, may
have contaminated the swimming pool chemical, PX-105, thus
representing a health hazard to humans. The first step for the
production supervisor is to notify plant management. An appropriate
response by plant managers would be to immediately determine
whether there is a health risk, and if so, to notify immediately all users
7-63
7-48 Joint Products; By-Products; Appendix (40 min)
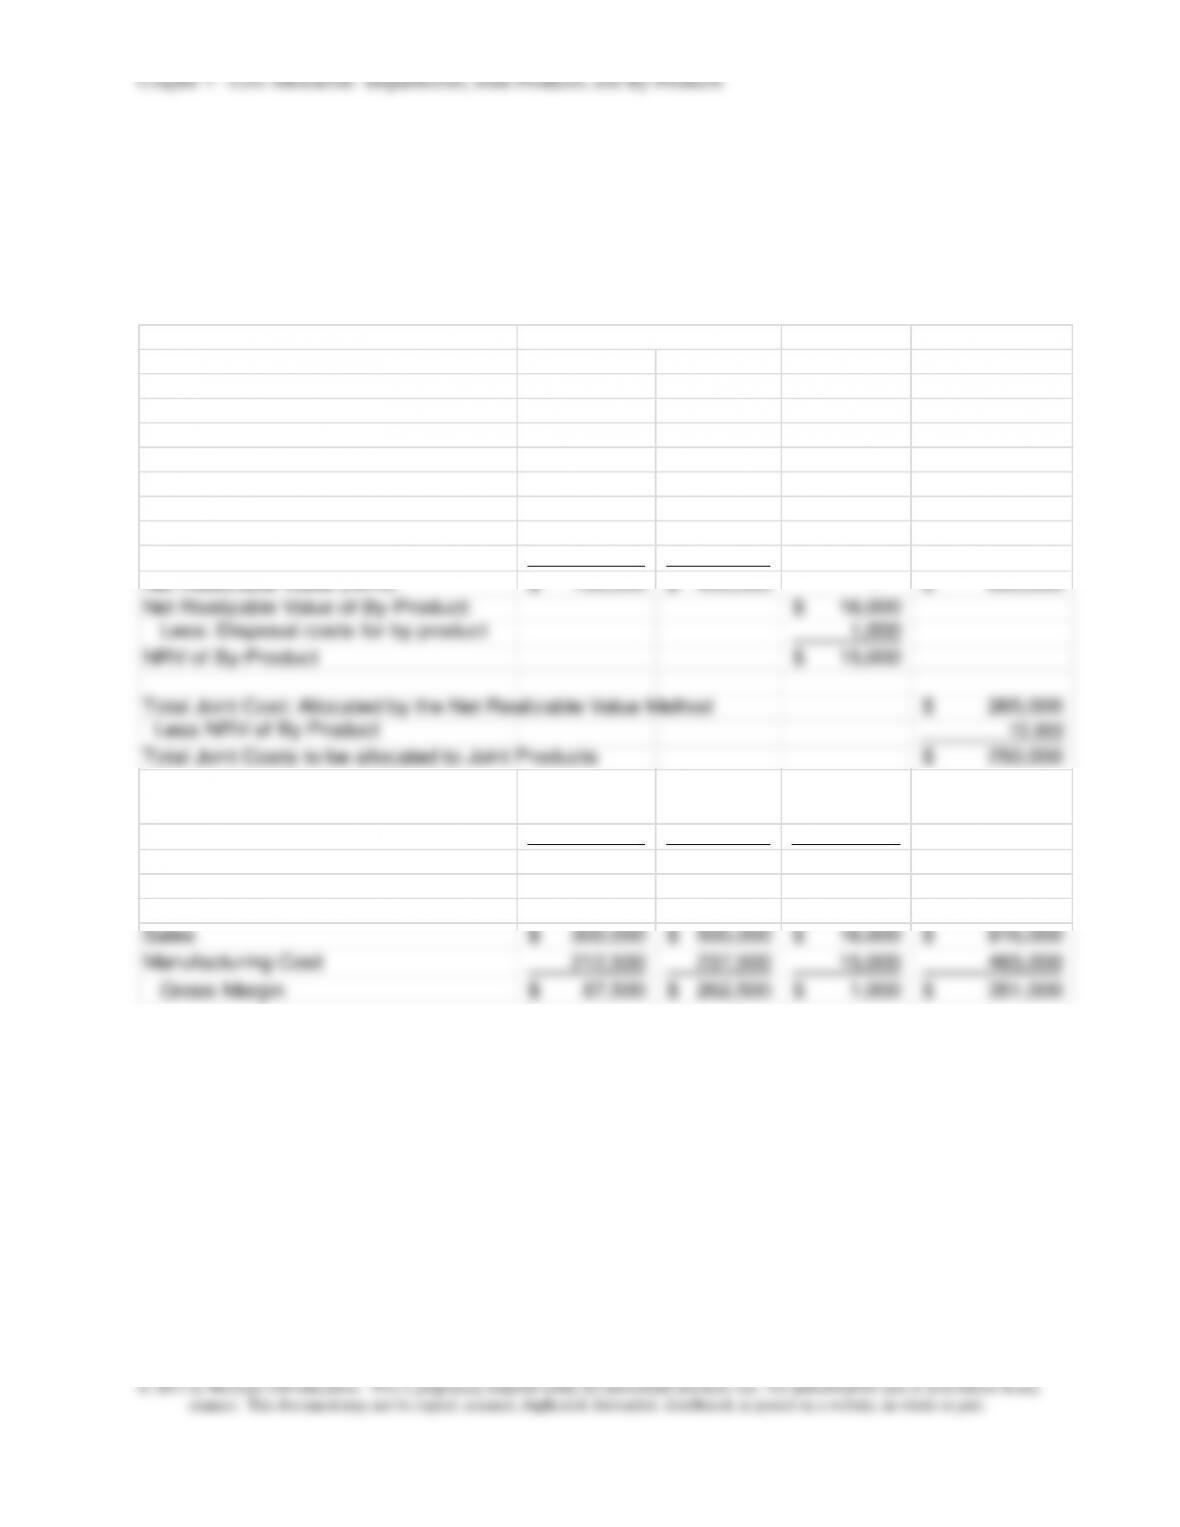
1.,2. Note that the distinction between variable and fixed separable
processing costs is irrelevant for the solution of the problem. The total
separable processing cost is used to solve for NRV.
By-Product
Ying Yang Bit Total
Units Sold 50,000 40,000 10,000 100,000
Units Produced 50,000 40,000 10,000 100,000
Separable Processing Costs - Variable 140,000$ 42,000$ -$ 182,000
Separable Processing Costs - Fixed 10,000 8,000 - 18,000
Sales Price 6.00 12.50 1.60
Sales Value of By-Product 16,000
Sales Value of Joint Products 300,000 500,000 800,000
Less: Separable costs 150,000 50,000 - 200,000
Net Realizable Value (NRV) 150,000$ 450,000$ - 600,000$
Net Realizable Value of By-Product: 16,000$
Less: Disposal costs for by product 1,000
NRV of By-Product 15,000$
Total Joint Cost: Allocated by the Net Realizable Value Method 265,000$
Less NRV of By Product 15,000
Total Joint Costs to be allocated to Joint Products 250,000$
Allocated Joint Cost and NRV of By
Product
62,500$ 187,500$ 15,000$ 265,000$
Separable Processing 150,000 50,000 -
Total Manufacturing Cost 212,500$ 237,500$ 15,000$ 465,000$
Mfg. Cost per unit 4.25$ 5.9375$ 1.50$
Sales 300,000$ 500,000$ 16,000$ 816,000$
Manufacturing Cost 212,500 237,500 15,000 465,000
Gross Margin 87,500$ 262,500$ 1,000$ 351,000$
Joint Products
Chapter 7 - Cost Allocation: Departments, Joint Products, and By-Products
7-64
7-49 Joint Products (35 min)
Note: the information on number of customers is irrelevant
1.a. The Physical Unit Method
First, summarize the data and determine sales value:
Y64 G22 X17 Total
Price (after addt'l processing) 10.50$ 6.75$ 4.22$
Gallons Produced and Sold 22,000 45,500 18,000 85,500
Separable Processing cost 65,500$ 34,250$ 55,400$ 155,150$
Sales Price at Split-off 2.24 2.88 0.44
Sales Value (after addt'l processing) 231,000 307,125 75,960 614,085
Next, determine the cost allocation and gross margin:
Y64 G22 X17 Total
Units of Production 22,000 45,500 18,000 85,500
Percent of Total 25.7310% 53.2164% 21.0526% 100%
Joint Cost Allocation 91,602$ 189,450$ 74,947$ 356,000$
Separable Processing cost 65,500 34,250 55,400 155,150$
Total Cost 157,102$ 223,700$ 130,347$
Total Cost per unit 7.141$ 4.916$ 7.242$
Calculation of Gross Margin
Sales 231,000$ 307,125$ 75,960$ 614,085$
Cost of Goods Sold
Allocated Joint Cost 91,602 189,450 74,947 356,000$
Separable Costs 65,500 34,250 55,400 155,150
$
Total Cost 157,102 223,700 130,347 511,150
$
Gross Margin 73,898$ 83,425$ (54,387)$ 102,935$
Chapter 7 - Cost Allocation: Departments, Joint Products, and By-Products
7-65
7-49 (continued -1)
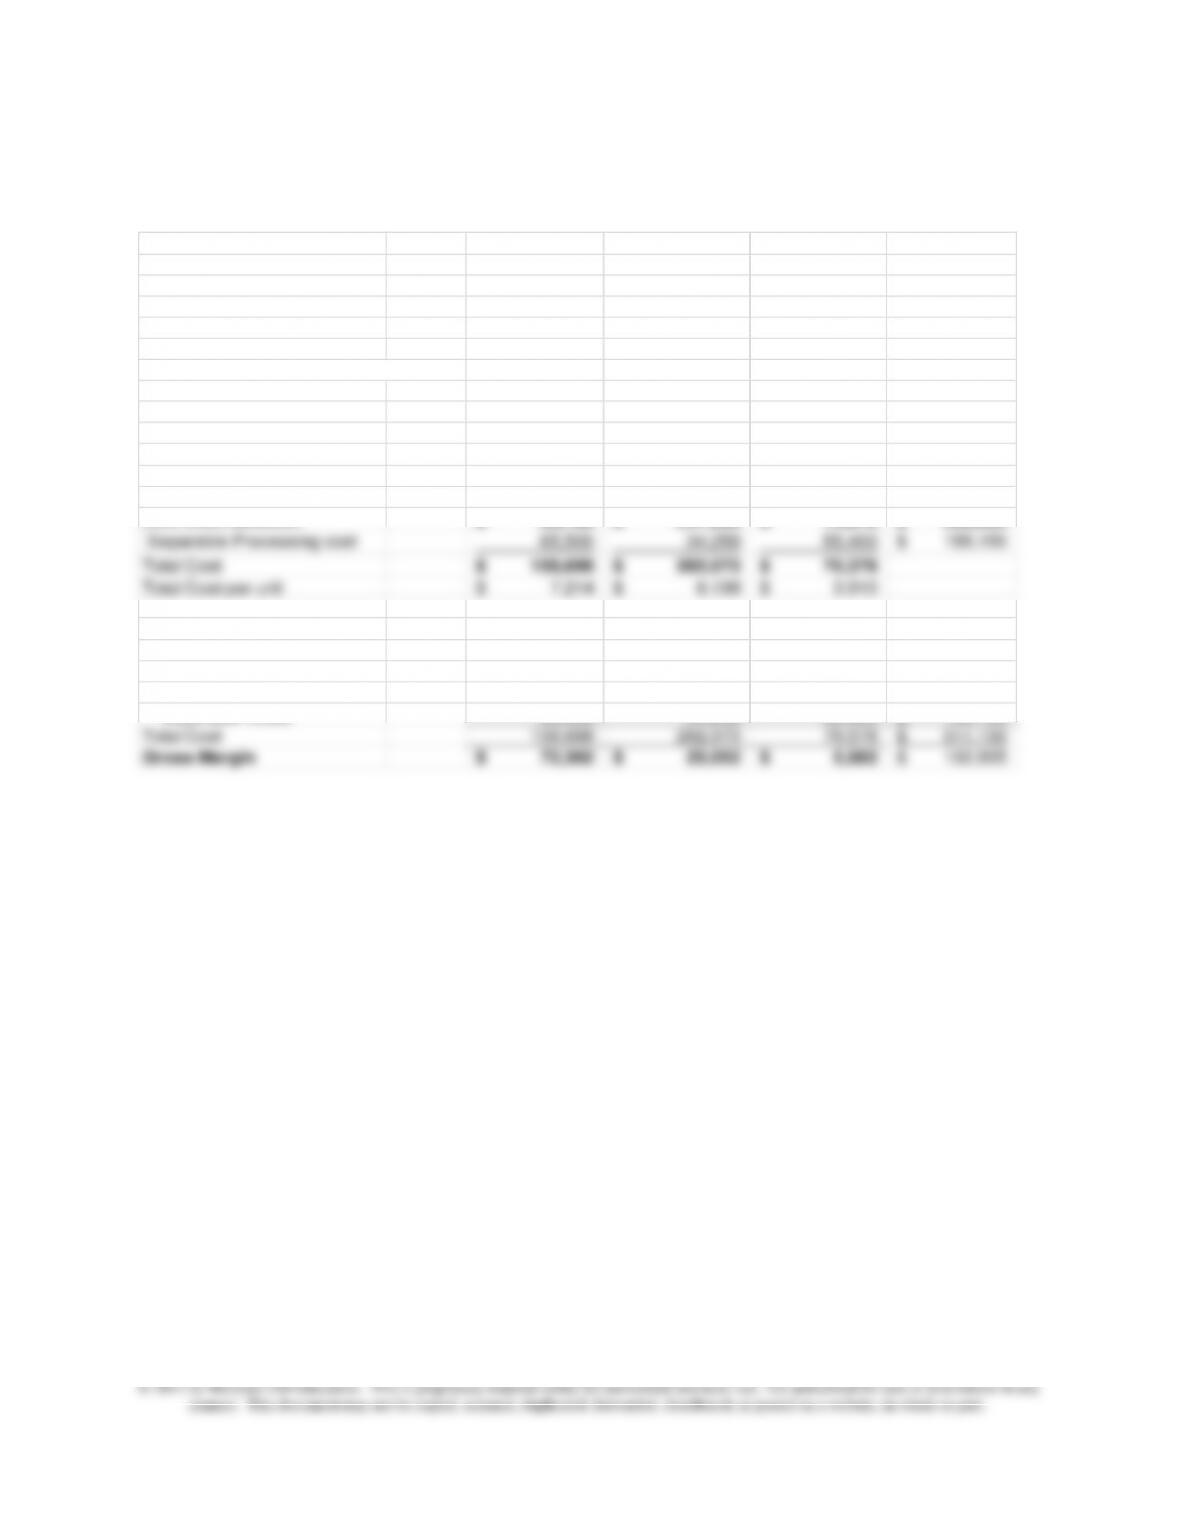
1.b The Sales Value at Split Off Method
Y64 G22 X17 Total
Price (after addt'l processing) 10.50$ 6.75$ 4.22$ -$
Separable Processing cost 65,500$ 34,250$ 55,400$ 155,150$
Gallons Produced and Sold 22,000 45,500 18,000 85,500
Total Joint Cost -$ -$ -$ 356,000$
Sales Price at Split-off 2.24 2.88 0.44 -
Sales Value (after addt'l processing) 231,000 307,125 75,960 614,085
Sales Value at Split Off 49,280 131,040 7,920 188,240
Y64 G22 X17 Total
Sales Value at Split Off 49,280$ 131,040$ 7,920$ 188,240$
Percent of Total 26.1793% 69.6133% 4.2074% 100%
Joint Cost Allocation 93,198$ 247,823$ 14,978$ 356,000$
Separable Processing cost 65,500 34,250 55,400 155,150$
Total Cost 158,698$ 282,073$ 70,378$
Total Cost per unit 7.214$ 6.199$ 3.910$
Calculation of Gross Margin
Sales 231,000$ 307,125$ 75,960$ 614,085$
Cost of Goods Sold
Allocated Joint Cost 93,198 247,823 14,978 356,000$
Separable Costs 65,500 34,250 55,400 155,150$
Total Cost 158,698 282,073 70,378 511,150
$
Gross Margin 72,302$ 25,052$ 5,582$ 102,935$
Chapter 7 - Cost Allocation: Departments, Joint Products, and By-Products
7-66
7-49 (continued -2)
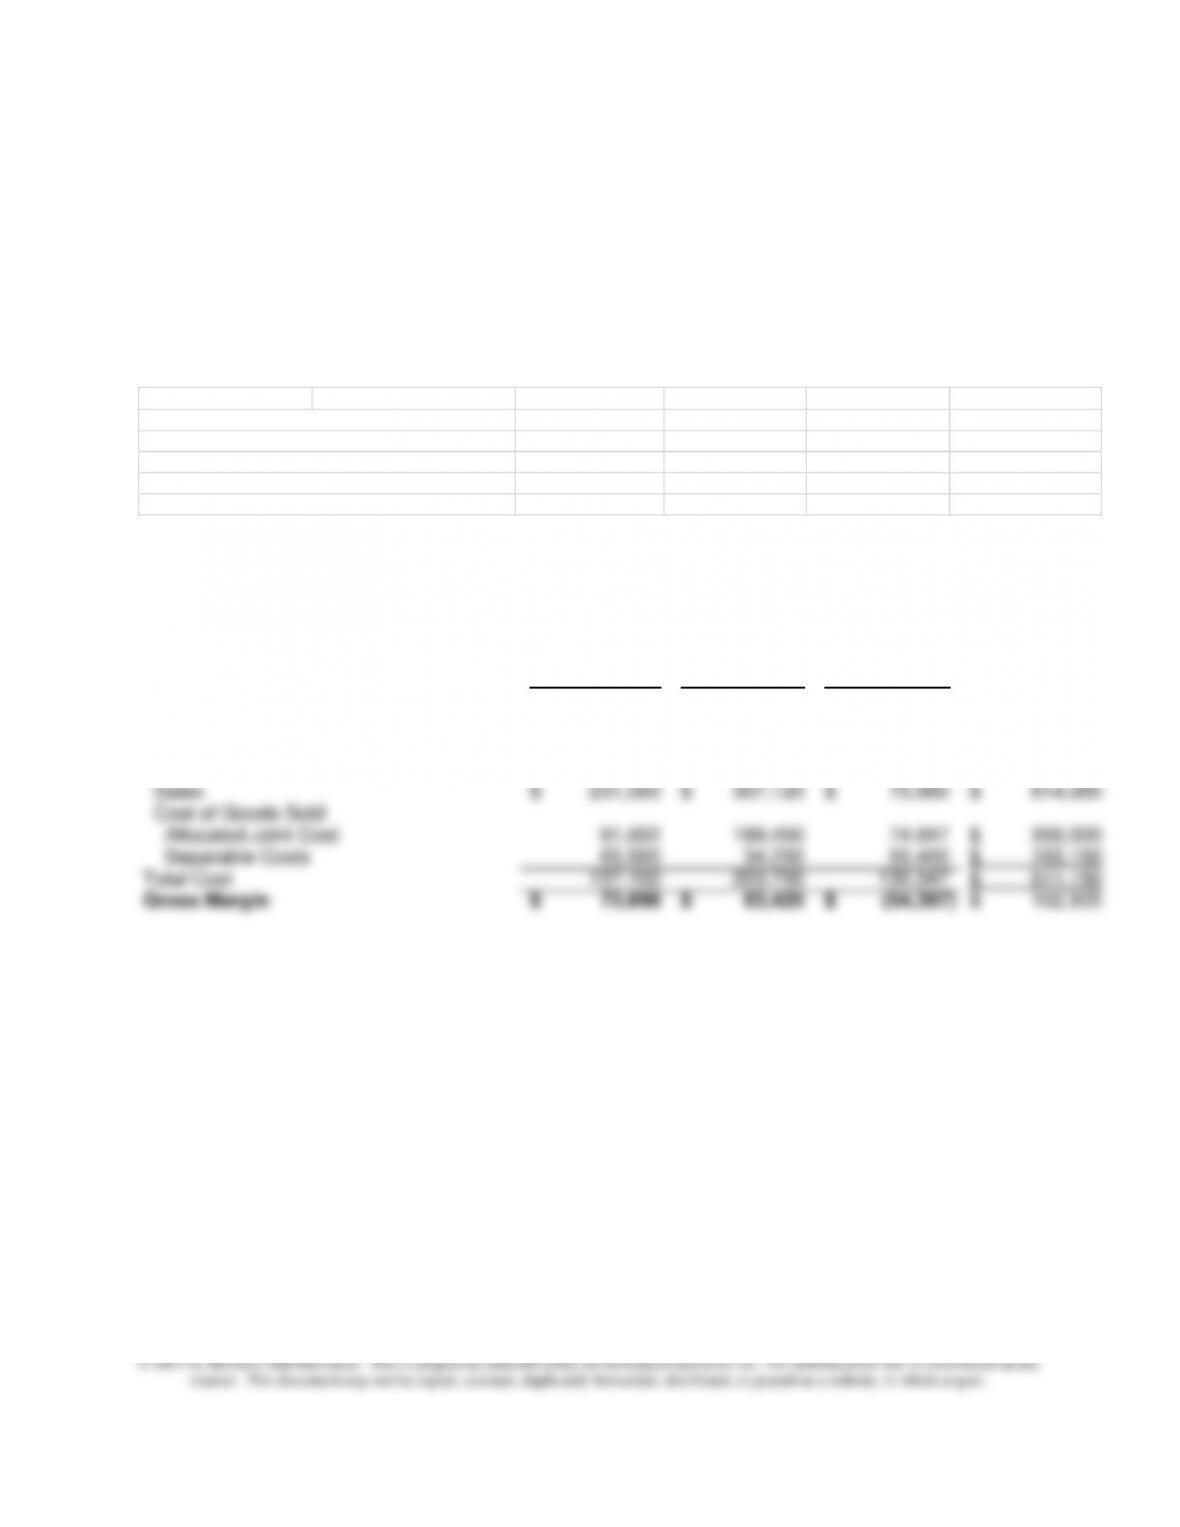
1.c. The Net Realizable Value Method
Y64 G22 X17 Total
Price (after addt'l processing) 10.50$ 6.75$ 4.22$
Separable Processing cost 65,500$ 34,250$ 55,400$ 155,150$
Gallons Produced and Sold 22,000 45,500 18,000 85,500
Total Joint Cost 356,000$
Sales Value (after addt'l processing) 231,000$ 307,125$ 75,960$ 614,085$
Y64 G22 X17 Total
Sales Value of Production 231,000$ 307,125$ 75,960$ 614,085
Less: Separable Costs 65,500 34,250 55,400 155,150
Net Realizable Value 165,500 272,875 20,560 458,935
Percent of Total NRV 36.0618% 59.4583% 4.4799% 100%
Allocated Joint Cost 128,380 211,672 15,949 356,000
Separable Processing cost 65,500$ 34,250$ 55,400$ 155,150$
Total Cost 193,880 245,922 71,349
Total Cost per unit 8.813$ 5.405$ 3.964$
Calculation of Gross Margin
Sales 231,000$ 307,125$ 75,960$ 614,085$
Cost of Goods Sold
Allocated Joint Cost 128,380 211,672 15,949 356,000
Separable Costs 65,500 34,250 55,400 155,150
7-67
7-49 (continued-3)
2. The Net Realizable Value Method is preferred because it takes into
account the value of the product after separable costs. Note that the
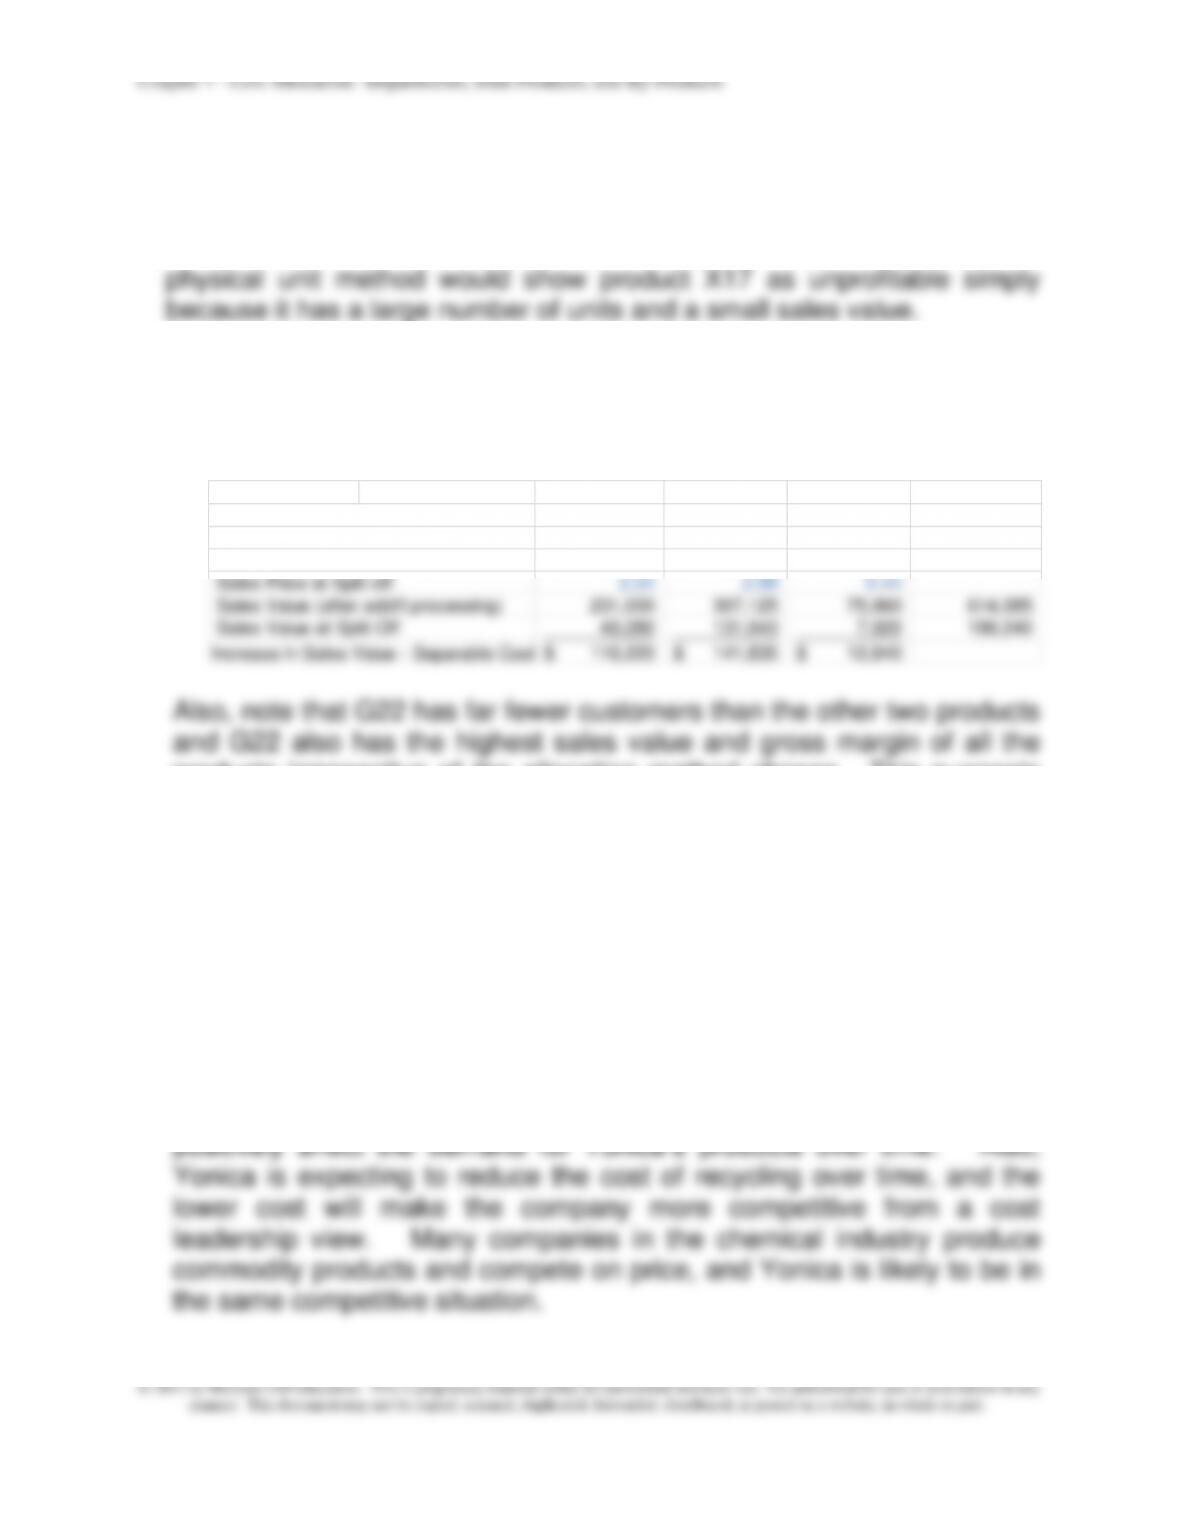
3. The increase in sales value after additional processing cost is greater
than the additional processing costs for all three products, so that
Yonica has the correct policy in processing all products to the final sales
value.
Y64 G22 X17 Total
Price (after addt'l processing) 10.50$ 6.75$ 4.22$
Gallons Produced and Sold 22,000 45,500 18,000 85,500
Separable Processing cost 65,500$ 34,250$ 55,400$ 155,150$
Sales Price at Split-off 2.24 2.88 0.44
Sales Value (after addt'l processing) 231,000 307,125 75,960 614,085
Sales Value at Split Off 49,280 131,040 7,920 188,240
Increase in Sales Value - Separable Cost
116,220$ 141,835$ 12,640$
Also, note that G22 has far fewer customers than the other two products
and G22 also has the highest sales value and gross margin of all the
products irrespective of the allocation method chosen. This suggests
that an examination of downstream costs, the selling and distribution
costs which are not included in this example, might reveal that Y64 and
X17 are not profitable or only marginally profitable on full life-cycle cost
basis.
4. Yonica’s strategy is based on environmentally friendly policies, and
the odds are that the company’s customers will increasingly seek out
companies, like Yonica, that produce environmentally friendly products.
Consumers are aware of the environmental costs of certain products,
especially those in the chemical industry, so that this is likely to
Chapter 7 - Cost Allocation: Departments, Joint Products, and By-Products
7-68
7-49 (continued – 4)
5. The key global issues for Yonica include the strategic decisions
regarding the sourcing of its raw materials, the purchase and
transportation costs of the raw materials, together with the potential
environmental risks associated with transporting the material. Other
6. Yonica has a good position in sustainability because the company’s
business model it based on recycling waste chemicals. To improve
this position, Yonica should look for ways to reduce the energy use and
Chapter 7 - Cost Allocation: Departments, Joint Products, and By-Products
7-69
7-50 Joint Cost Allocation: Managerial Incentives (15 min)
The use of total production to allocate the cost of the insurance does satisfy
the objective of fairness – the larger plants pay more. But it does not
provide much of a desired incentive – to reduce accidents, as Mike points
out. However, his suggestion is simply another measure of size, in this
case number of personnel, and it would probably have very nearly the
same effect on allocation as the use of total output.
Alternatively, the allocation could be based on the number of accidents –
those plants with more accidents pay more of the insurance bill. This basis
type and efficiency, there is also a critical need to attend to employee
welfare, and to provide the incentives and the environment that promotes
worker safety.
Based on: David M. Katz, “Cost Allocation Should Spur Safety.” National
Underwriter, November 9, 1998, pp27-30.


