Chapter 7 – Cost Allocation: Departments, Joint Products, and By-Products
7-46
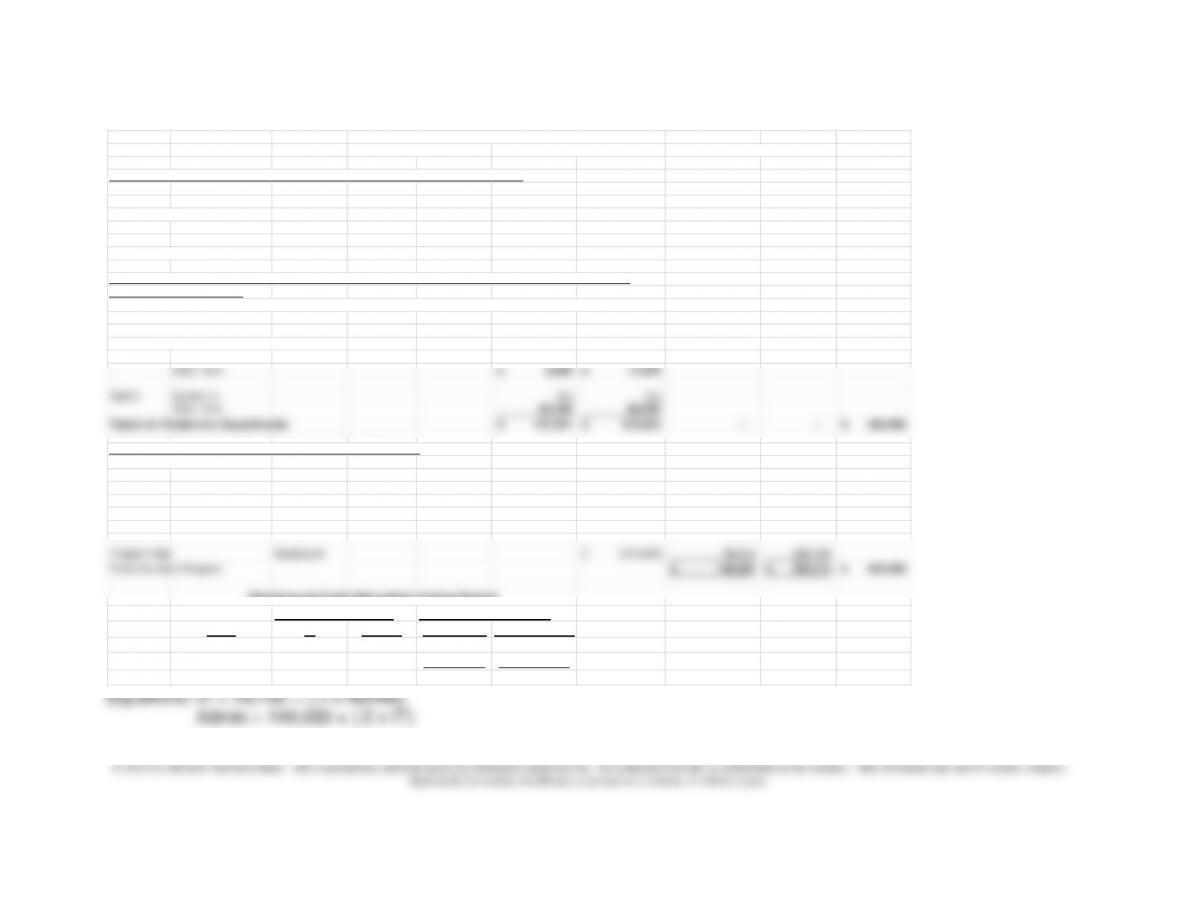
7-40 (continued -2) The Reciprocal Method
Base IT Admin Education Program Mgt Mental Health Housing
Total
FIRST PHASE: Trace Direct Costs and Perform Initial Allocation of Indirect Costs
Direct Costs 6,000$ 122,000$ 100,000$ 190,000$ 418,000$
Indirect Costs: – – – – 0
Dir Labor Hrs 6,250 18,750 12,500 12,500 50,000$
Headcount 2,500 3,750 3,750 5,000 15,000$
Totals for All Departments 14,750$ 144,500$ 116,250$ 207,500$ 483,000$
SECOND PHASE: Reallocate Service Department Costs to Education and Program Mgt Departments:
The Reciprocal Method
First: Solve the simultaneous equations for Service 1 and Service 2: (see Solver Solution Section below)
Amount Allocated from IT 29,795.92$
Amount Allocated from Admin. 150,459.18$
Second: Allocate to Producing Departments:
IT Service % 20% 60%
Alloc. Amt 5,959$ 17,878$
Admin Service % 30% 60%
Alloc. Amt 45,138 90,276
Totals for Production Departments 167,347$ 315,653$ – – 483,000$
THIRD PHASE: Allocate Main Department Costs to Programs
Base: Direct Labor Hours 2,000 2,000 4,000
percent 50% 50%
Headcount 1 3 4
percent 25% 75%
Education Dir Labor Hrs (167,347)$ 83,673$ 83,673$
Program Mgt Headcount (315,653)$ 78,913 236,740
Totals for each Program 162,587$ 320,413$ 483,000$
Admin 150,459 (0.10) 1.00 (15,046) 150,459
14,750 144,500
Departments
Service
Main
Programs
Chapter 7 – Cost Allocation: Departments, Joint Products, and By-Products
7-47
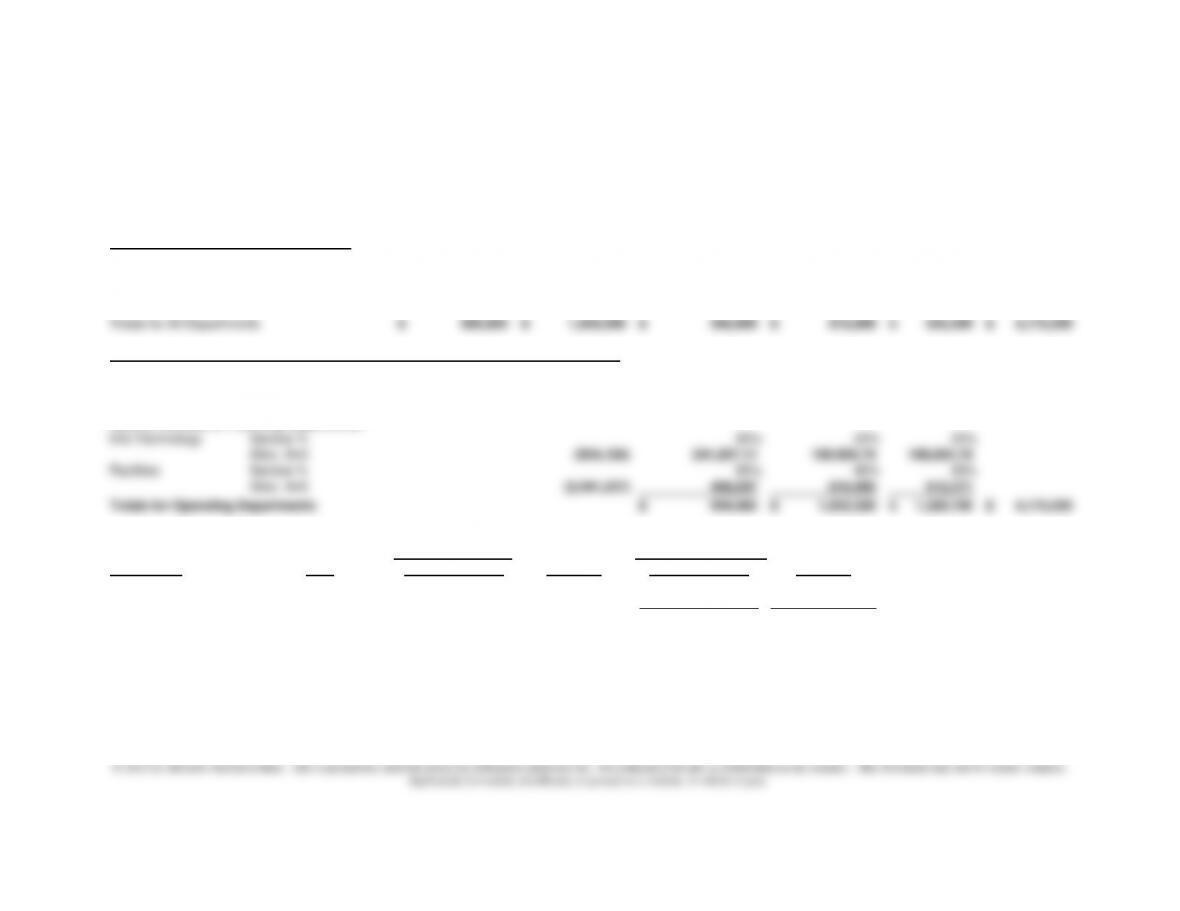
7-41 Departmental Cost Allocation; Insurance Company (40 min)
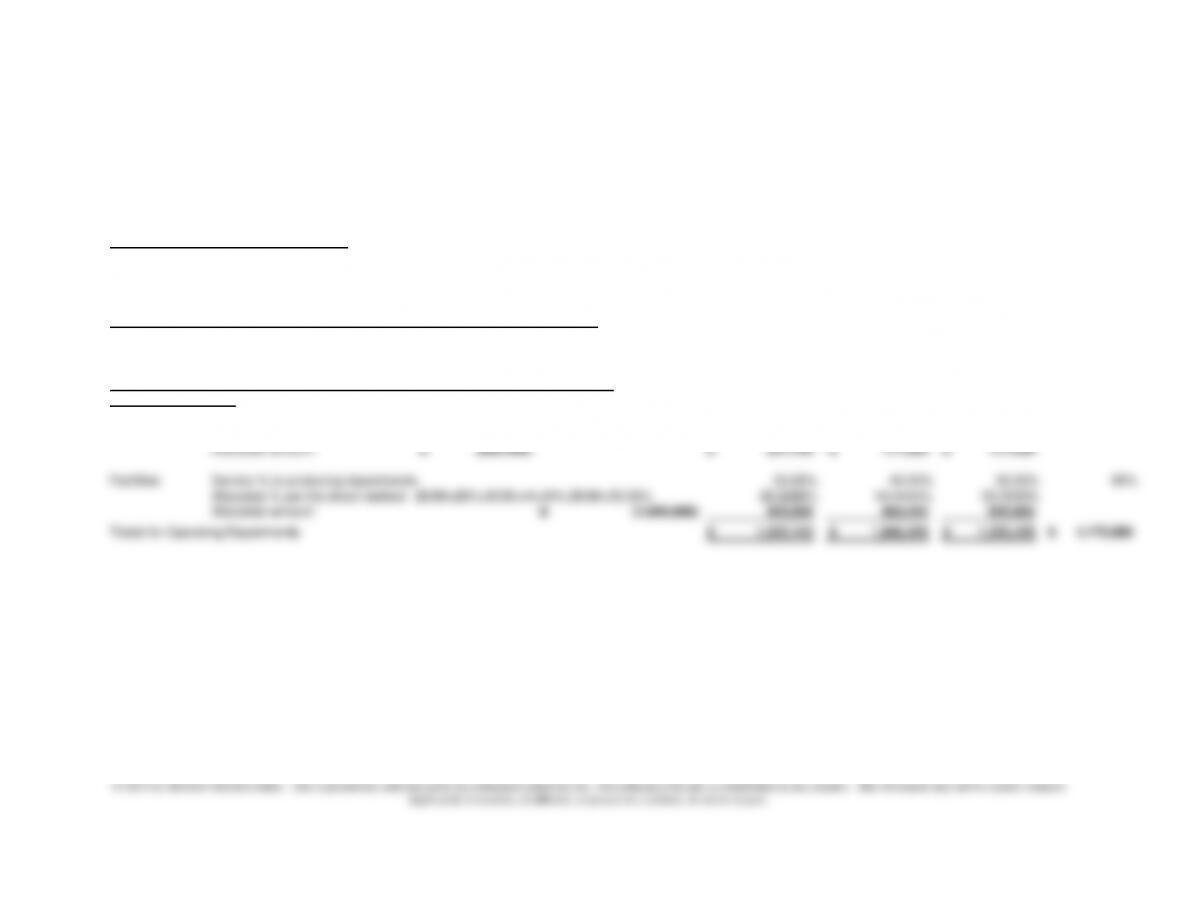
The Direct Method
Info Technology Facilities Claims Process Administration Sales Total
DEPARTMENTAL ALLOCATION BASES
Info Technology percent 30.00% 30.00% 20.00% 20.00% 100%
Facilities percent 10.00% 0.00% 20.00% 40.00% 30.00% 100%
0.3
FIRST PHASE: Trace Direct Costs and Perform Initial Allocation of Indirect Costs
Totals for All Departments
600,000$ 1,800,000$ 345,000$ 875,000$ 555,000$ 4,175,000$
SECOND PHASE: Reallocate Service Department Costs to Operating Departments:
The Direct Method
Info Technology Service % to producing departments 30.00% 20.00% 20.00% 70%
Allocation % per the direct method 30/70=42.86%;20/70=28.57 42.8571% 28.5714% 28.5714%
Allocation amount
(600,000)$ 257,143$ 171,429$ 171,429$
Facilities Service % to producing departments 20.00% 40.00% 30.00% 90%
Allocation % per the direct method 20/80=25%;40/90=44.44%;30/90=33.33% 22.2222% 44.4444% 33.3333%
Allocation amount (1,800,000)$ 400,000 800,000 600,000
Totals for Operating Departments 1,002,143$ 1,846,429$ 1,326,429$ 4,175,000$
Support Departments
Operating Departments
Chapter 7 – Cost Allocation: Departments, Joint Products, and By-Products
7-48
7-41 (continued –1)
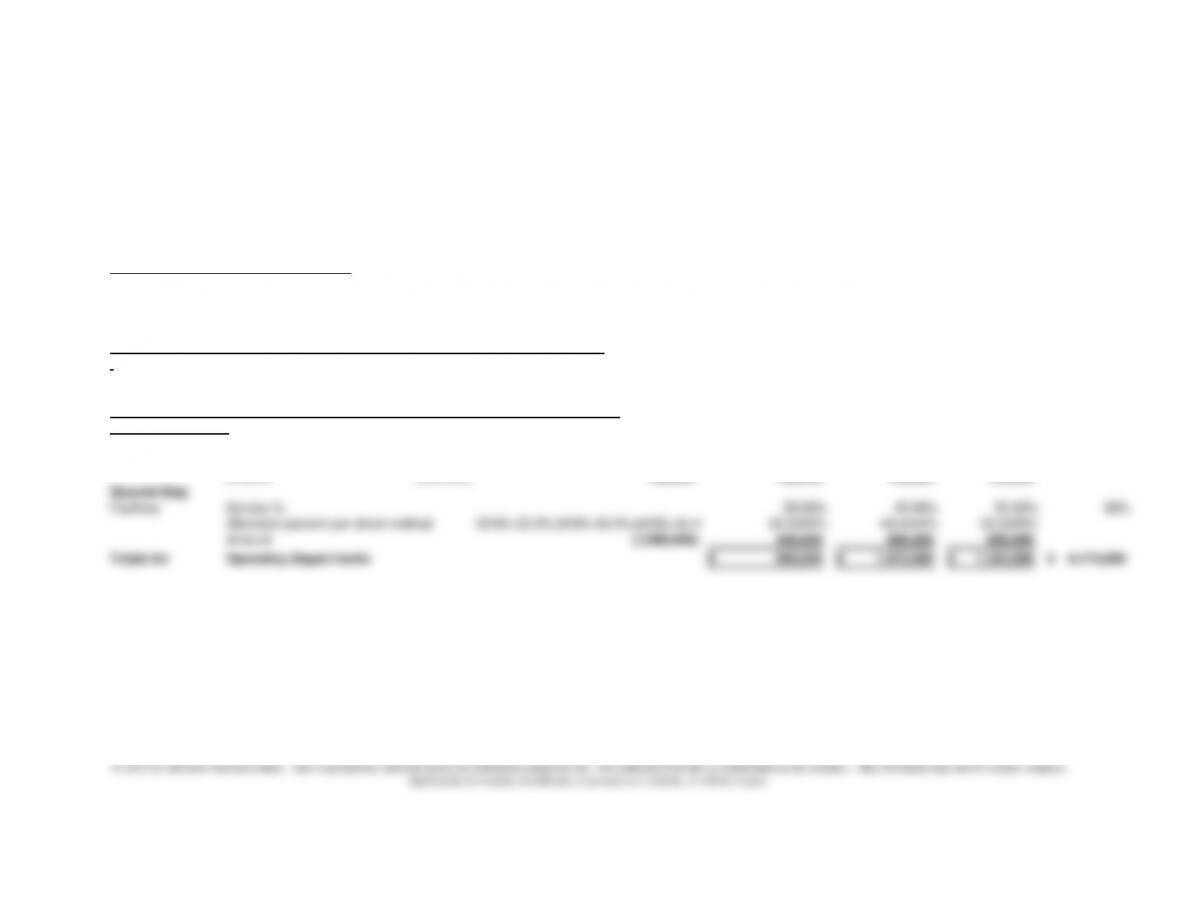
The Step Method (Information Technology First)
Info Technology Facilities Claims Process Administration Sales Total
DEPARTMENTAL ALLOCATION BASES
Info Technology percent 30.00% 30.00% 20.00% 20.00% 100%
Facilities percent 10.00% 0.00% 20.00% 40.00% 30.00% 100%
FIRST PHASE: Trace Direct Costs and Perform Initial Allocation of Indirect Costs
Totals for All Departments
600,000$ 1,800,000$ 345,000$ 875,000$ 555,000$ 4,175,000$
SECOND PHASE: Reallocate Service Department Costs to Operating Departments:
The Step Method
First Step
Info Technology Service % 30.00% 30.00% 20.00% 20.00% 100%
Amount (600,000)
180,000 180,000 120,000 120,000
Second Step
Facilities Service % 20.00% 40.00% 30.00% 90%
Allocation percent per direct method
20/90=22.2%;30/90=33.3%;40/90=44.4%
22.2222% 44.4444% 33.3333%
Amount
(1,980,000) 440,000 880,000 660,000
Totals for Operating Departments 965,000$ 1,875,000$ 1,335,000$ 4,175,000$
Support Departments
Operating Departments
Chapter 7 – Cost Allocation: Departments, Joint Products, and By-Products
7-49
7-41 (continued -2)
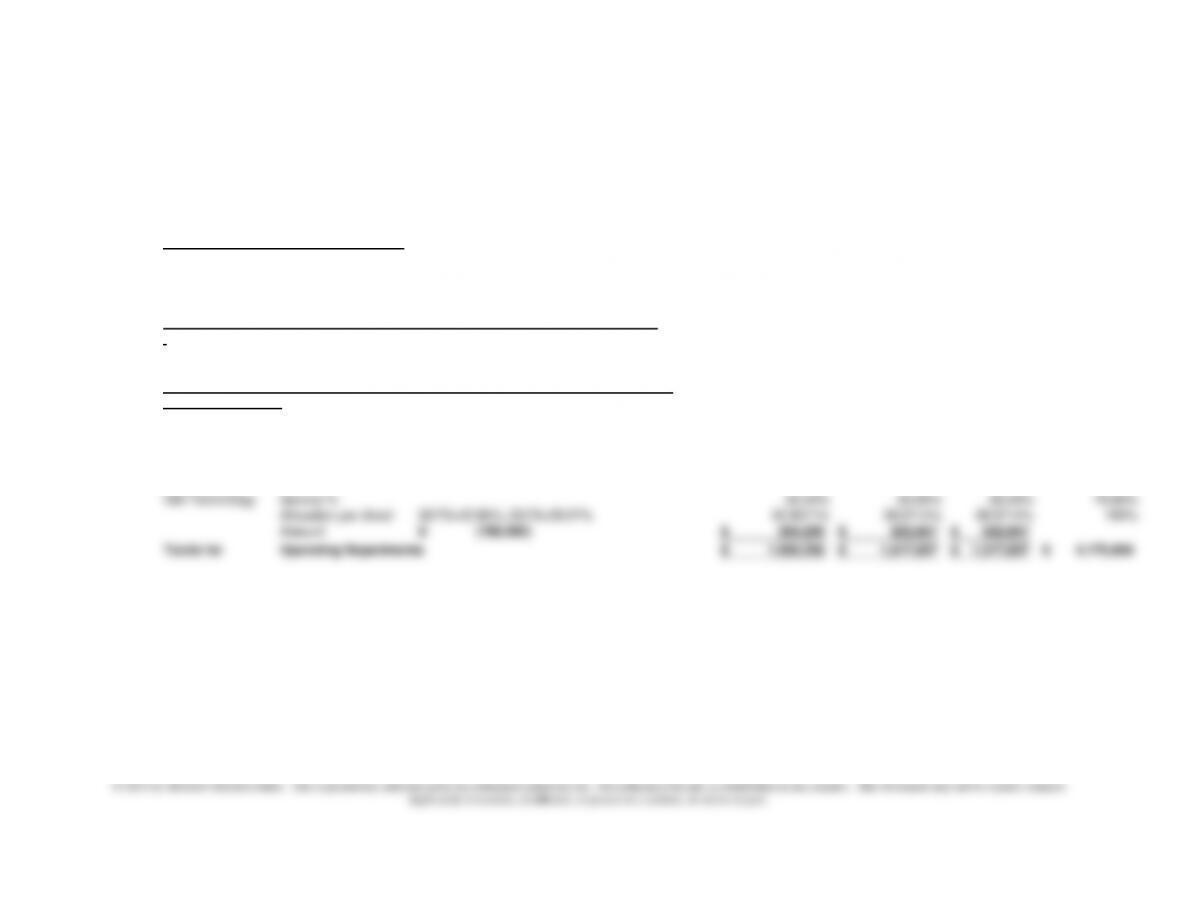
The Step Method (Facilities goes first)
Info Technology Facilities Claims Process Administration Sales Total
DEPARTMENTAL ALLOCATION BASES
Info Technology percent 30.00% 30.00% 20.00% 20.00% 100%
Facilities percent 10.00% 0.00% 20.00% 40.00% 30.00% 100%
FIRST PHASE: Trace Direct Costs and Perform Initial Allocation of Indirect Costs
Totals for All Departments
600,000$ 1,800,000$ 345,000$ 875,000$ 555,000$ 4,175,000$
SECOND PHASE: Reallocate Service Department Costs to Operating Departments:
The Step Method
First Step
Facilities Service % 10% 20.00% 40.00% 30.00% 100%
Amount
180,000 (1,800,000) 360,000 720,000 540,000
Second Step
Info Technology Service % 30.00% 20.00% 20.00% 70.00%
Allocation per direct 30/70=42.86%; 20/70=28.57% 42.8571% 28.5714% 28.5714% 100%
Amount
(780,000)$ 334,286$ 222,857$ 222,857$
Totals for Operating Departments 1,039,286$ 1,817,857$ 1,317,857$ 4,175,000$
Support Departments
Operating Departments
Chapter 7 – Cost Allocation: Departments, Joint Products, and By-Products
7-41 (continued –3)
The Reciprocal Method
Info Technology Facilities Claims Process Administration Sales Total
DEPARTMENTAL ALLOCATION BASES 0
Information Systems percent 30.00% 30.00% 20.00% 20.00% 100%
Facilities percent 10.00% 0.00% 20.00% 40.00% 30.00% 100%
Totals for All Departments
600,000$ 1,800,000$ 345,000$ 875,000$ 555,000$ 4,175,000$
SECOND PHASE: Reallocate Service Department Costs to Operating Departments:
First: Solve the simultaneous equations for Service 1 and Service 2: (See Solver Solution below)
Amount Allocated from Info Systems 804,123.71
Amount Allocated from Facilities 2,041,237.11
Second: Allocate to Producing Departments:
Info Technology Service % 30% 20% 20%
Alloc. Amt
(804,124) 241,237.11 160,824.74 160,824.74
Facilities Service % 20% 40% 30%
Alloc. Amt
(2,041,237) 408,247 816,495 612,371
Totals for Operating Departments 994,485$ 1,852,320$ 1,328,196$ 4,175,000$
Reciprocal Cost Allocation Using Solver
Service Allocated Service Rates To.. Initial Allocation To…
Department Cost Info Technology Facilities Info Technology Facilities
Info Technology 804,123.71 1.00 (0.30) 804,124 (241,237)
Support Departments
Operating Departments
Chapter 7 – Cost Allocation: Departments, Joint Products, and By-Products
7-51
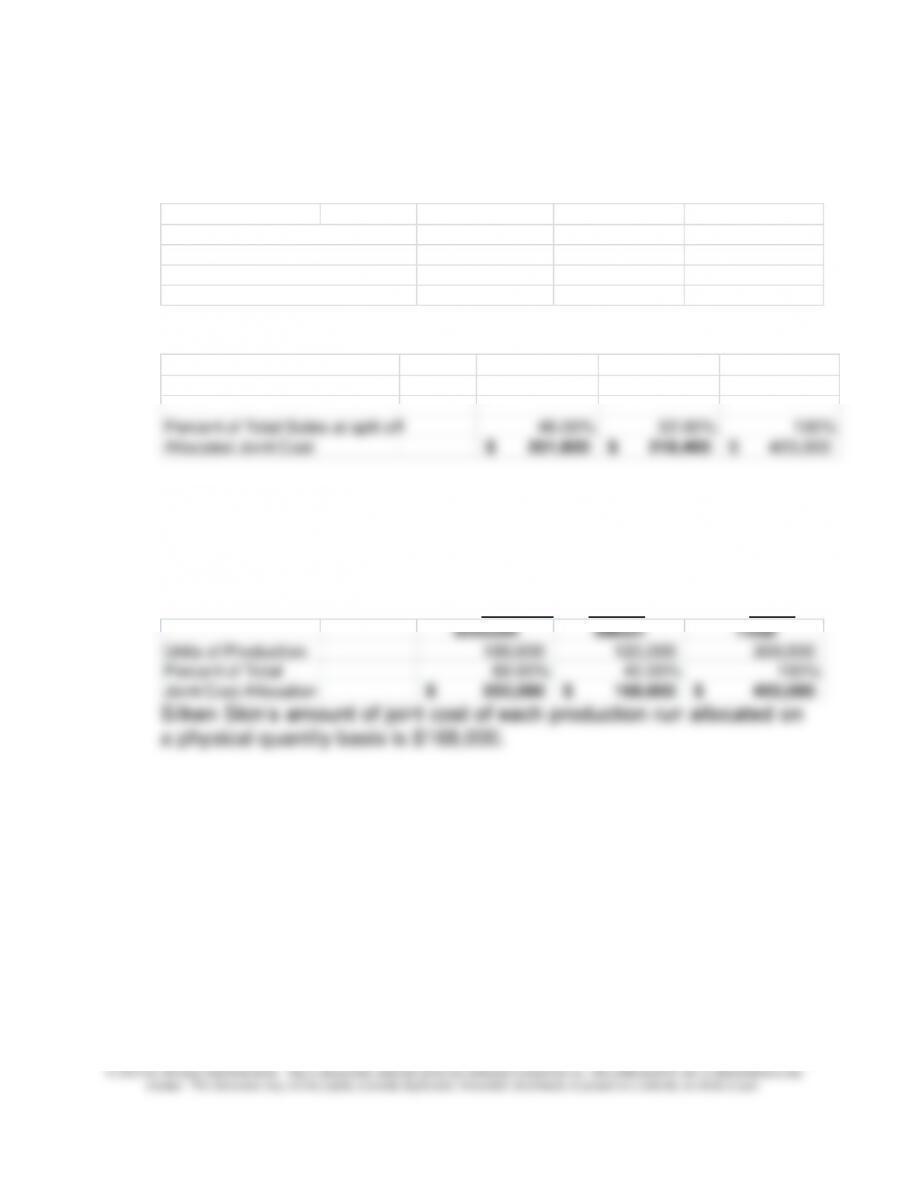
7-42 Joint Product Costing (35 min)
1.
First calculate sales value at split off:
Smooth Silken Total
Units Produced and Sold 180,000 120,000 300,000
Separable Processing cost –$ –$ –$
Sales Price at Split-off 2.40$ 3.90$
Sales Value at Split Off 432,000$ 468,000$ 900,000$
The allocation is as follows:
Smooth Silken Total
Sales Value of Production 432,000$ 468,000$ 900,000
Percent of Total Sales at split off 48.00% 52.00% 100%
Allocated Joint Cost 201,600$ 218,400$ 420,000$
Smooth Skin’s amount of joint cost of each production run allocated
on the basis of NRV is $201,600.
2. Physical Unit Method
Smooth Silken Total
Smooth Silken Total
Units of Production 180,000 120,000 300,000
Percent of Total 60.00% 40.00% 100%
Joint Cost Allocation 252,000$ 168,000$ 420,000$
Silken Skin’s amount of joint cost of each production run allocated on
a physical quantity basis is $168,000.
Chapter 7 – Cost Allocation: Departments, Joint Products, and By-Products
7-52
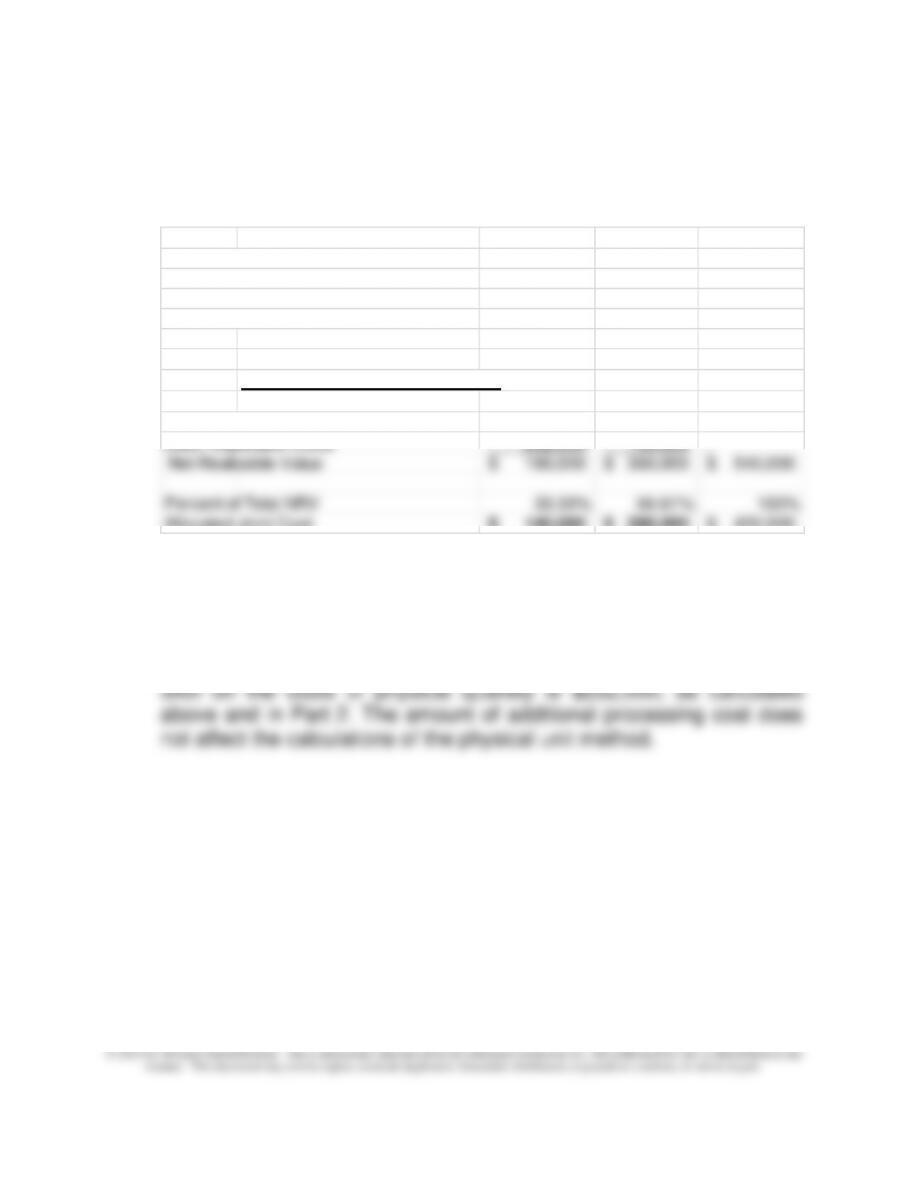
7-42 (continued-1)
3. (Additional processing costs of $1.40 for Smooth Skin and $.90 for
Silken Skin)
Smooth Silken Total
Separable Processing cost 1.40$ 0.90$
Units Produced and Sold 180,000 120,000 300,000
Total Separable Costs 252,000$ 108,000$
Total Joint Cost 420,000$
Net Realizable Value Method
Smooth Silken Total
Sales Value of Production 432,000$ 468,000$ 900,000$
Less: Separable Costs 252,000
108,000
Net Realizable Value 180,000$ 360,000$ 540,000$
Percent of Total NRV 33.33% 66.67% 100%
Allocated Joint Cost 140,000$ 280,000$ 420,000$
Silken Skin’s joint cost of each production run on a NRV basis is
$280,000.
4. The amount of joint cost of each production run allocated to Smooth
Chapter 7 – Cost Allocation: Departments, Joint Products, and By-Products
7-53
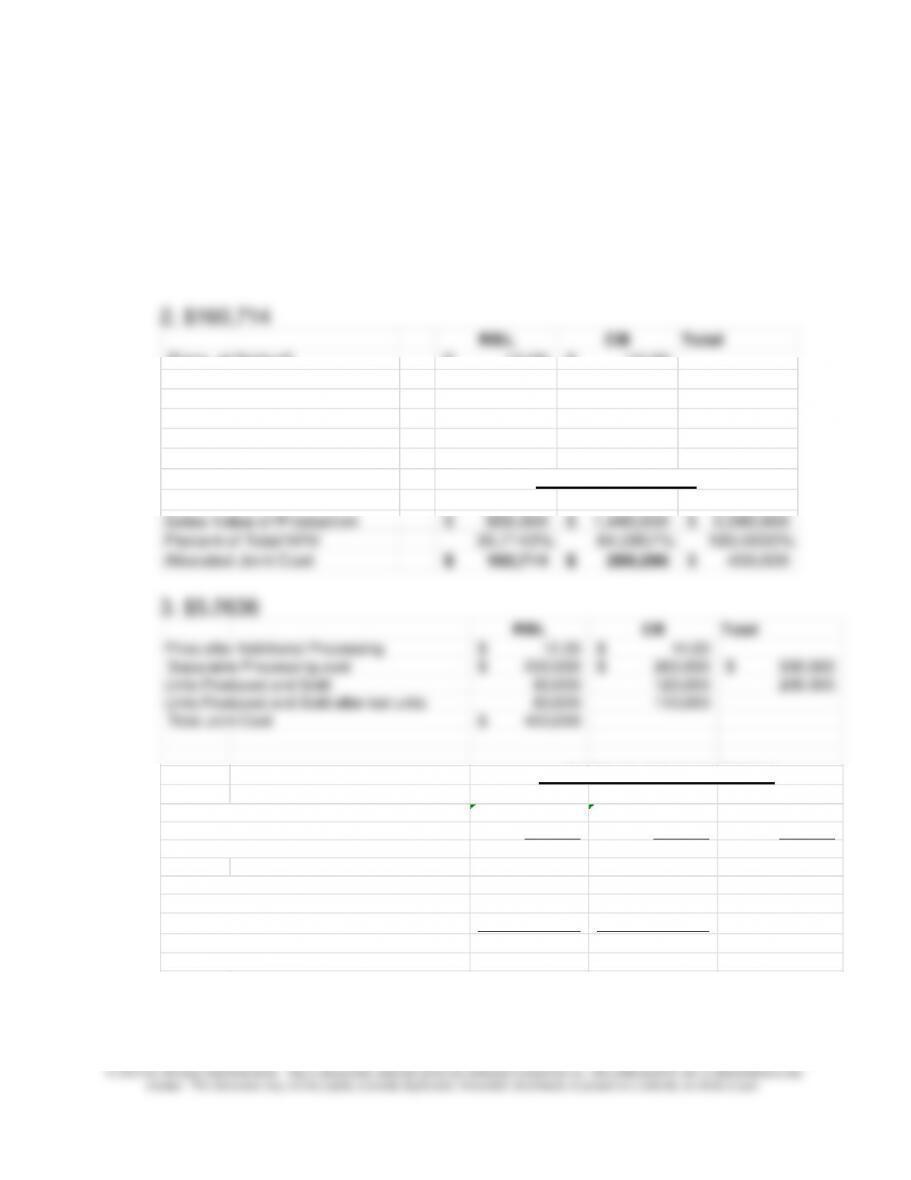
7-43 Joint Product Costing (30 min)
1. $270,000
RBL CB Total
Units of Production 80,000 120,000 200,000
Percent of Total 40.00% 60.00% 100%
Joint Cost Allocation 180,000$ 270,000$ 450,000$
Total Cost per unit 4.6375$ 5.2636$
Chapter 7 – Cost Allocation: Departments, Joint Products, and By-Products
7-54
7-43 (continued –1)
4. No, NBP should not process RBL further.
7-44 Joint Products (20 min)
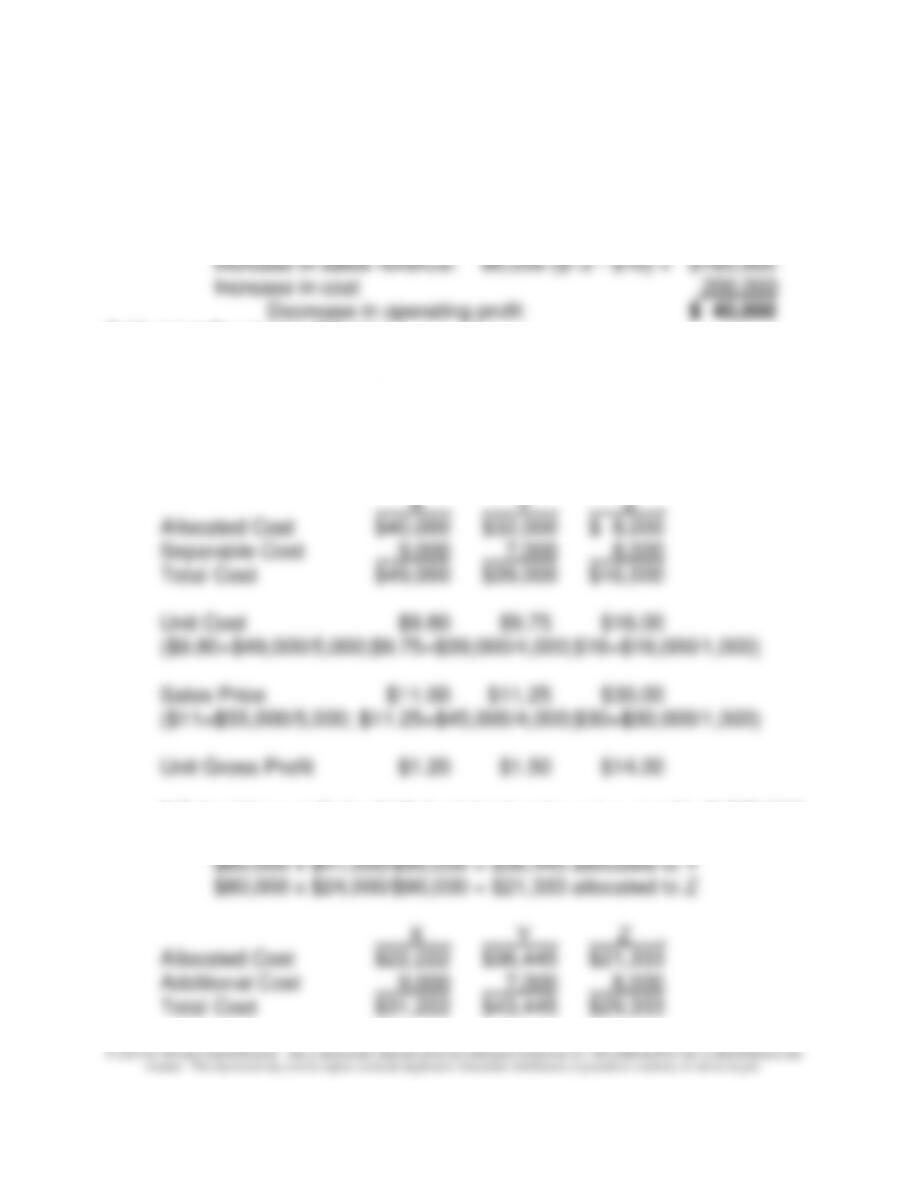
1. Physical Unit Method (10,000 total units)
$80,000 x 5,000/10,000 = $40,000 allocated to X
$80,000 x 4,000/10,000 = $32,000 allocated to Y
$80,000 x 1,000/10,000 = $ 8,000 allocated to Z
2.Sales Value at Split off Method (total sales value at split off $90,000)
$80,000 x $25,000/$90,000 = $22,222 allocated to X
Chapter 7 – Cost Allocation: Departments, Joint Products, and By-Products
7-55
Unit Cost $6.244 $10.861 $29.333
Sales Price (above) $11.000 $11.250 $30.000
Unit Gross Profit $4.756 $.389 $ .667
Notice how the unit gross profit figures change for parts 1 and 2. The
reason is the relatively large sales price for Z, which is used in the
allocation in part 2, thus increasing the joint cost allocated to Z.
7-44 (continued -1)
3. Net Value
Sales Value Separable Sales Value + Final Sales of Separable
At split off Proc. Costs Sep. Proc. Costs Value Processing
X $ 25,000 $9,000 $34,000 $55,000 $ 21,000
Y 41,000 7,000 48,000 45,000 -3,000
Z 24,000 8,000 32,000 30,000 -2,000
4. If selling product X after additional separable processing will bring
the firm into direct competition with some of its customers, the firm
should reconsider its strategy and its competencies. Does the firm
currently compete on cost leadership or differentiation? Will the
Chapter 7 – Cost Allocation: Departments, Joint Products, and By-Products
7-56
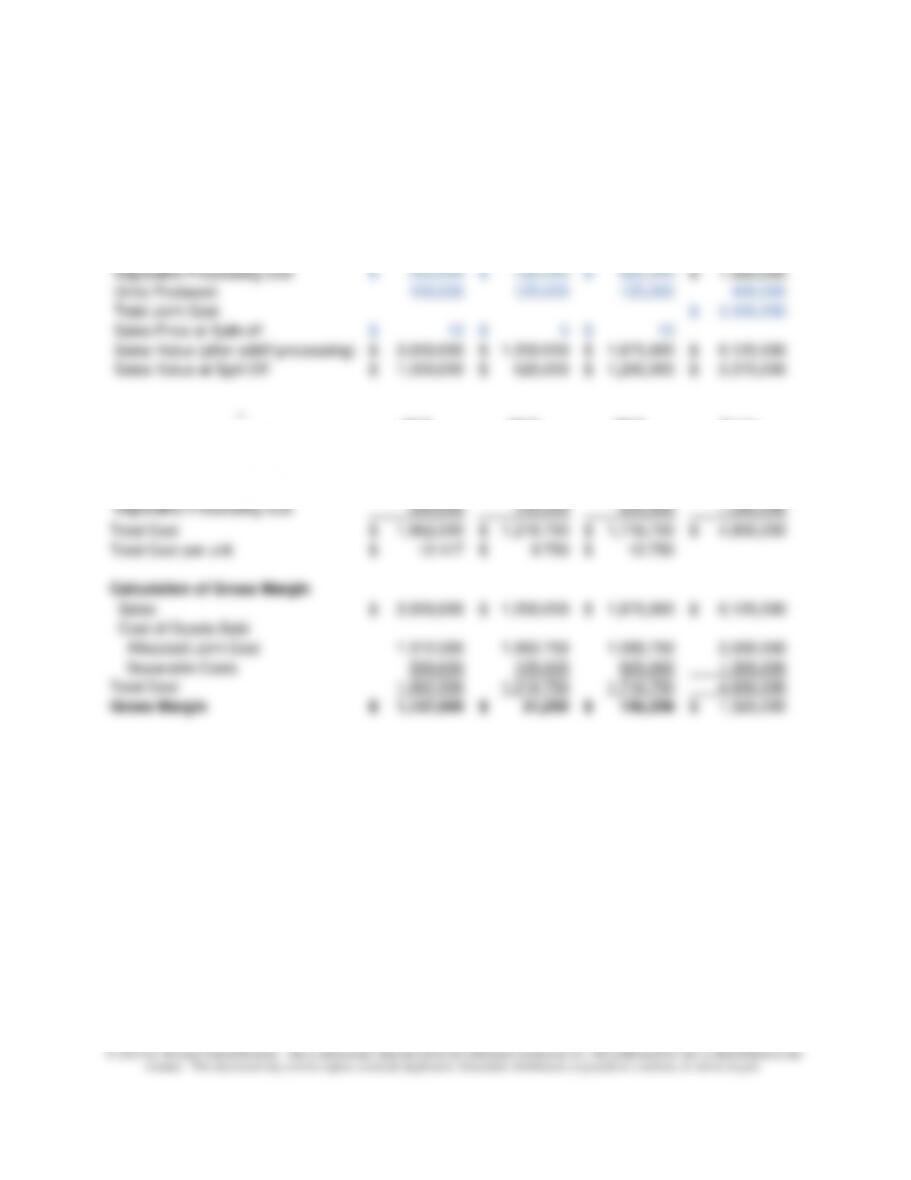
7-45 Joint Products (20 min)
Physical Unit Method
M10 M15 M18 Total
Units Sold 150,000 125,000 125,000 400,000
Price (after addt’l processing) 20$ 10$ 15$
Separable Processing cost 550,000$ 125,000$ 625,000$ 1,300,000$
Units Produced 150,000 125,000 125,000 400,000
Total Joint Cost 3,500,000$
Sales Price at Split-off 10$ 5$ 10$
Sales Value (after addt’l processing) 3,000,000$ 1,250,000$ 1,875,000$ 6,125,000$
Sales Value at Split Off 1,500,000$ 625,000$ 1,250,000$ 3,375,000$
M10 M15 M18 Total
Units of Production 150,000 125,000 125,000 400,000
Percent of Total 37.50% 31.25% 31.25% 100%
Joint Cost Allocation 1,312,500$ 1,093,750$ 1,093,750$ 3,500,000$
Separable Processing cost 550,000 125,000 625,000 1,300,000
Total Cost 1,862,500$ 1,218,750$ 1,718,750$ 4,800,000$
Total Cost per unit 12.417$ 9.750$ 13.750$
Calculation of Gross Margin
Sales 3,000,000$ 1,250,000$ 1,875,000$ 6,125,000$
Cost of Goods Sold
Allocated Joint Cost 1,312,500 1,093,750 1,093,750 3,500,000
Separable Costs 550,000 125,000 625,000 1,300,000
Total Cost 1,862,500 1,218,750 1,718,750 4,800,000
Gross Margin 1,137,500$ 31,250$ 156,250$ 1,325,000$

7-57
7-45 (continued –1)
Sales Value at Split Off Method
M10 M15 M18 Total
Units Sold 150,000 125,000 125,000 400,000
Price (after addt’l processing) 20$ 10$ 15$ –$
Separable Processing cost 550,000$ 125,000$ 625,000$ 1,300,000$
Units Produced 150,000 125,000 125,000 400,000
Total Joint Cost – – – 3,500,000$
Sales Price at Split-off 10$ 5$ 10$ –$
Sales Value (after addt’l processing) 3,000,000$ 1,250,000$ 1,875,000$ 6,125,000$
Sales Value at Split Off 1,500,000$ 625,000$ 1,250,000$ 3,375,000$
M10 M15 M18 Total
Sales Value at Split Off 1,500,000$ 625,000$ 1,250,000$ 3,375,000$
Percent of Total 44.4444% 18.5185% 37.0370% 100%
Joint Cost Allocation 1,555,556$ 648,148$ 1,296,296$ 3,500,000$
Separable Processing cost 550,000 125,000 625,000 1,300,000
Total Cost 2,105,556$ 773,148$ 1,921,296$ 4,800,000$
Total Cost per unit 14.037$ 6.185$ 15.370$
Calculation of Gross Margin
Sales 3,000,000$ 1,250,000$ 1,875,000$ 6,125,000$
Cost of Goods Sold
Allocated Joint Cost 1,555,556 648,148 1,296,296 3,500,000
Separable Costs 550,000 125,000 625,000 1,300,000
Total Cost 2,105,556 773,148 1,921,296 4,800,000
Gross Margin 894,444$ 476,852$ (46,296)$ 1,325,000$