Chapter 7 – Cost Allocation: Departments, Joint Products, and By-Products
7-31
7-35 (continued –3)
Sourcing Operations Asssembly Finishing Total
DEPARTMENTAL ALLOCATION BASES
Information Systems Hours 25,000 45,000 70,000 140,000
percent 17.8571% 32.1429% 50.00% 100%
Facilities; square feet (000) 10,000 50,000 40,000 100,000
percent 10.00% 50.00% 40.00% 100%
Totals for All Departments 134,000$ 189,000$ 398,500$ 266,000$ 987,500$
SECOND PHASE: Reallocate Service Department Costs to Production Departments:
First: Solve the simultaneous equations for Service 1 and Service 2:
Amount Allocated from Info Systems 155,680.00
Amount Allocated from Facilities 216,800.00
Second: Allocate to Producing Departments:
Sourcing Service % 32.1429% 50.0000%
Alloc. Amt (155,680) 50,040 77,840
Operations Service % 50% 40%
Alloc. Amt (216,800.00) 108,400 86,720
Total Cost Allocated 158,440 164,560
Totals for Production Departments 556,940$ 430,560$ 987,500$
Reciprocal Cost Allocation Using Solver
Service Allocated Service Rates To.. Initial Allocation To…
Department Cost Sourcing Operations Sourcing Operations
Sourcing 155,680.00 1.00 (0.1786) 155,680 (27,800)
Operations 216,800.00 (0.10) 1.00 (21,680) 216,800
134,000 189,000
Support Departments
Producing Departments
Note: Equations to Solve (using Solver):
Sourcing = 134,000 + .10 x Operations
Chapter 7 – Cost Allocation: Departments, Joint Products, and By-Products
7-32
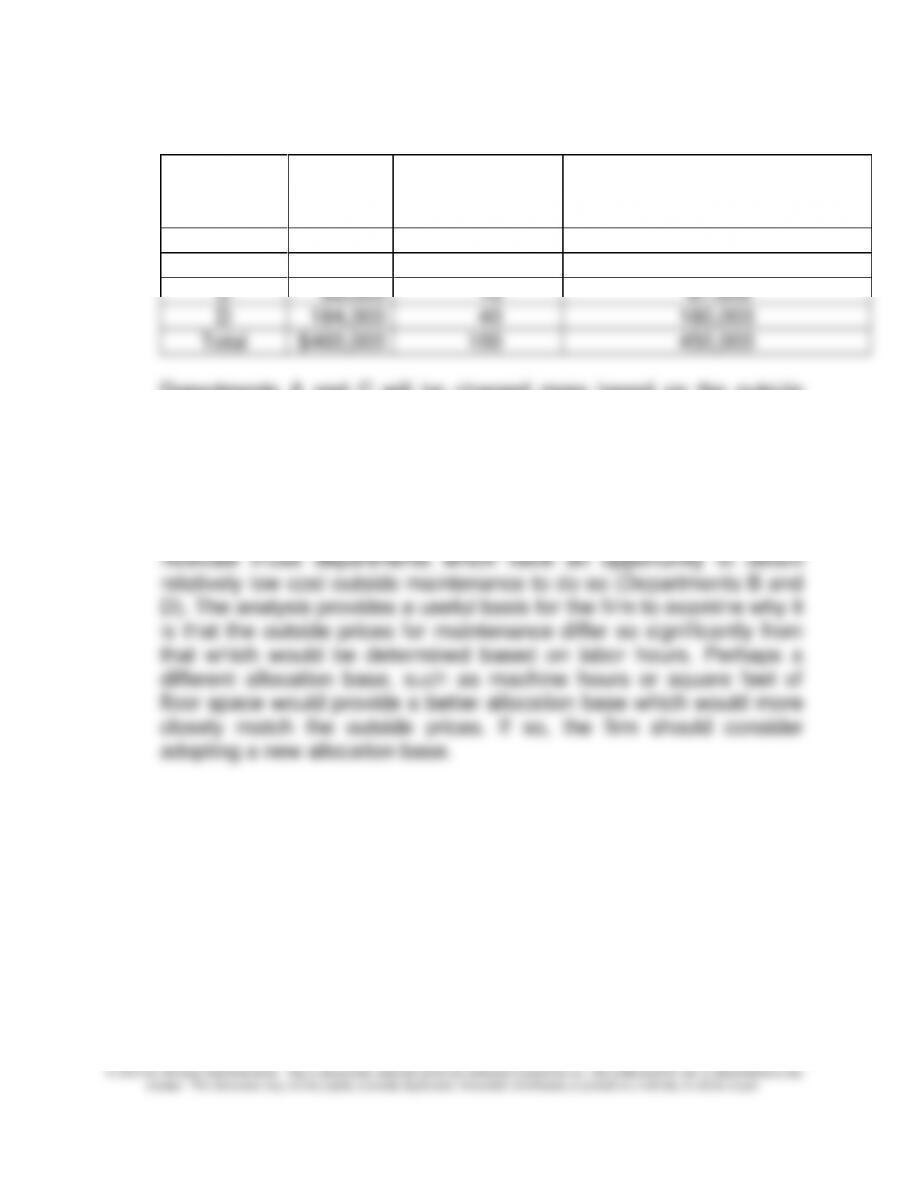
7-36 Departmental Cost Allocation (20 min)
Production
Department
Outside
Price
Percentage
based on
Outside Price
Allocation of Total Maintenance
Cost Using Outside Prices
A
$115,000
25%
$450,000 x .25 = $112,500
B
92,000
20
90,000
C
69,000
15
67,500
D
184,000
40
180,000
Total
$460,000
100
450,000
Departments A and C will be charged more based on the outside
pricing percentage, because the cost of obtaining maintenance
outside the firm is higher for these departments.
2. The overall effect of the new plan will be to motivate the production
departments to continue to use the internal supplier of maintenance
when the outside price is high (as in Departments A and C), and
Chapter 7 – Cost Allocation: Departments, Joint Products, and By-Products
7-33
7-37 Departmental Cost Allocation (30 min)
The Direct Method:
CFL Group Computer Market Res. Financial Analysis
Total
DEPARTMENTAL ALLOCATION BASES
CFL Group percent 20.00% 60.00% 20.00% 100%
Computer percent 12.00% 48.00% 40.00% 100%
FIRST PHASE: Trace Direct Costs and Perform Initial Allocation of Indirect Costs
Totals for All Departments 450,000$ 750,000$ 1,000,000$ 1,500,000$ 3,700,000$
SECOND PHASE: Reallocate Service Department Costs to Production Departments:
The Direct Method
CFL Group Service % to producing departments 60.00% 20.00%
Allocation % per the direct method 75.0% 25.0%
Allocation amount (450,000)$ 337,500$ 112,500$
Computer Service % to producing departments 48.00% 40.00%
Allocation % per the direct method 54.5455% 45.4545%
Allocation amount (750,000)$ 409,091 340,909
Totals for Production Departments 1,746,591$ 1,953,409$ 3,700,000$
Chapter 7 – Cost Allocation: Departments, Joint Products, and By-Products
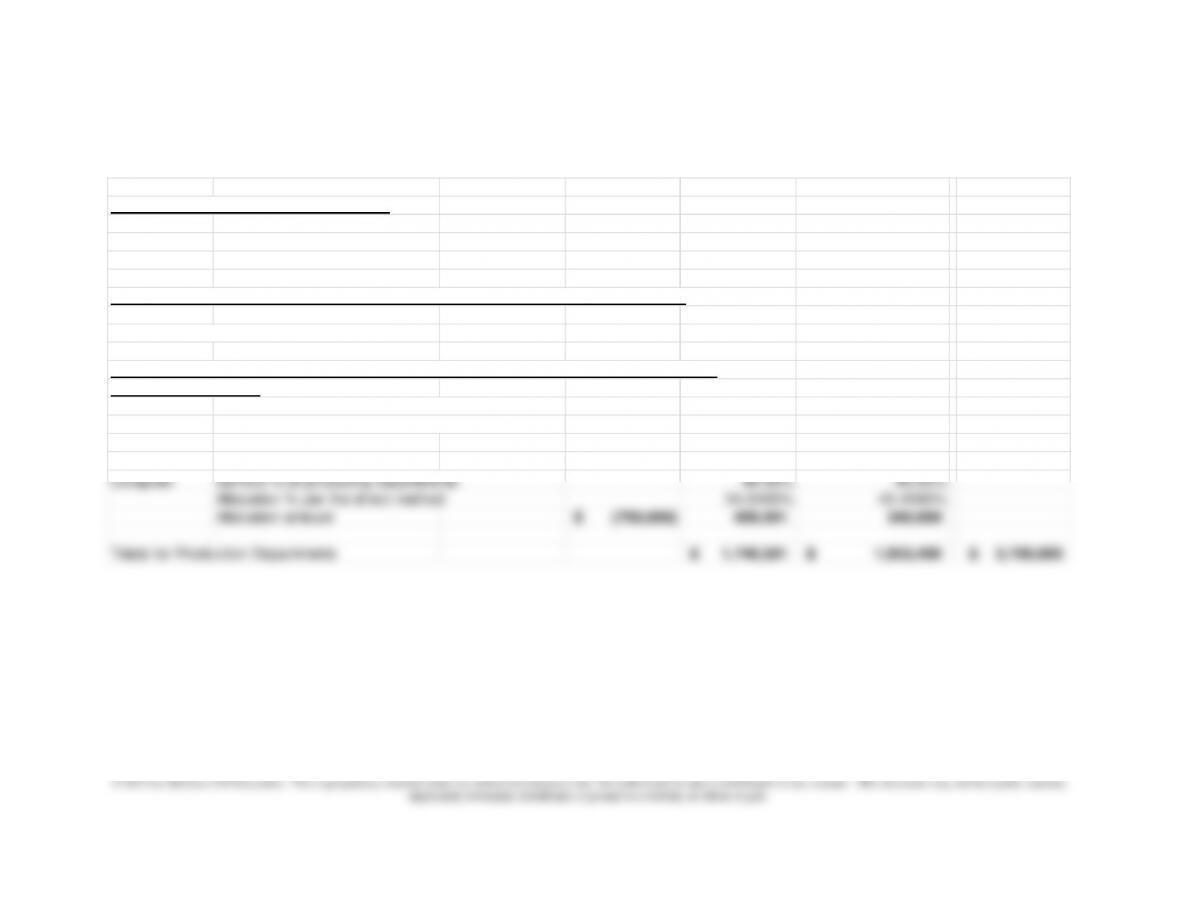
7-37 (continued –1)
The Step Method
The CFL department goes first because it has a higher estimated percentage of dollars work for
the computer group (20%) relative to the computer group’s service to CFL (12%)
CFL Group Computer Market Res. Financial Analysis
Total
DEPARTMENTAL ALLOCATION BASES
CFL Group
percent 20.00% 60.00% 20.00% 100%
Computer
percent 12.00% 48.00% 40.00% 100%
FIRST PHASE: Trace Direct Costs and Perform Initial Allocation of Indirect Costs
Totals for All Departments 450,000 750,000 1,000,000 1,500,000 3,700,000
SECOND PHASE: Reallocate Service Department Costs to Production Departments:
The Step Method
First Step
CFL Group Service % 20.00% 60.00% 20.00%
Amount (450,000) 90,000 270,000 90,000
Second Step
Computer Service % 48.00% 40.00%
Allocation percent per direct method 54.5455% 45.4545%
Amount (840,000.00) 458,182 381,818
Totals for Production Departments 1,728,182$ 1,971,818$ 3,700,000$
Support Departments
Producing Departments
7-37 (continued –2)
Reciprocal Method
SECOND PHASE: Reallocate Service Department Costs to Production Departments:
First: Solve the simultaneous equations
Amount Allocated from CFL 553,278.69
Amount Allocated from Computer 860,655.74
Second: Allocate to Producing Departments:
CFL Group Service % 60% 20%
Alloc. Amt
(553,279) 331,967.21 110,655.74
Computer Service % 48% 40%
Alloc. Amt
(860,655.74) 413,114.75 344,262.30
Totals for Production Departments 1,745,082 1,954,918 3,700,000
Reciprocal Cost Allocation Using Solver
Service Allocated Service Rates To.. Initial Allocation To…
Department Cost CFL Group Computer CFL Group Computer
CFL Group 553,278.69 1.00 (0.20) 553,279 (110,656)
Computer 860,655.74 (0.12) 1.00 (103,279) 860,656
450,000 750,000
Note: Equations to Solve (using Solver):
CFL = 450,000 + .12 x Computer
7-36
7-38 Departmental Cost Allocation (25 min)
The Direct Method
Base Maintenance Utilities Production A Production B
Total
DEPARTMENTAL ALLOCATION BASES
Maintenance percent 0.0% 25.0% 25.0% 50.0% 100%
Utilities percent 15.0% 0.0% 40.0% 45.0% 100%
FIRST PHASE: Trace Direct Costs and Perform Initial Allocation of Indirect Costs
Direct Costs 115,000$ 65,000$ –$ –$ 180,000$
SECOND PHASE: Reallocate Service Department Costs to Production Departments:
The Direct Method
Maintenance Service % to producing departments 25% 50% 75%
Allocation % per the direct method 25/75=33.33%; 50/75=66.6667% 33.3333% 66.6667% 100%
Allocation amount (115,000)$ 38,333$ 76,667$
Utilities Service % to producing departments 40% 45% 85%
Allocation % per the direct method 40/85=47.0588%; 45/85=52.9412% 47.0588% 52.9412% 100%
Allocation amount (65,000)$ 30,588 34,412
Totals for Production Departments 68,922$ 111,078$ 180,000$
Departments
Service
Production
Chapter 7 – Cost Allocation: Departments, Joint Products, and By-Products
7-37
7-38 (continued –1)
The Step Method
The maintenance department goes first since it has a greater percentage of service (25%) to utilities
than the utilities department has to maintenance (15%).
Base Maintenance Utilities Production A Production B Total
FIRST PHASE: Trace Direct Costs and Perform Initial Allocation of Indirect Costs
Maintenance percent 0% 25% 25% 50% 100%
Utilities percent 15% 0% 40% 45% 100%
FIRST PHASE: Trace Direct Costs and Perform Initial Allocation of Indirect Costs
Direct Costs 115,000$ 65,000$ –$ –$ 180,000$
SECOND PHASE: Reallocate Service Department Costs to Production Departments:
The Step Method (Maintenance goes first because it has the highest cost in total or on a precentage basis)
First Step
Maintenance Service % 25.00% 25.00% 50.00% 100%
Amount (115,000)$ 28,750$ 28,750$ 57,500$
Second Step p
Utilities Service % 40.00% 45.00% 85%
Allocation percent per direct method 40/85=47.0588%; 45/85=52.9412% 47.0588% 52.9412% 100%
Amount (93,750) 44,118 49,632
Totals for Production Departments –$ 72,868$ 107,132$ 180,000$
Departments
Chapter 7 – Cost Allocation: Departments, Joint Products, and By-Products
7-38 (continued –2)
The Reciprocal Method
Base Maintenance Utilities Production A Production B Total
FIRST PHASE: Trace Direct Costs and Perform Initial Allocation of Indirect Costs
Maintenance percent 0% 25% 25% 50% 100%
Utilities percent 15% 0% 40% 45% 100%
FIRST PHASE: Trace Direct Costs and Perform Initial Allocation of Indirect Costs
Direct Costs 115,000$ 65,000$ –$ –$
180,000$
SECOND PHASE: Reallocate Service Department Costs to Production Departments:
The Reciprocal Method
First: Solve the simultaneous equations (see Solver Solution Section below)
Amount Allocated from Maintenance 129,610.39$
Amount Allocated from Utilities 97,402.60$
Second: Allocate to Producing Departments:
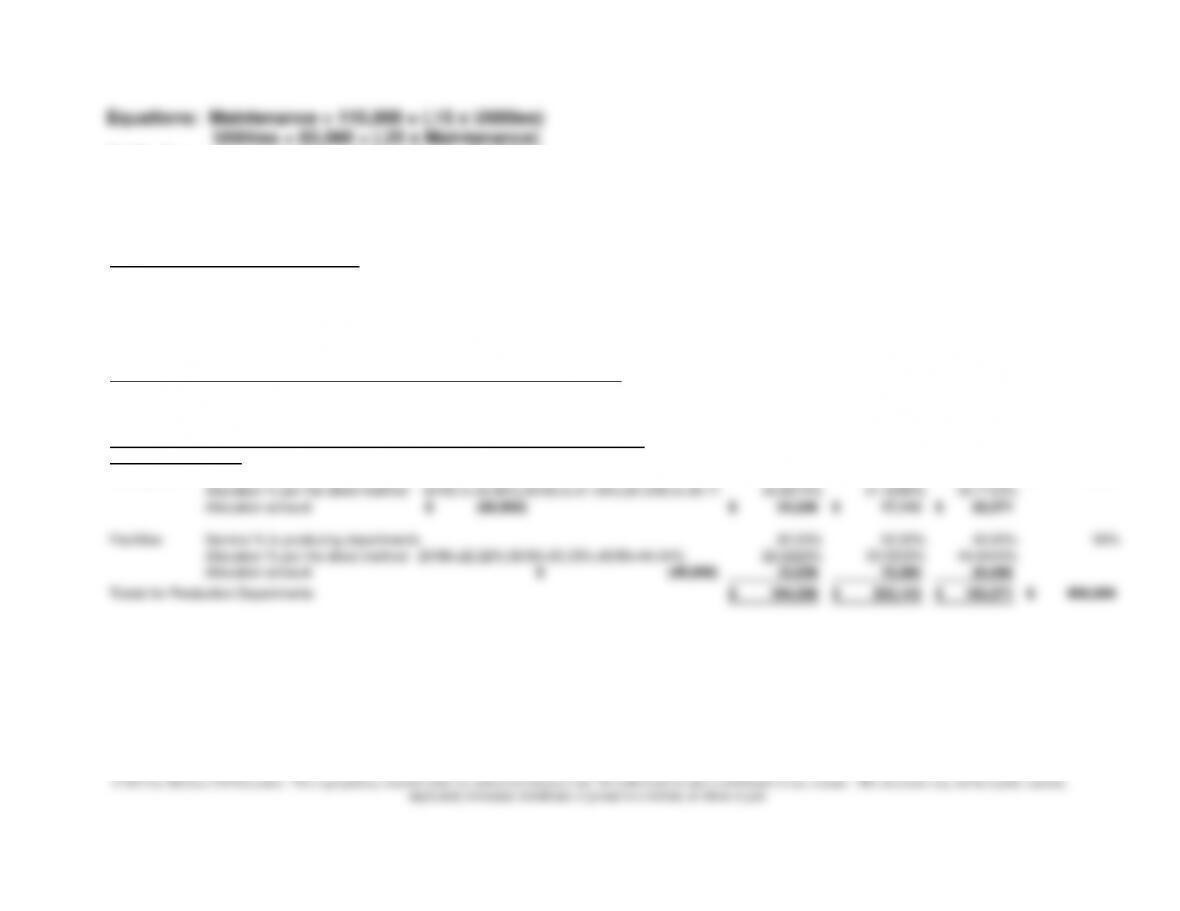
Maintenance Service % 25% 50%
Alloc. Amt
32,403$ 64,805$
Utilities Service % 40% 45%
Alloc. Amt
38,961 43,831
Totals for Production Departments 71,364$ 108,636$ 180,000$
Allocated Service Rates To.. Initial Allocation To…
Cost
Maintenanc
Utilities Production A Production B
Maintenance 129,610 1.00 (0.25) 129,610 (32,403)
Utilities 97,403 (0.15) 1.00 (14,610) 97,403
Departments
Reciprocal Cost Allocation Using Solver
Chapter 7 – Cost Allocation: Departments, Joint Products, and By-Products
7-39
© 2013 by McGraw-Hill Education. This is proprietary material solely for authorized instructor use. Not authorized for sale or distribution in any manner. This document may not be copied, scanned,
Equations: Maintenance = 115,000 + (.15 x Utilities)
Utilities = 65,000 + (.25 x Maintenance)
7-39 Departmental Cost Allocation (50 Min)
1.a. The Direct Method
Info Systems Facilities Programming Consulting Training Total
DEPARTMENTAL ALLOCATION BASES
Info Systems
200 1,200 600 1,000 3,000
percent 6.6667% 40.0000% 20.0000% 33.3333% 100%
Facilities
200 400 600 800 2,000
percent 10.00% 20.00% 30.00% 40.00% 100%
FIRST PHASE: Trace Direct Costs and Perform Initial Allocation of Indirect Costs
Totals for All Departments
80,000$ 45,000$ 150,000$ 190,000$ 135,000$ 600,000$
SECOND PHASE: Reallocate Service Department Costs to Production Departments:
The Direct Method
Info Systems Service % to producing departments 40.00% 20.00% 33.33% 0.933$
Allocation % per the direct method
40/93.3=42.86%;20/93.3=21.43%;33.3/93.3=35.71%
42.8571% 21.4286% 35.7143%
Allocation amount
(80,000)$ 34,286$ 17,143$ 28,571$
Facilities Service % to producing departments 20.00% 30.00% 40.00% 90%
Allocation % per the direct method 20/90=22.22%;30/90=33.33%;40/90=44.44% 22.2222% 33.3333% 44.4444%
Allocation amount (45,000)$ 10,000 15,000 20,000
Totals for Production Departments 194,286$ 222,143$ 183,571$ 600,000$
Support Departments
Producing Departments
Chapter 7 – Cost Allocation: Departments, Joint Products, and By-Products
7-40
7-39 (continued -1)
1.b The Step Method (Information Systems Goes First)
Info Systems Facilities Programming Consulting Training Total
DEPARTMENTAL ALLOCATION BASES
Info Systems 200 1,200 600 1,000 3,000
percent 6.6667% 40.0000% 20.0000% 33.3333% 100%
Facilities 200 400 600 800 2,000
percent 10.00% 20.00% 30.00% 40.00% 100%
FIRST PHASE: Trace Direct Costs and Perform Initial Allocation of Indirect Costs
Totals for All Departments
80,000$ 45,000$ 150,000$ 190,000$ 135,000$ 600,000$
SECOND PHASE: Reallocate Service Department Costs to Production Departments:
The Step Method
First Step
Info Systems Service % 6.6667% 40.0000% 20.0000% 33.3333%
Amount (80,000)
5,333 32,000 16,000 26,667
Second Step
Facilities Service % 20.00% 30.00% 40.00% 90%
Allocation percent per direct method 20/90=22.2%;30/90=33.3%;40/90=44.4% 22.2222% 33.3333% 44.4444%
Amount (50,333.33) 11,185 16,778 22,370
Totals for Production Departments 193,185$ 222,778$ 184,037$ 600,000$
Support Departments
Producing Departments
Chapter 7 – Cost Allocation: Departments, Joint Products, and By-Products
7-41
7-39 (continued -2)
1.b The Step Method (Facilities Goes First)
Info Systems Facilities Programming Consulting Training Total
DEPARTMENTAL ALLOCATION BASES
Info Systems 200 1,200 600 1,000 3,000
percent 6.67% 40.00% 20.00% 33.33% 100%
Facilities 200 400 600 800 2,000
percent 10.00% 20.00% 30.00% 40.00% 100%
FIRST PHASE: Trace Direct Costs and Perform Initial Allocation of Indirect Costs
Totals for All Departments
80,000$ 45,000$ 150,000$ 190,000$ 135,000$ 600,000$
SECOND PHASE: Reallocate Service Department Costs to Production Departments:
The Step Method
First Step
Facilities Service % 10% 20.00% 30.00% 40.00% 100%
Amount
4,500 (45,000) 9,000 13,500 18,000
Second Step
Info Systems Service % 40.0000% 20.0000% 33.3333% 93.33%
Allocation per direct 40/93.3=42.86%;20/93.3=21.43%;33.3/93.3=35.71% 42.8571% 21.4286% 35.7143% 100%
Amount (84,500)$ 36,214$ 18,107$ 30,179$
Totals for Production Departments 195,214$ 221,607$ 183,179$ 600,000$
Support Departments
Producing Departments
Chapter 7 – Cost Allocation: Departments, Joint Products, and By-Products
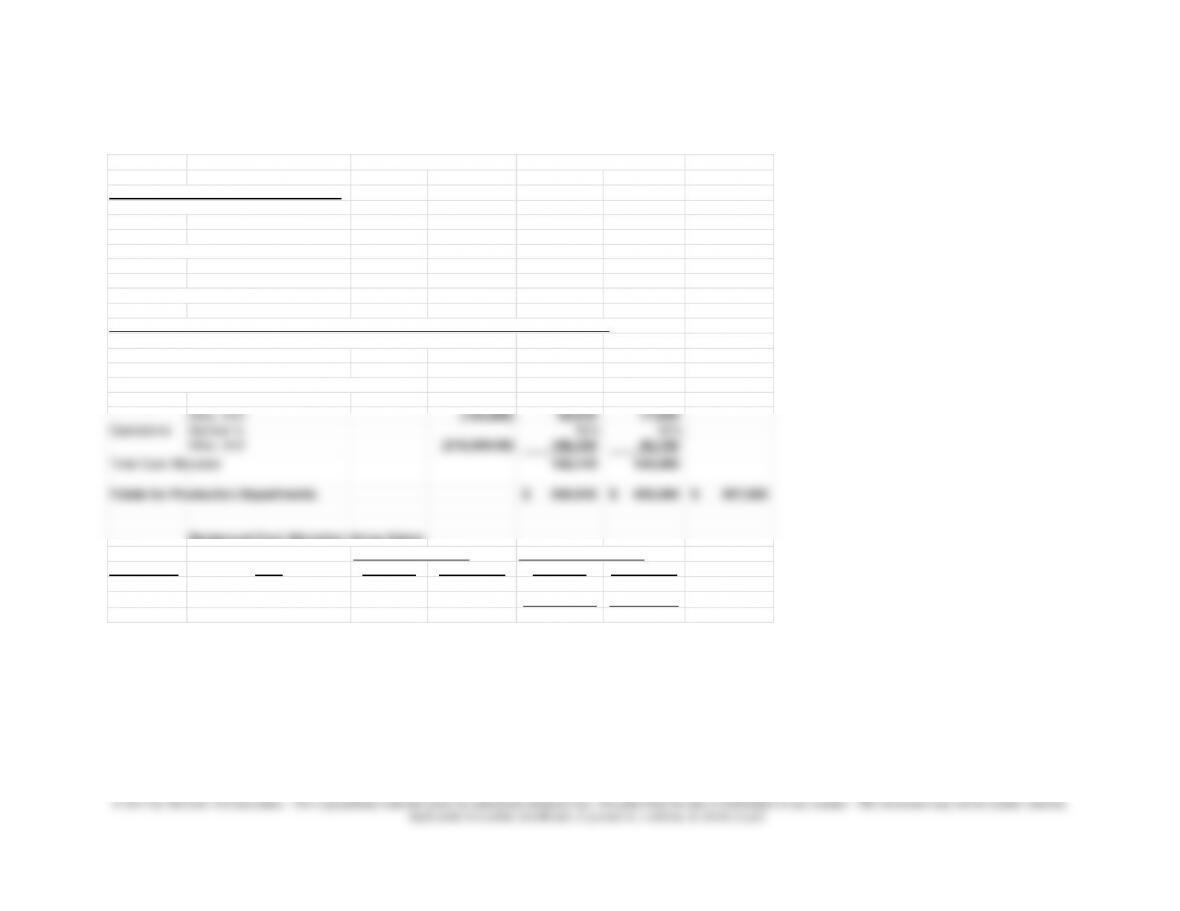
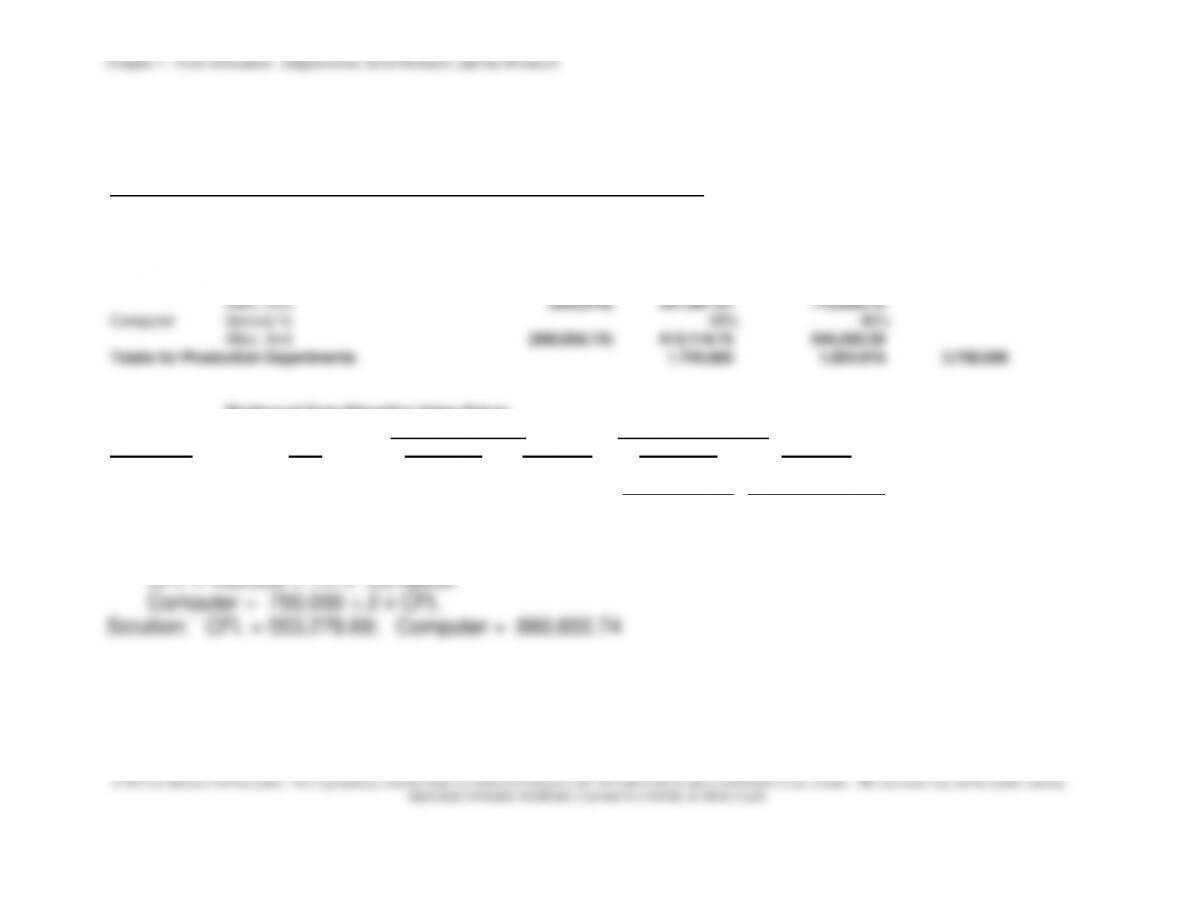
7-39 (continued -3)
1.c. The Reciprocal Method
Reciprocal Method Using Solver
Info Systems Facilities Programming Consulting Training Total
DEPARTMENTAL ALLOCATION BASES
Information Systems Hours 200 1,200 600 1,000 3,000
percent 6.6667% 40.0000% 20.0000% 33.3333% 100%
Facilities; square feet (000) 200 400 600 800 2,000
percent 10.00% 20.00% 30.00% 40.00% 100%
Totals for All Departments
80,000$ 45,000$ 150,000$ 190,000$ 135,000$ 600,000$
SECOND PHASE: Reallocate Service Department Costs to Production Departments:
First: Solve the simultaneous equations for Service 1 and Service 2:
(See Solver Solution below)
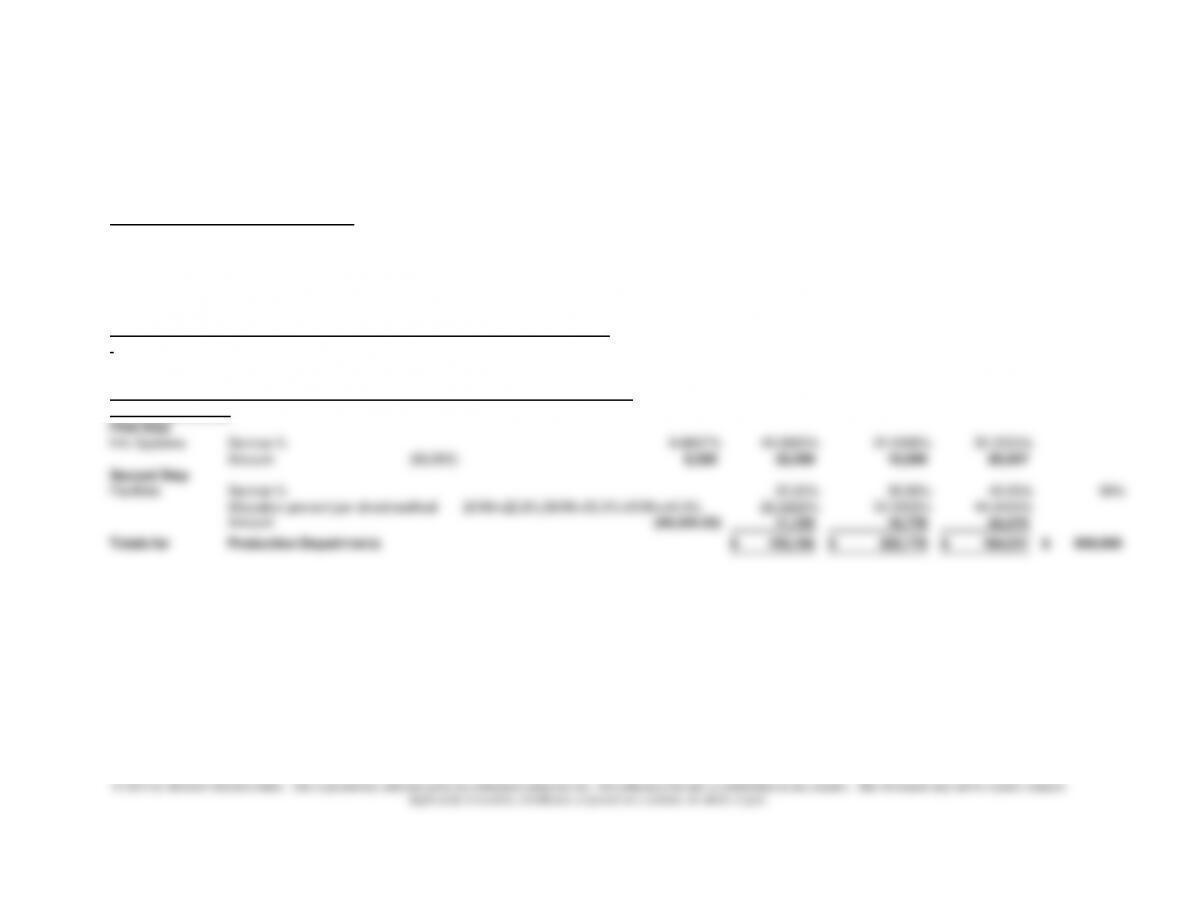
Amount Allocated from Info Systems 85,067.11
Amount Allocated from Facilities 50,671.14
Second: Allocate to Producing Departments:
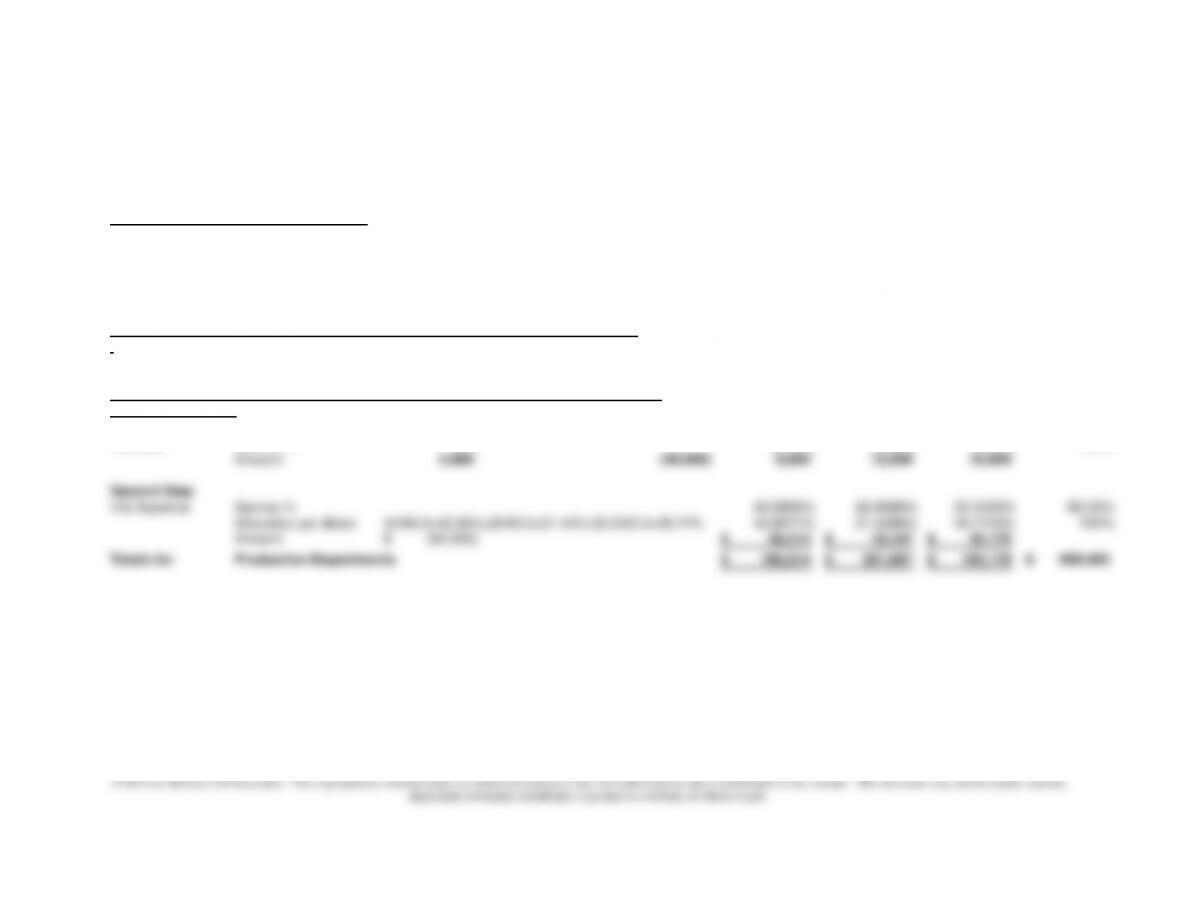
Info Systems Service % 40% 20% 33.3333%
Alloc. Amt
34,026.85 17,013.42 28,355.70
Facilities Service % 20% 30% 40%
Alloc. Amt 10,134.23 15,201.34 20,268.46
Totals for Production Departments 194,161$ 222,215$ 183,624$ 600,000$
Reciprocal Cost Allocation Using Solver
Service Allocated Service Rates To.. Initial Allocation To…
Department Cost Info Systems Facilities Info Systems Facilities
Info Systems 85,067.11 1.00 (0.07) 85,067 (5,671)
Facilities 50,671.14 (0.10) 1.00 (5,067) 50,671
80,000 45,000
Support Departments
Producing Departments
Chapter 7 – Cost Allocation: Departments, Joint Products, and By-Products
7-43
7-39 (continued -4)
2. Rather than to allocate costs, Computer Intelligence might consider
7-44
7-40 Departmental Cost Allocation (50 min)
The Direct Method
Base IT Admin Education Program Mgt Mental Health Housing
Total
DEPARTMENTAL ALLOCATION BASES
Direct Labor Hr Direct labor hours 2,000 6,000 4,000 4,000 16,000
percent 12.50% 37.50% 25.00% 25.00% 100%
Headcount Headcount 2 3 3 4 12
percent 16.6667% 25.0000% 25.0000% 33.3333% 100%
FIRST PHASE: Trace Direct Costs and Perform Initial Allocation of Indirect Costs
Direct Costs 6,000$ 122,000$ 100,000$ 190,000$ 418,000$
Indirect Costs:
Dir Labor Hrs
6,250 18,750 12,500 12,500 50,000$
Headcount 2,500 3,750 3,750 5,000 15,000$
Totals for All Departments 14,750$ 144,500$ 116,250$ 207,500$ 483,000$
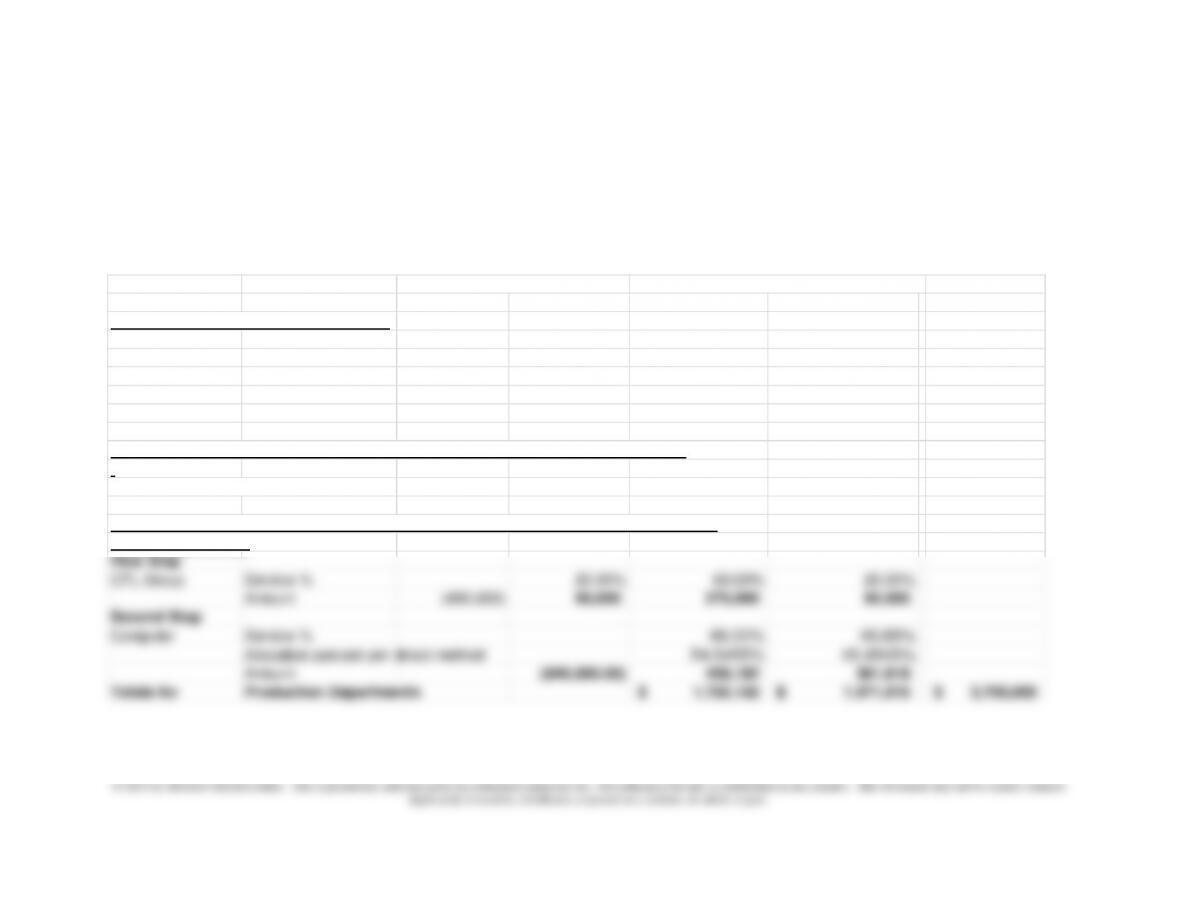
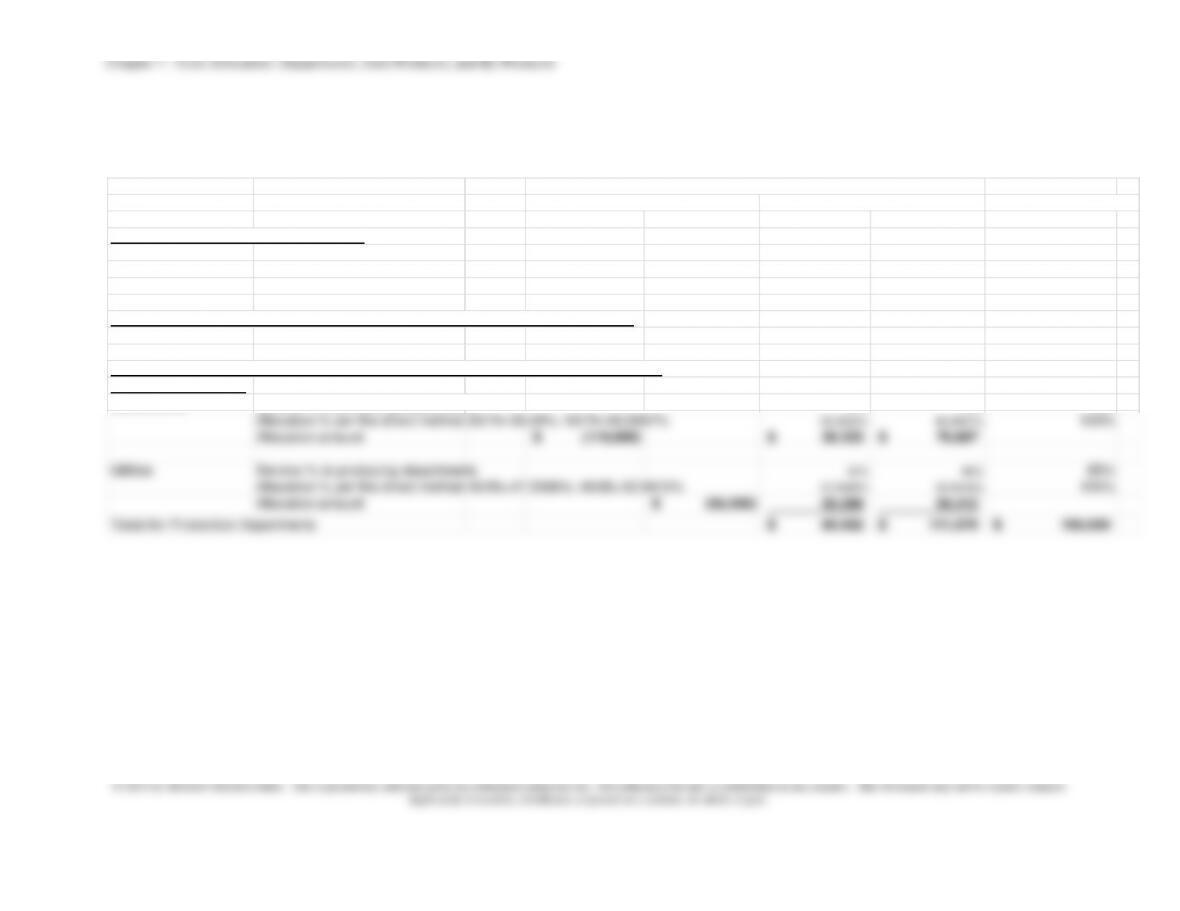
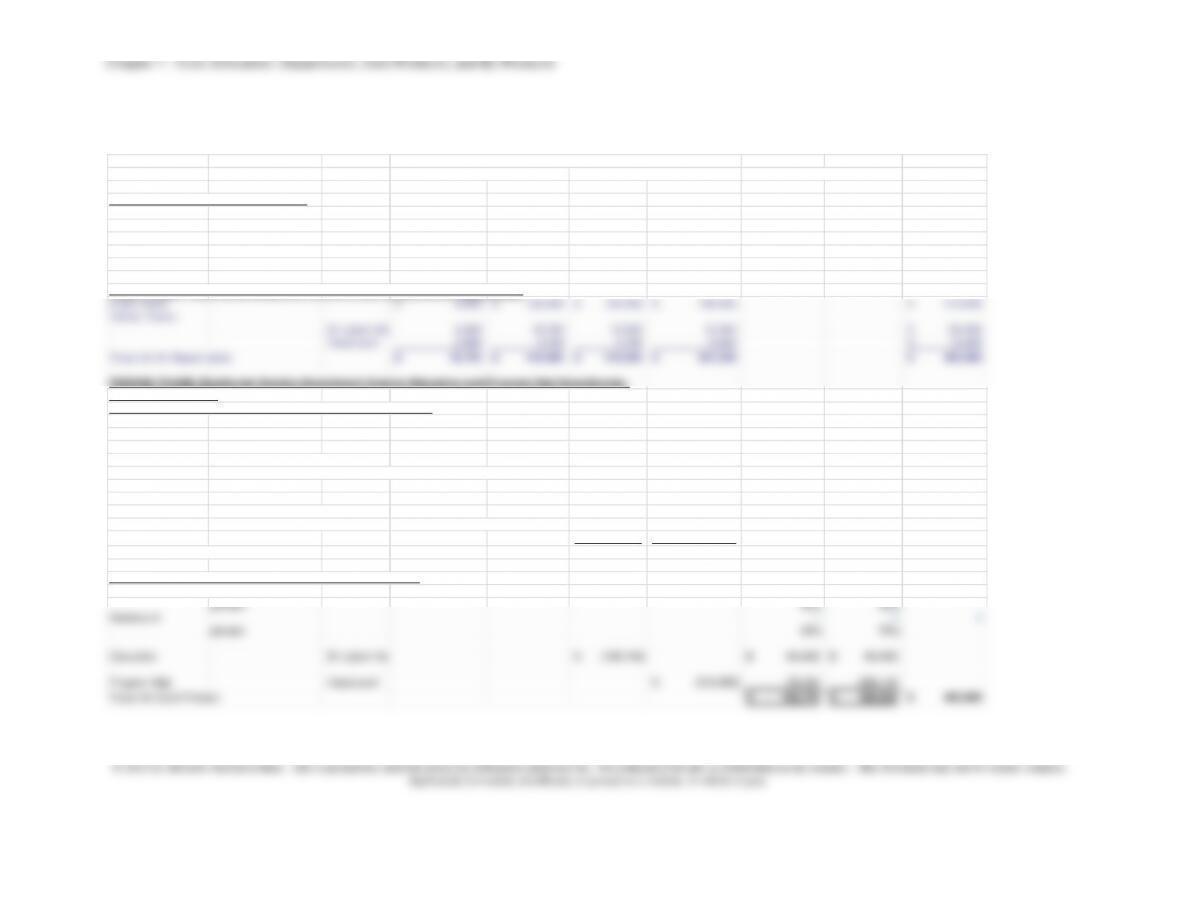
SECOND PHASE: Reallocate Service Department Costs to Education and Program Mgt Departments:
The Direct Method
Service Rates for Support Departments and Main Departments
IT 20% 20% 60%
Administration 10% 30% 60%
IT Service % to producing departments 20.00% 60.00% 80%
Allocation % per the direct method (20/80=25%; 60/80=75%) 25.00% 75.00%
Allocation amount (14,750)$ 3,688$ 11,063$
percent 50% 50%
Headcount 1 3 4
percent 25% 75%
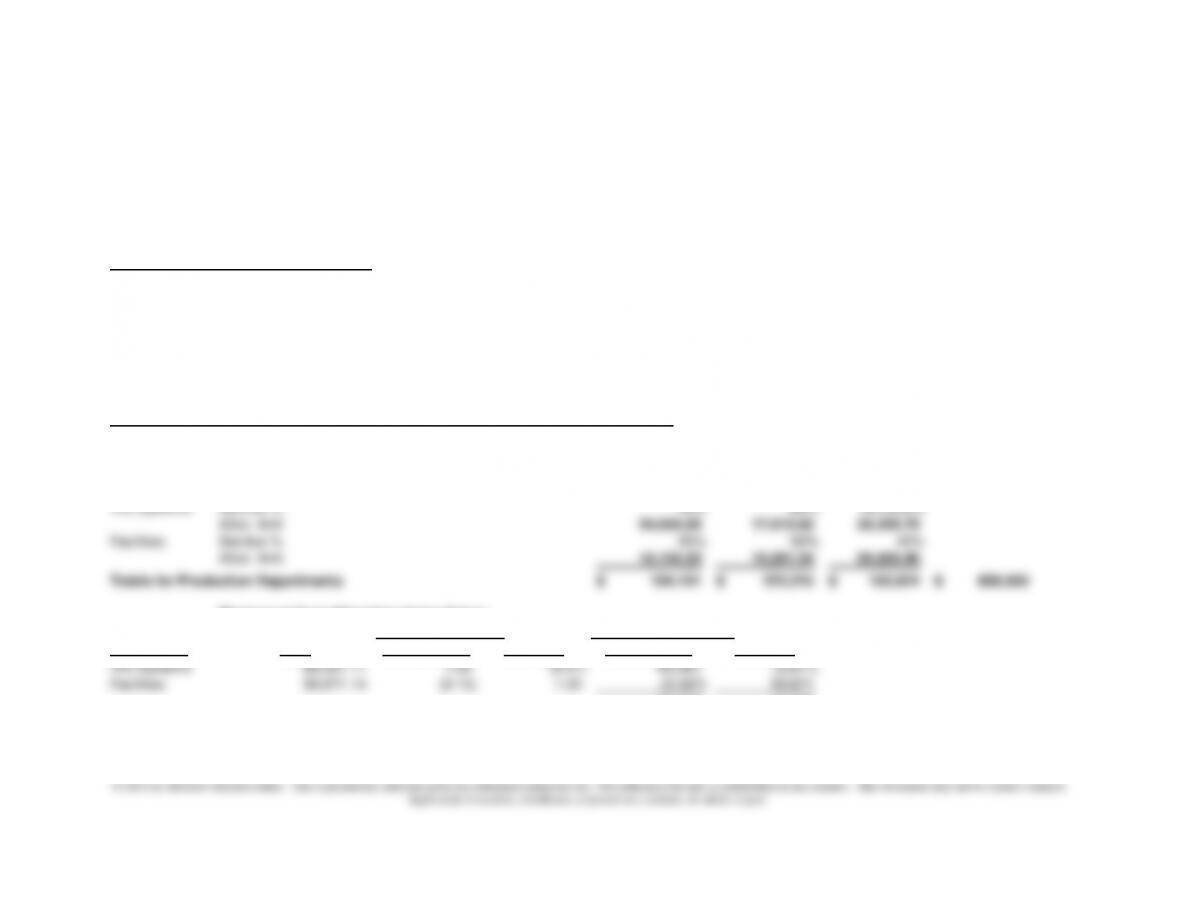
Education Dir Labor Hrs (168,104)$ 84,052$ 84,052$
Program Mgt Headcount (314,896)$ 78,724 236,172
Totals for Each Product 162,776$ 320,224$ 483,000$
Departments
Service
Main
Programs
Chapter 7 – Cost Allocation: Departments, Joint Products, and By-Products
7-45
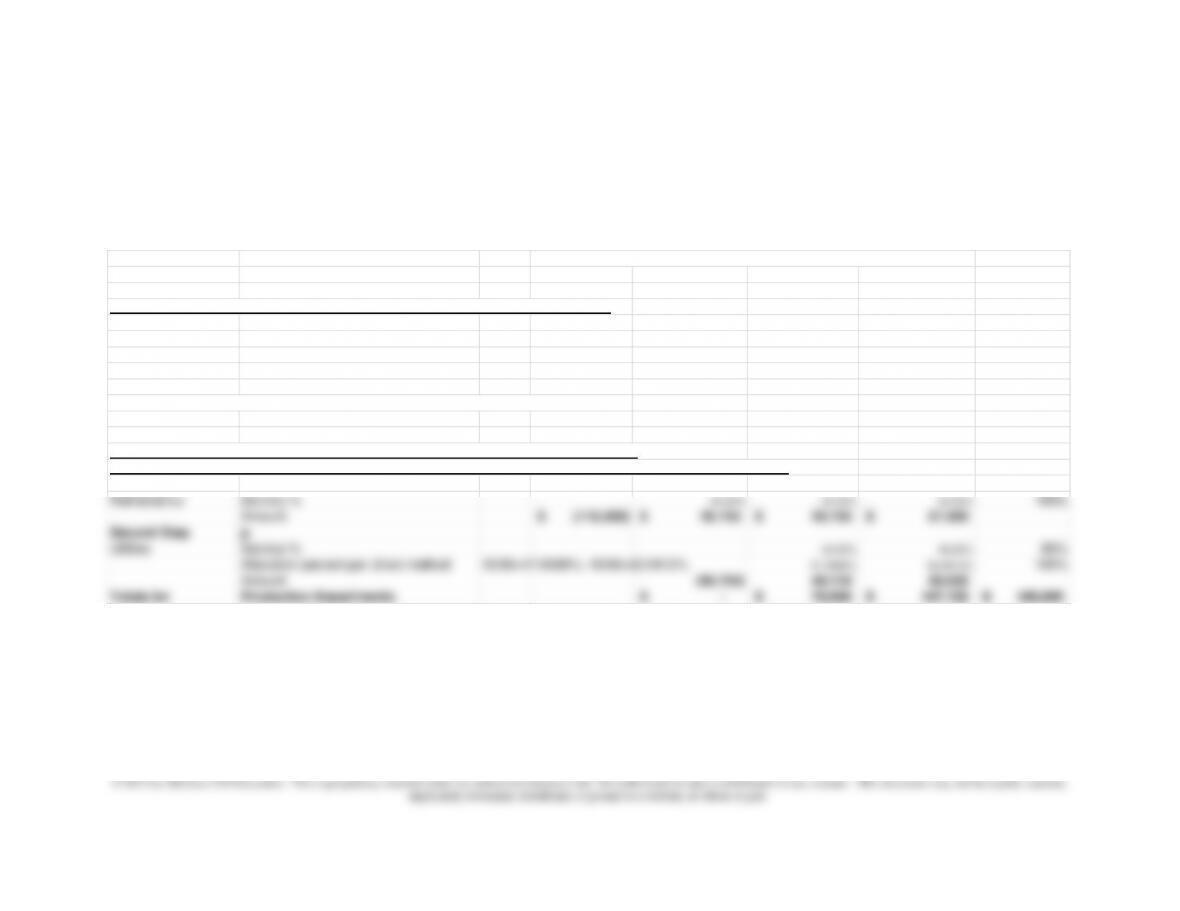
7-40 (continued -1) The Step Method
Base IT Admin Education Program Mgt Mental Health Housing
Total
FIRST PHASE: Trace Direct Costs and Perform Initial Allocation of Indirect Costs
Direct Costs 6,000$ 122,000$ 100,000$ 190,000$ 418,000$
Indirect Costs: –$
Dir Lab Hours
6,250 18,750 12,500 12,500 50,000$
Headcount 2,500 3,750 3,750 5,000 15,000$
Totals for All Departments 14,750$ 144,500$ 116,250$ 207,500$ 483,000$
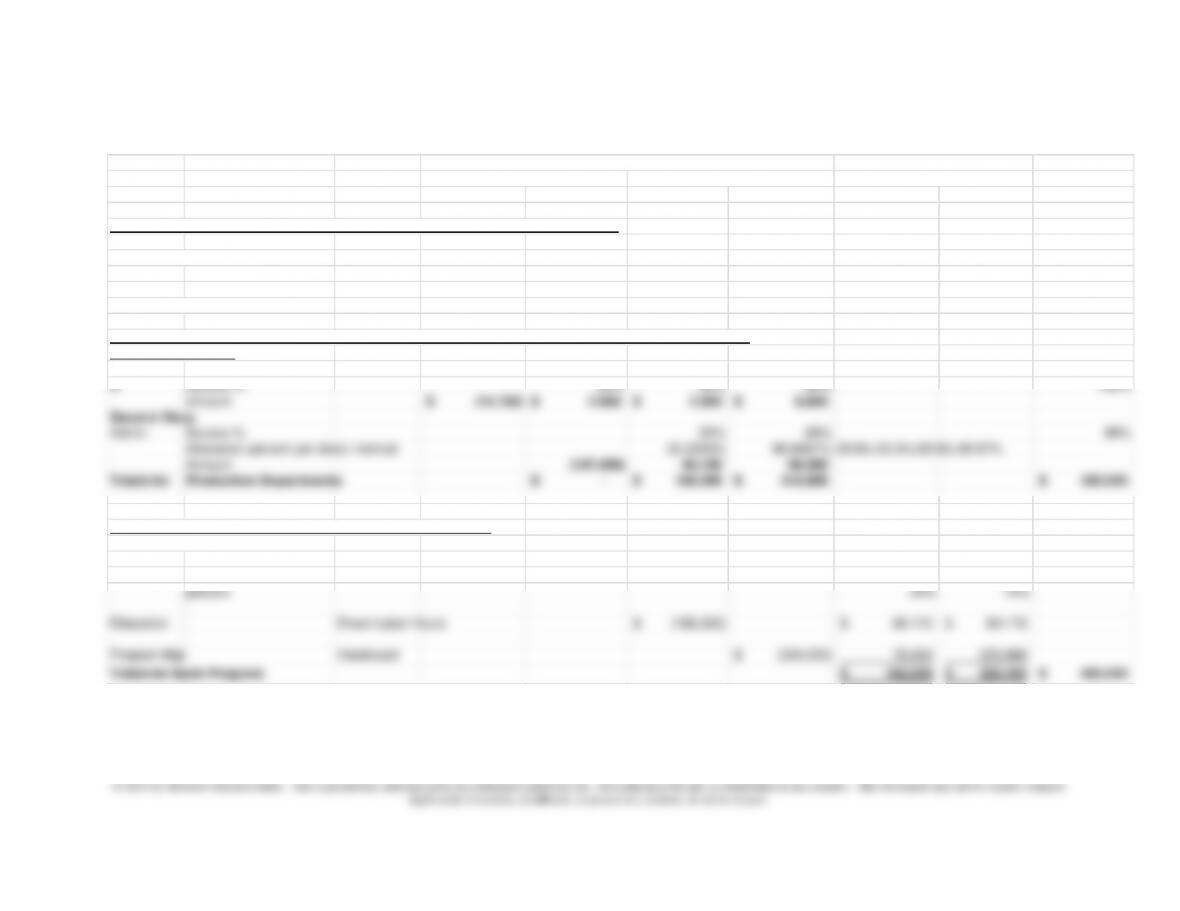
SECOND PHASE: Reallocate Service Department Costs to Education and Program Mgt Departments:
The Step Method
First Step
IT Service % 20% 20% 60% 100%
Amount (14,750)$ 2,950$ 2,950$ 8,850$
Second Ste
p
Admin Service % 30% 60% 90%
Allocation percent per direct method 33.3333% 66.6667% 30/90=33.3%;60/90=66.67%
Amount (147,450) 49,150 98,300
Totals for Production Departments –$ 168,350$ 314,650$ 483,000$
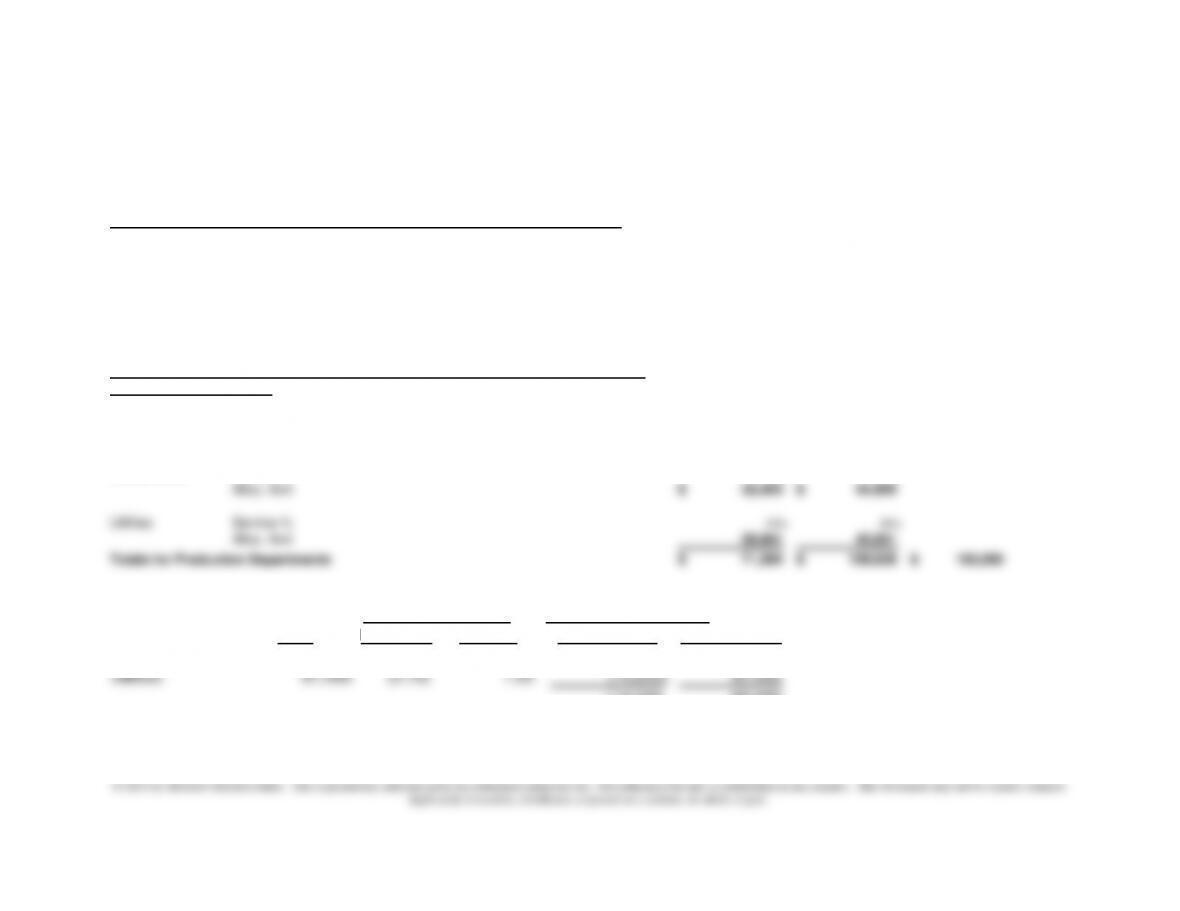
THIRD PHASE: Allocate Main Department Costs to Programs
Base: Direct Labor Hours 2,000 2,000 4,000
percent 50% 50%
Headcount 1 3 4
percent 25% 75%
Departments
Service
Main
Programs