Chapter 7 – Cost Allocation: Departments, Joint Products, and By-Products
7-16
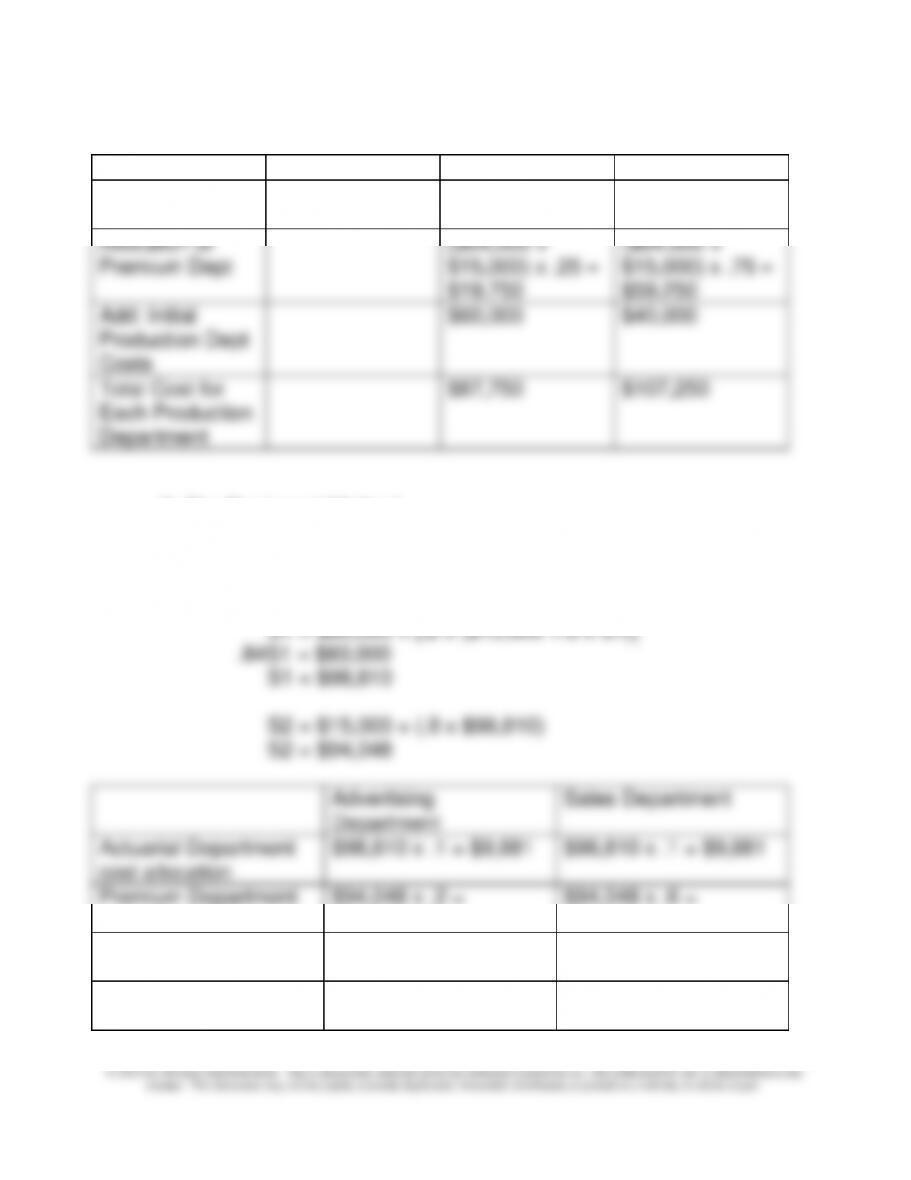
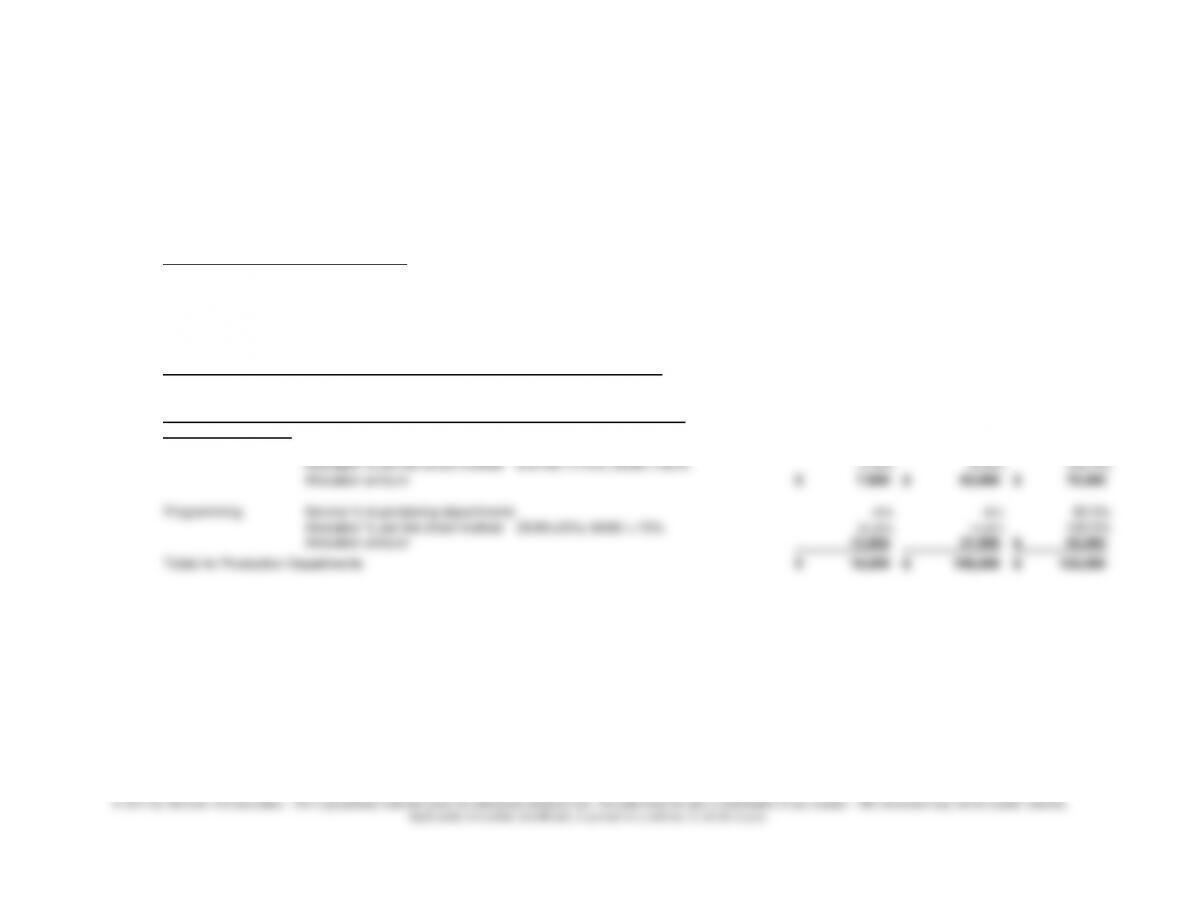
7-28 (continued -1)
Premium Dept.
Advertising Dept
Sales Dept
Allocation of
Actuarial Dept
$80,000 x .8 =
$64,000
$80,000 x .1 =
$8,000
$80,000 x .1 =
$8,000
Allocation of
Premium Dept
($64,000 +
$15,000) x .25 =
$19,750
($64,000 +
$15,000) x .75 =
$59,250
Add: Initial
Production Dept
Costs
$60,000
$40,000
Total Cost for
Each Production
Department
$87,750
$107,250
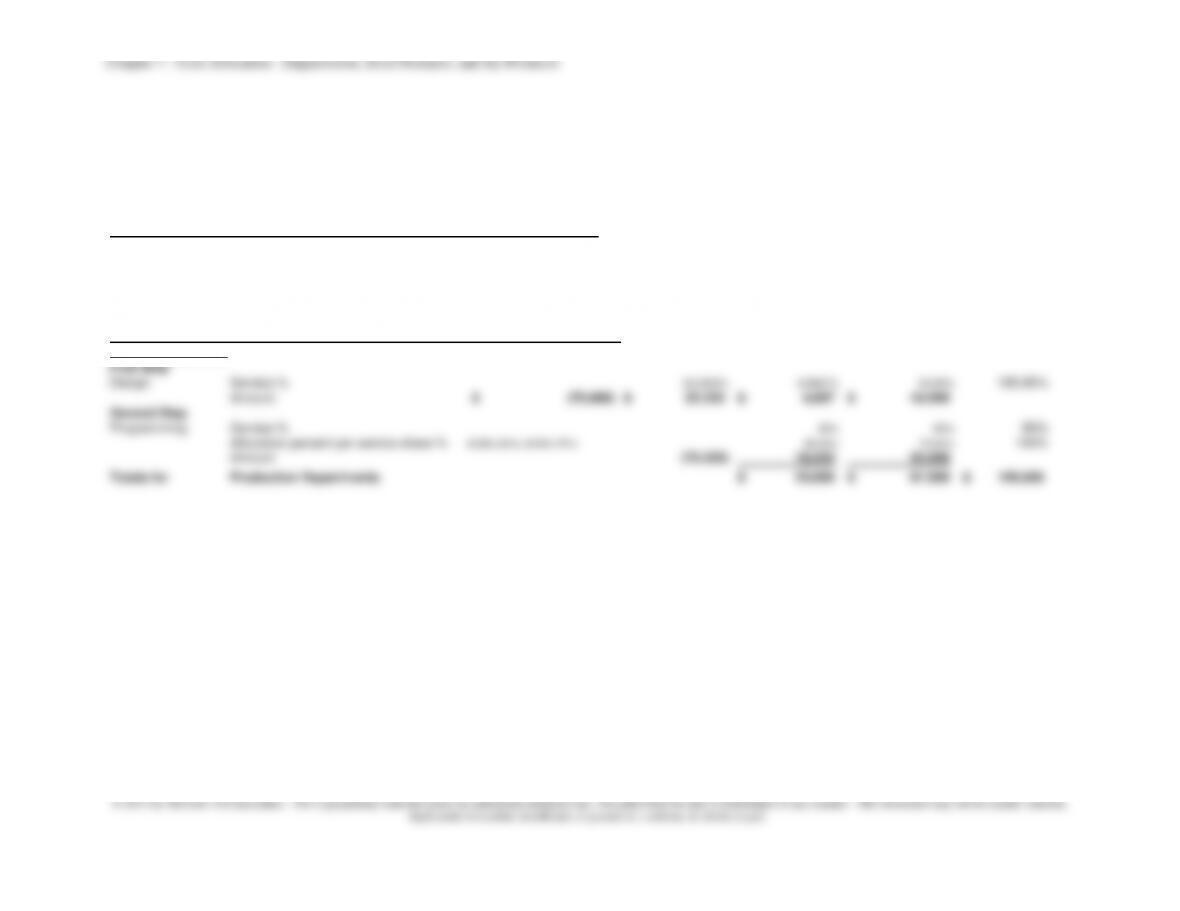
3. The Reciprocal Method
Solve the Simultaneous Equations: (S1=actuarial; S2=premium)
S1 = $80,000 + (.2 x S2)
S2 = $15,000 + (.8 x S1)
Advertising
Department
Sales Department
Actuarial Department
cost allocation
$98,810 x .1 = $9,881
$98,810 x .1 = $9,881
Premium Department
cost allocation
$94,048 x .2 =
$18,809.60
$94,048 x .6 =
$56,428.80
Add: Initial Production
Dept. Costs
$60,000
$40,000
Total Cost for Each
Production Dept.
$88,690.60
$106,309.80
Chapter 7 – Cost Allocation: Departments, Joint Products, and By-Products
7-17
7-29 Departmental Cost Allocation (30 min)
First, find the unknown service rates:
From S1 to P2 = 100% – 10% – 20% = 70%
From S2 to P1 = 100% – 10% – 30% = 60%
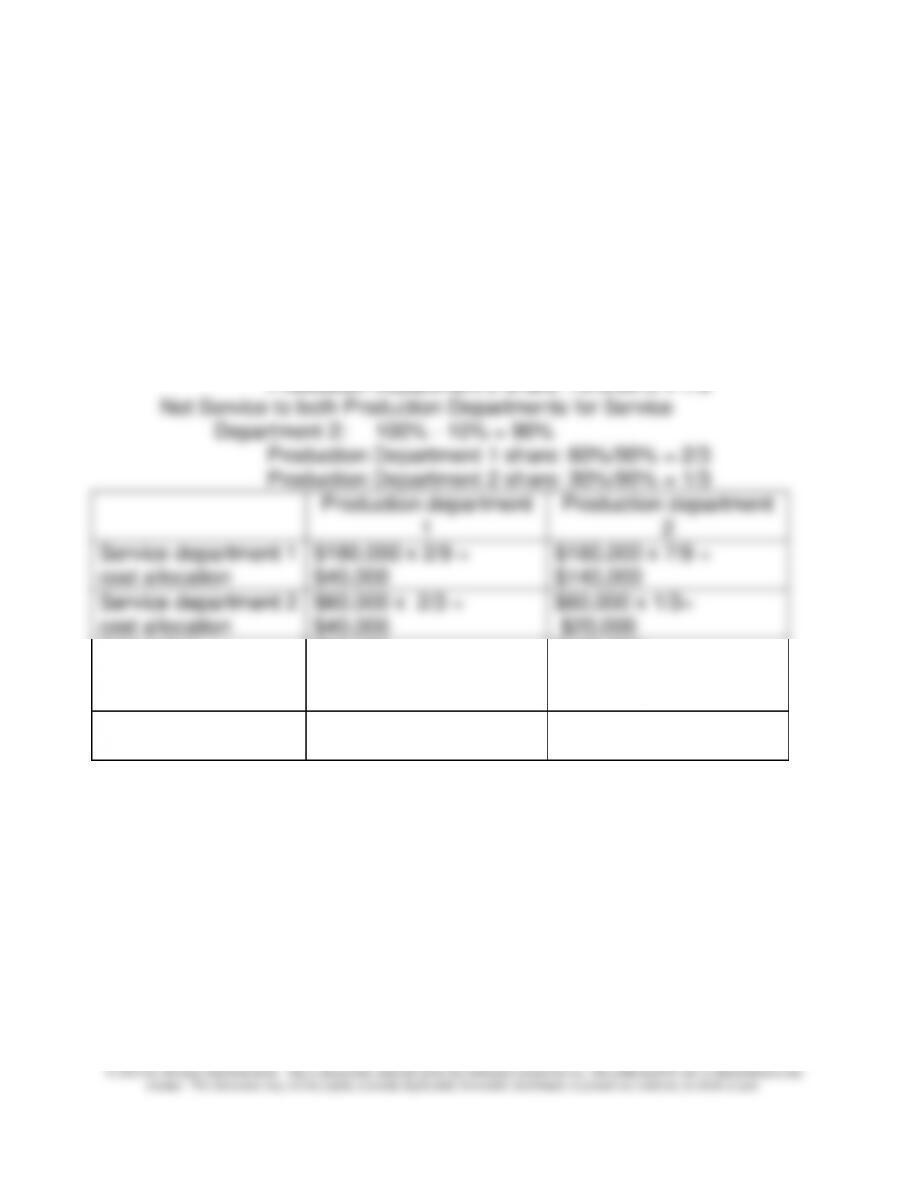
1. The Direct Method
Net service to both Production Departments for Service
Department 1: 100% – 10% = 90%
Production Department 1 share: 20%/90% = 2/9
Production Department 2 share: 70%/90% = 7/9
Production department
1
Production department
2
Service department 1
cost allocation
$180,000 x 2/9 =
$40,000
$180,000 x 7/9 =
$140,000
Service department 2
cost allocation
$60,000 x 2/3 =
$40,000
$60,000 x 1/3=
$20,000
Add: Initial
Production Dept.
Costs
$50,000
$120,000
Total Cost for Each
Production Dept.
$130,000
$280,000
Chapter 7 – Cost Allocation: Departments, Joint Products, and By-Products
7-18
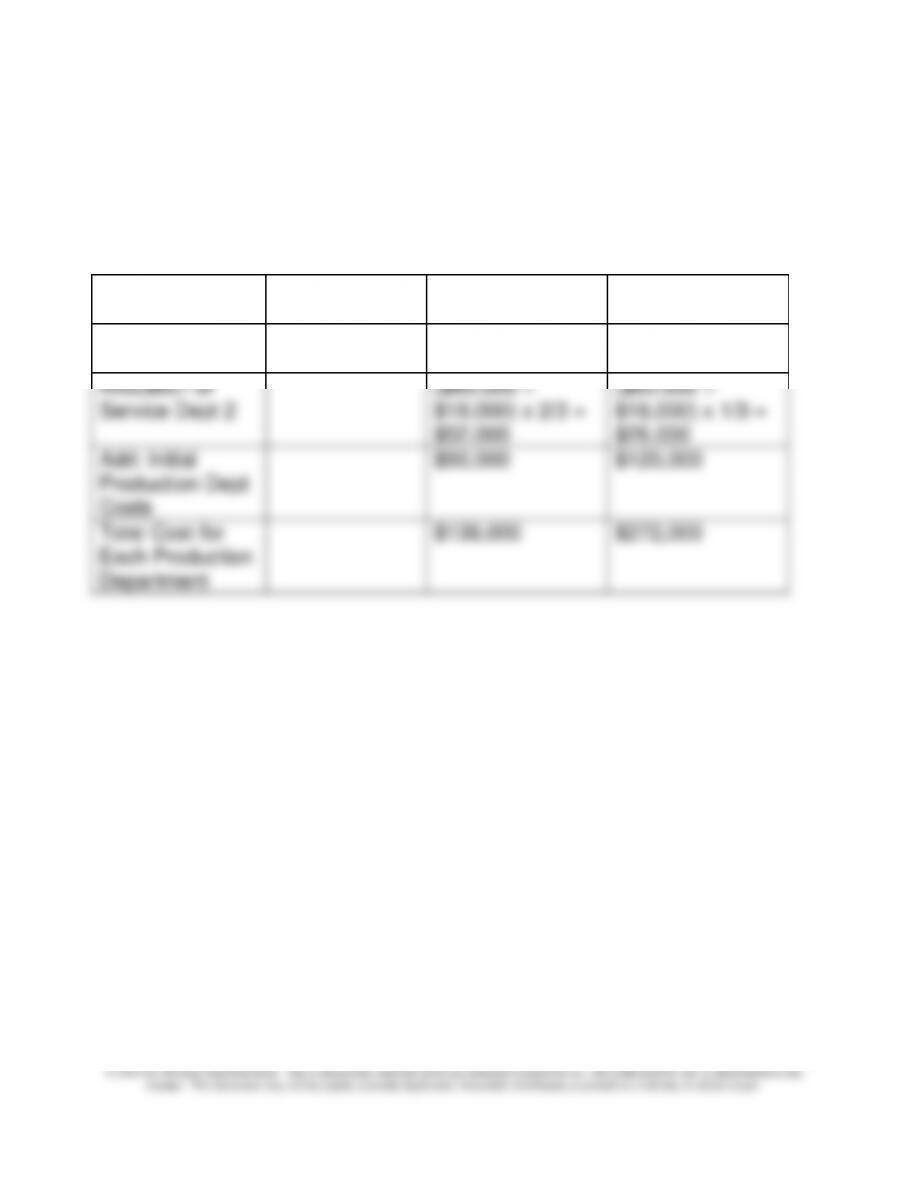
7-29 (continued -1)
2. Step Method
Both service departments serve each other the same percentage of
total service; hence, either can go first. Here, Service Dept 1 goes
first on the basis that it has the highest total cost:
Service Dept 2
Production Dept
1
Production Dept
2
Allocation of
Service Dept 1
$180,000 x .1 =
$18,000
$180,000 x .2 =
$36,000
$180,000 x .7 =
$126,000
Allocation of
Service Dept 2
($60,000 +
$18,000) x 2/3 =
$52,000
($60,000 +
$18,000) x 1/3 =
$26,000
Add: Initial
Production Dept
Costs
$50,000
$120,000
Total Cost for
Each Production
Department
$138,000
$272,000
Chapter 7 – Cost Allocation: Departments, Joint Products, and By-Products
7-19
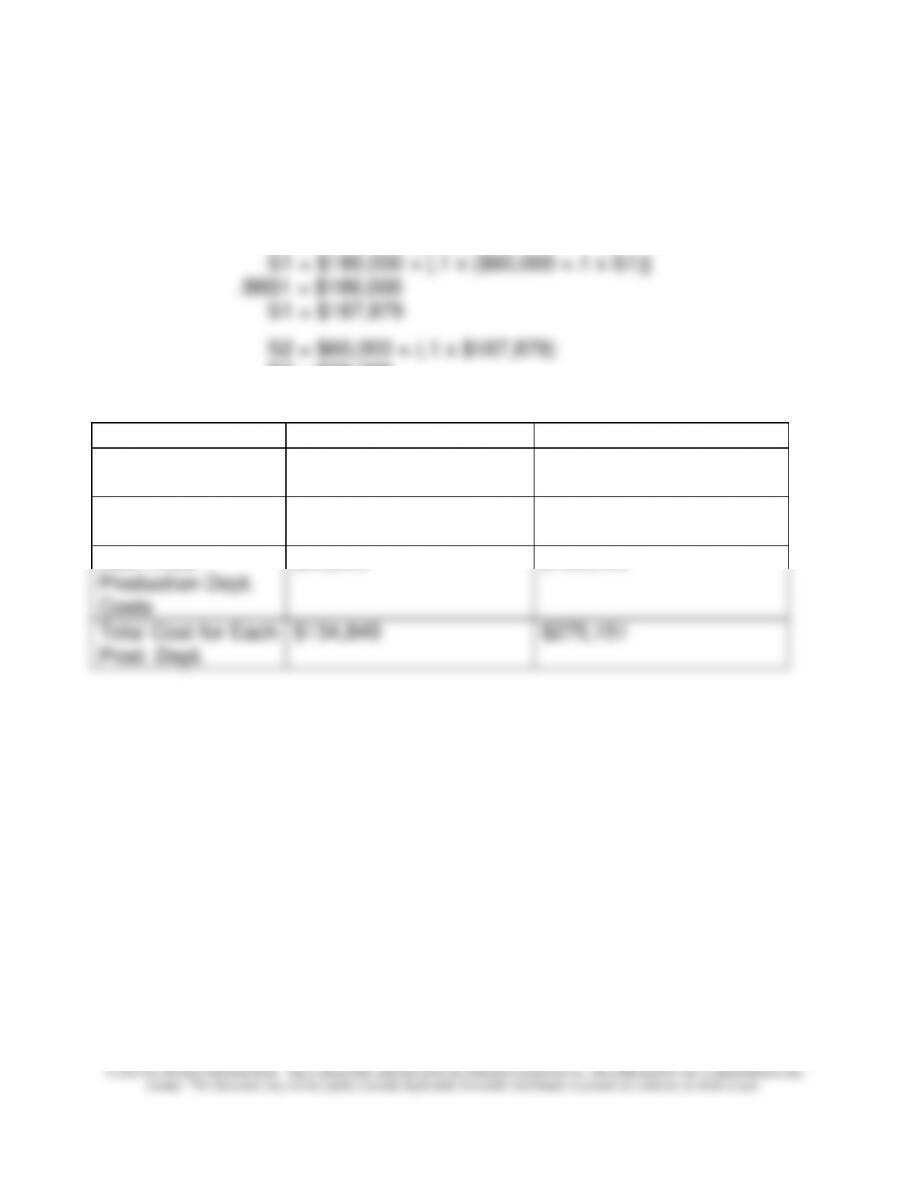
7-29 (continued -2)
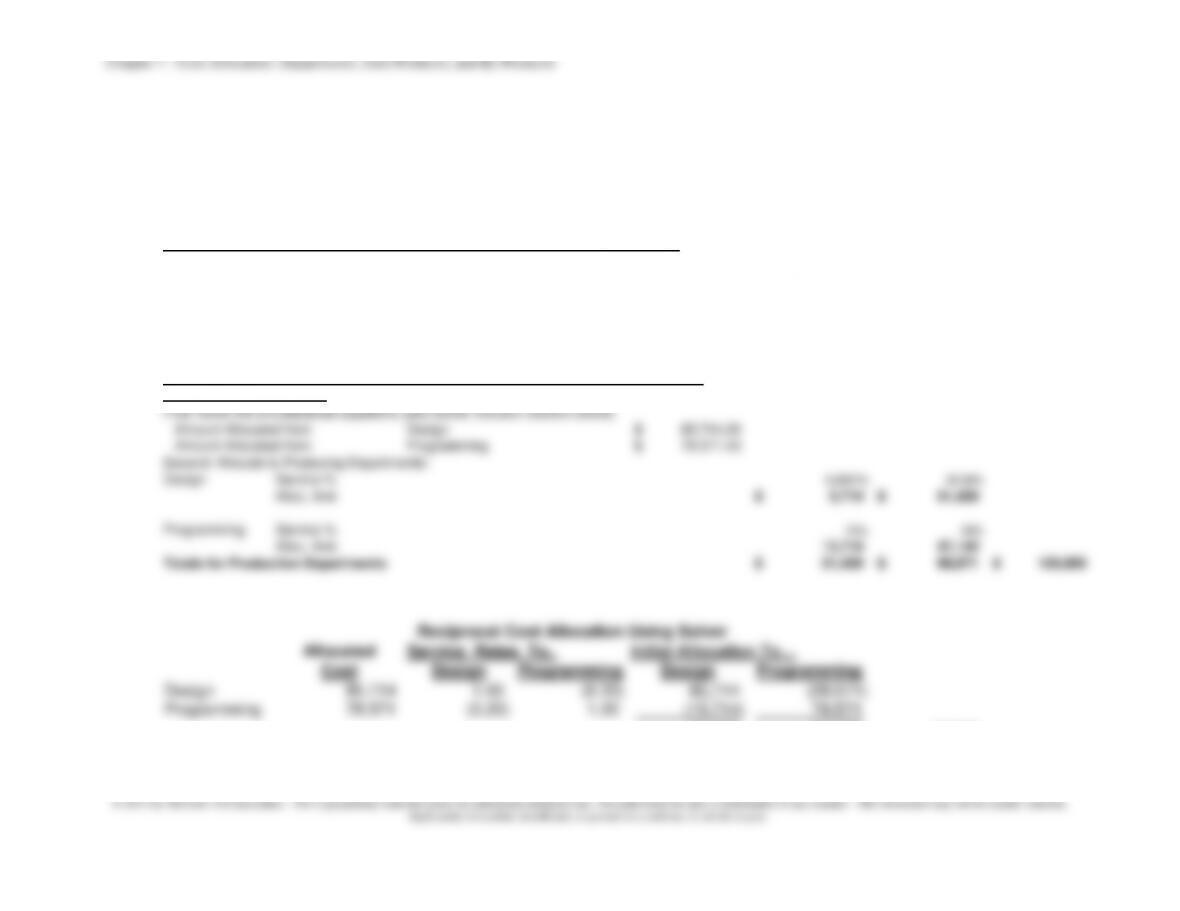
3. The Reciprocal Method
Solve the Simultaneous Equations:
S1 = $180,000 + (.1 x S2)
S2 = $60,000 + (.1 x S1)
S2 = $78,788
Production Department 1
Production Department 2
Service Dept 1
cost allocation
$187,879 x .2 =
$37,576
$187,879 x .7 = $131,515
Service Dept 2
cost allocation
$78,788 x .6 = $47,273
$78,788 x .3 = $23,636
Add: Initial
Production Dept.
Costs
$50,000
$120,000
Total Cost for Each
Prod. Dept.
$134,849
$275,151
7-20
7-30 Joint Products;
As the text notes, the physical units method often involves inappropriate
allocation of costs as the physical measure may be unrelated to the
ultimate value of the different joint products. This appears to be true in the
production of the three blood products, as reported by the U.K. National
Blood Authority (NBA). The result is that prices, when based on allocated
cost, can vary widely as the volumes of each product vary from time to time
due to changes in supply or demand. The NBA’s solution was to charge
all joint costs to the red cells product (a product used primarily in surgery);
additional processing costs are involved, as in this case. So these
methods deserve consideration.
Postscript: a Chartered Institute of Management Accountant’s (CIMA; a
U.K.-based professional organization) study proposed that both the current
and prior allocation methods be replaced with one based on the usefulness
of the three blood products, as assessed by hematologists. This approach
appears to be closer to the net realizable method we have discussed in the
Chapter 7 – Cost Allocation: Departments, Joint Products, and By-Products
7-21
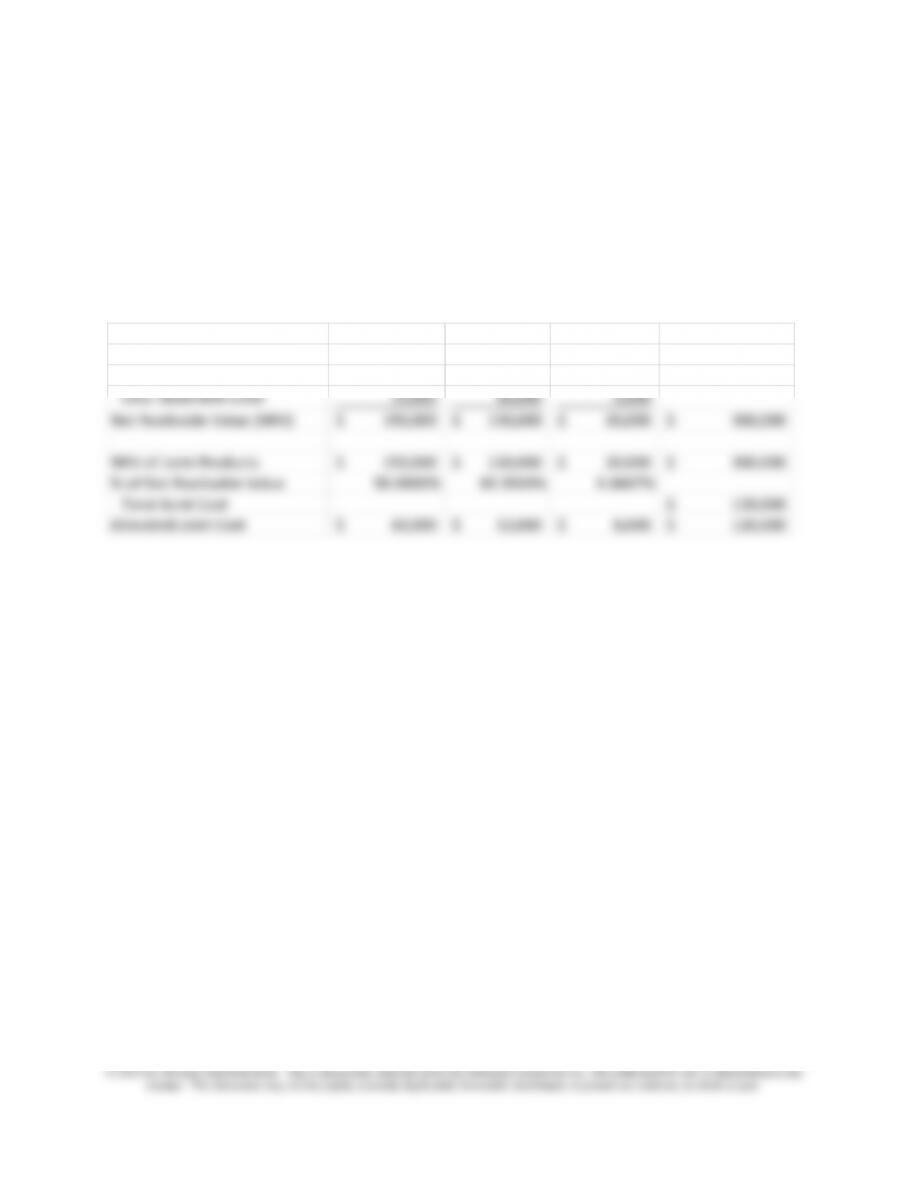
7-31 Joint Products (10 min)
The allocation for the net realizable value method is shown below. Note
however, that Product T has a very small sales value relative to the two
other products. Should it more properly have been treated as a by-
product?
Product M Product N Product T
Units Produced and Sold 10,000 4,000 5,000
Sales Value of Production 160,000$ 140,000$ 25,000$
Less: Separable costs 10,000 10,000 5,000
Net Realizable Value (NRV) 150,000$ 130,000$ 20,000$ 300,000$
NRV of Joint Products 150,000$ 130,000$ 20,000$ 300,000$
% of Net Realizable Value 50.0000% 43.3333% 6.6667%
Total Joint Cost 120,000$
Allocated Joint Cost 60,000$ 52,000$ 8,000$ 120,000$
7-22
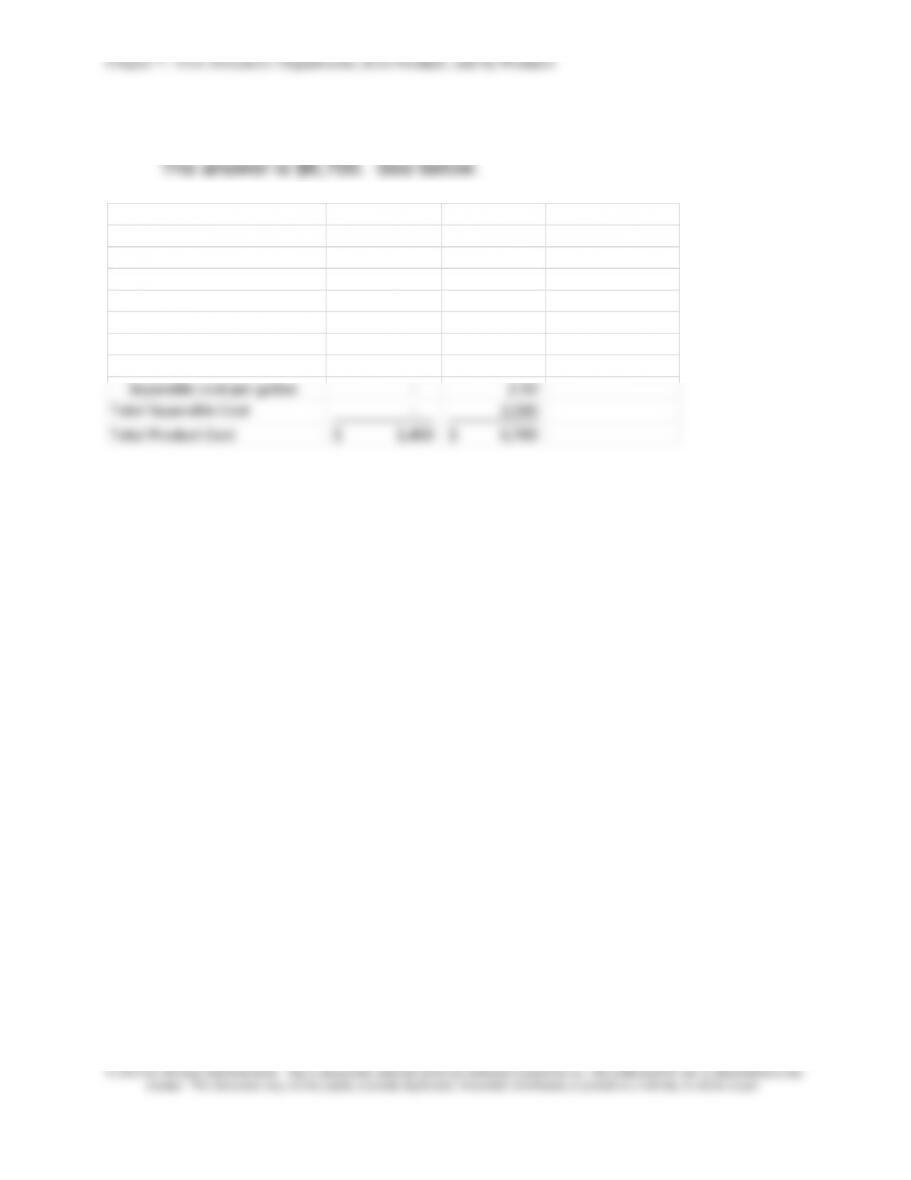
7-32 Joint Products (20 min)
A B
Gallons produced 5,000 1,000
Sales price at Split-off 2.00$ 30.00$
Sales Value at Split-off 10,000$ 30,000$ 40,000$
% of Sales Vale at Split Off 25.00% 75.00%
Total Joint Cost 5,600$
Allocated Joint Cost 1,400$ 4,200$ 5,600$
Separable cost per gallon – 2.50
Total Separable Cost – 2,500
Total Product Cost 1,400$ 6,700$
Note, since the sales value at split off for product A is significantly less than
for product B, the company should consider using by-product costing for
this product.
7-23
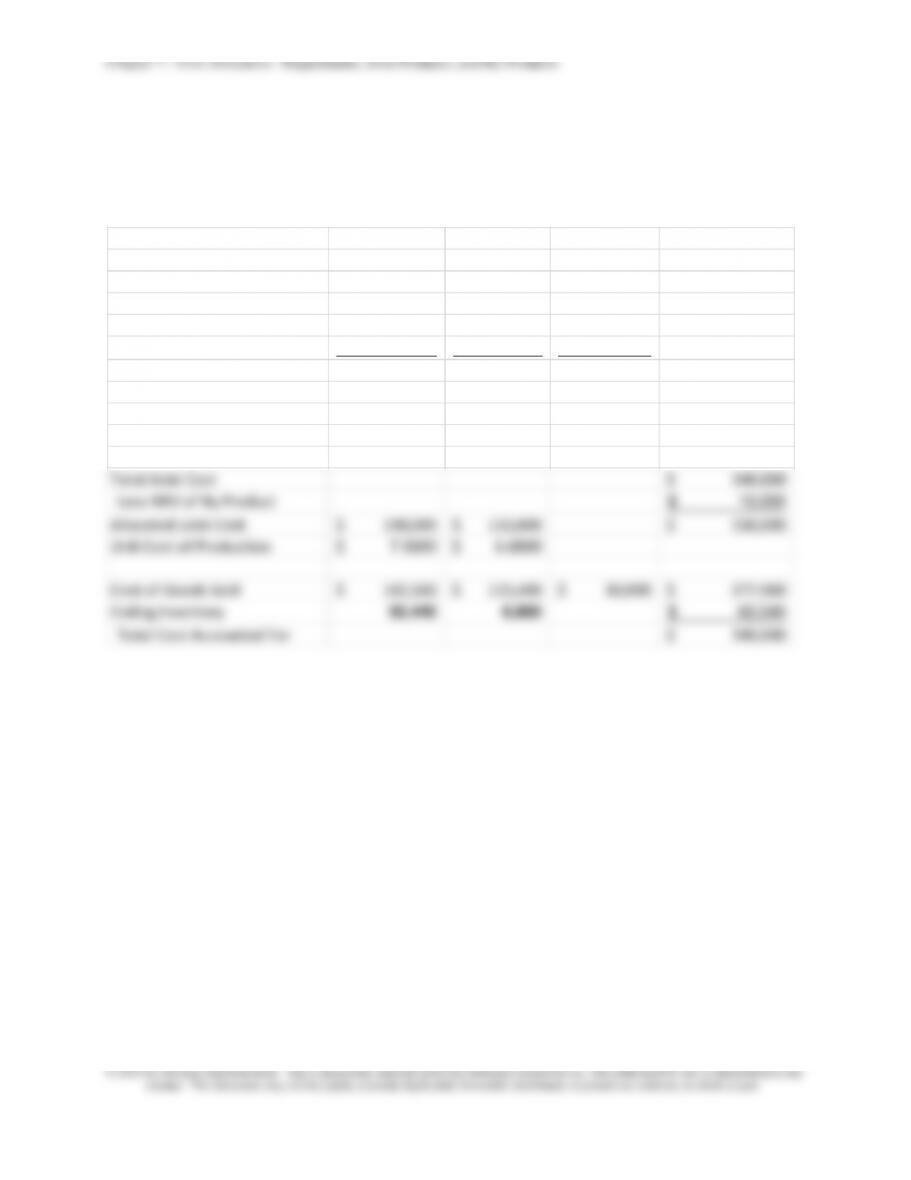
7-33 Joint Product Costing; By-Products (Appendix) (25 min)
1. Ending inventory of Product A $55,440
2. Ending inventory of Product B$ 6,600
Product A Product B Product C Total
Unists Sold 18,000 19,000 10,000
Units Produced 25,000 20,000 10,000
Sales Price 30$ 25$ 1$
Sales Value of Production 750,000$ 500,000$ 10,000$
Less: Separable costs – – –
Net Realizable Value (NRV) 750,000$ 500,000$ 10,000$ 1,260,000$
NRV of Joint Products 750,000$ 500,000$ 1,250,000$
% of Net Realizable Value 60% 40%
Total Joint Cost 340,000$
Less NRV of By Product 10,000$
Allocated Joint Cost 198,000$ 132,000$ 330,000$
Unit Cost of Production 7.9200$ 6.6000$
Cost of Goods Sold 142,560$ 125,400$ 10,000$ 277,960$
Ending Inventory 55,440 6,600 62,040$
Total Cost Accounted For 340,000$
Chapter 7 – Cost Allocation: Departments, Joint Products, and By-Products
7-24
PROBLEMS
7-34 Departmental Cost Allocation; Outsourcing (30 min)
1. Departmental Cost Allocation: Direct Method
Design Programming Dept A Dept B Total
DEPARTMENTAL ALLOCATION BASES
Design – 5,000 1,000 9,000 15,000
percent 0.0% 33.3333% 6.6667% 60.00% 100.00%
Programming 200 200 600 1,000
percent 20.0% 20.0% 60.0% 100%
FIRST PHASE: Trace Direct Costs and Perform Initial Allocation of Indirect Costs
Totals for All Departments
70,000$ 50,000$ –$ –$ 120,000$
SECOND PHASE: Reallocate Service Department Costs to Production Departments:
The Direct Method
Design Service % to producing departments 6.6667% 60.00% 66.667%
Allocation % per the direct method 6.67/66.7=10%; 60/66.7=90% 10.00% 90.00% 100.0%
Allocation amount
7,000$ 63,000$ 70,000$
Programming Service % to producing departments 20% 60% 80.0%
Allocation % per the direct method 20/80=25%; 60/80 = 75% 25.00% 75.00% 100.0%
Allocation amount 12,500 37,500 50,000$
Totals for Production Departments
19,500$ 100,500$ 120,000$
Departments
Service
Production
7-25
7-34 (continued -1)
b. Step Method (Design Department goes first)
Design Programming Dept A Dept B Total
FIRST PHASE: Trace Direct Costs and Perform Initial Allocation of Indirect Costs
Design 5,000 1,000 9,000 15,000
percent 33.3333% 6.6667% 60.00% 100.00%
Programming 200 200 600 1,000
20.0% 20.0% 60.0% 100.0%
70,000$ 50,000$ –$ –$ 120,000$
SECOND PHASE: Reallocate Service Department Costs to Production Departments:
The Step Method
First Step
Design Service % 33.3333% 6.6667% 60.00% 100.00%
Amount
(70,000)$ 23,333$ 4,667$ 42,000$
Second Step
Programming Service % 20% 60% 80%
Allocation percent per service share % 20/80=25%; 60/80=75% 25.00% 75.00% 100%
Amount (73,333) 18,333 55,000
Totals for Production Departments 23,000$ 97,000$ 120,000$
Departments
7-34 (continued –2)
c. The Reciprocal Method (using
Solver)
Base Design Programming Dept A Dept B Total
FIRST PHASE: Trace Direct Costs and Perform Initial Allocation of Indirect Costs
Design 5,000 1,000 9,000 15,000
percent 33.3333% 6.6667% 60.00% 100.00%
Programming 200 200 600 1,000
20% 0% 20% 60% 100%
Totals for All Departments
70,000$ 50,000$ –$ –$ 120,000$
SECOND PHASE: Reallocate Service Department Costs to Production Departments:
The Reciprocal Method
First: Solve the simultaneous equations (see Solver Solution Section below)
Amount Allocated from Design 85,714.29$
Amount Allocated from Programming 78,571.43$
Second: Allocate to Producing Departments:
Design Service % 6.6667% 60.00%
Alloc. Amt
5,714$ 51,429$
Programming Service % 20% 60%
Alloc. Amt
15,714 47,143
Totals for Production Departments 21,429$ 98,571$ 120,000$
Departments
Chapter 7 – Cost Allocation: Departments, Joint Products, and By-Products
7-27
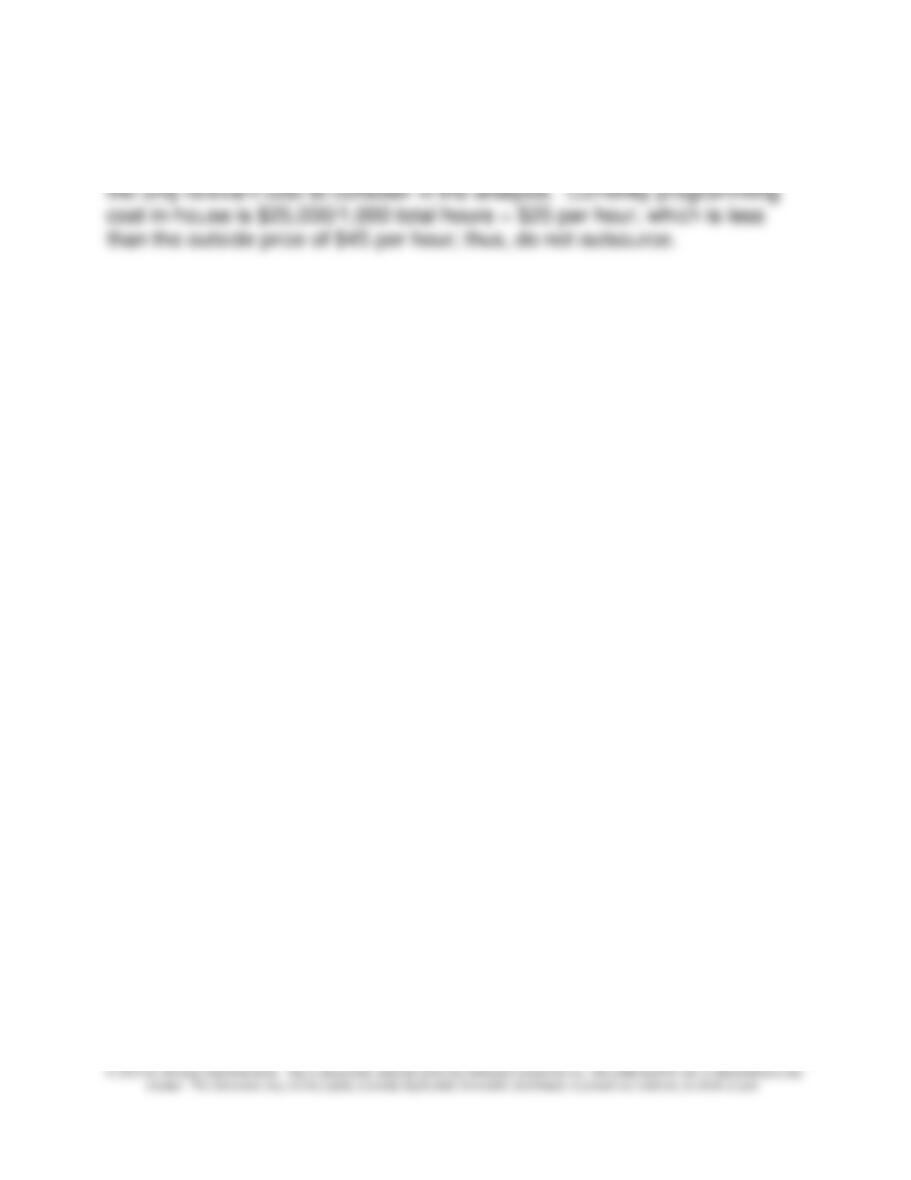
7-34 (continued –3)
2. Assuming total fixed costs remain the same, the current variable cost is
Chapter 7 – Cost Allocation: Departments, Joint Products, and By-Products
7-28
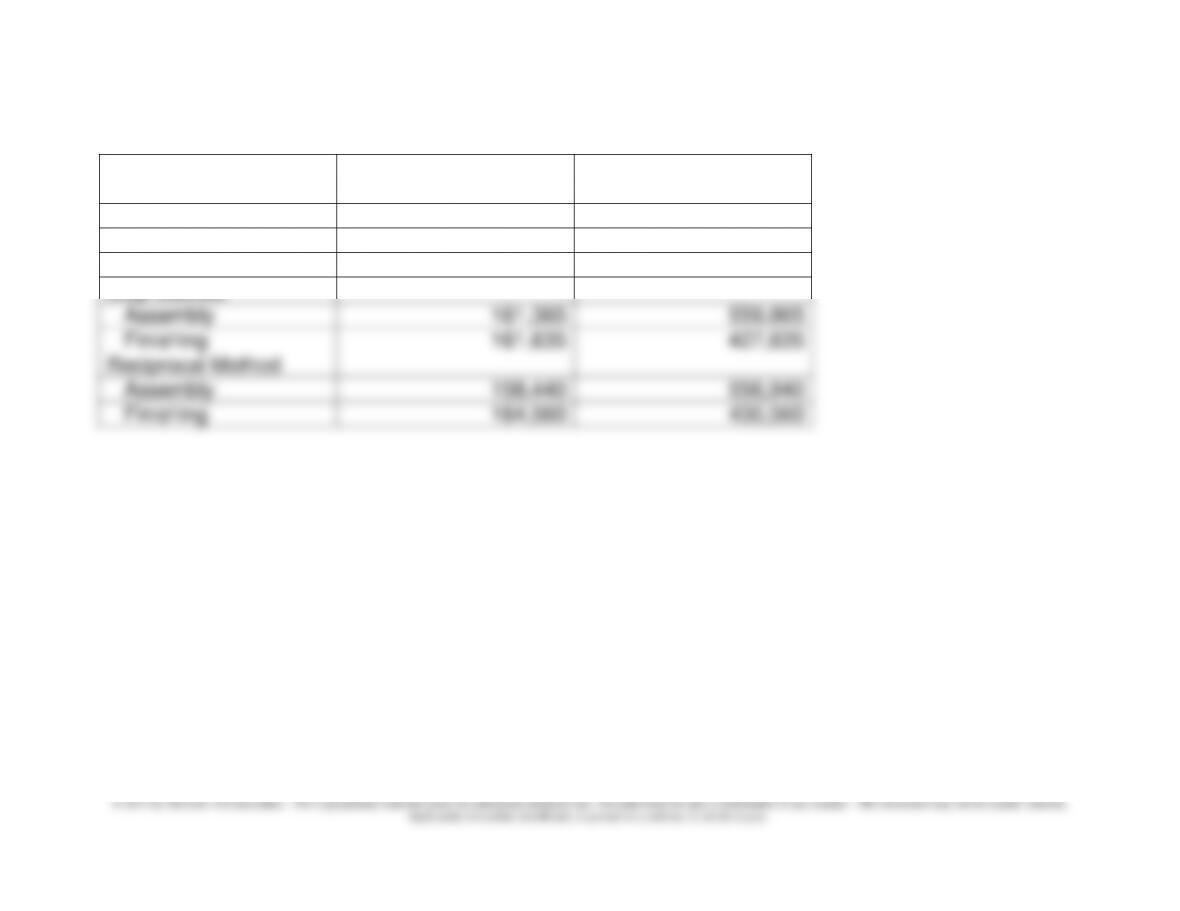
7-35 Departmental Cost Allocation (30 min)
1., 2.
Total Service Dept.
Cost Allocated
Total Production Cost
Direct Method
Assembly
$157,435
$555,935
Finishing
165,565
431,565
Step Method
Assembly
161,365
559,865
Finishing
161,635
427,635
Reciprocal Method
Assembly
158,440
556,940
Finishing
164,560
430,560
See following pages for calculations.
7-29
7-35 (continued –1)
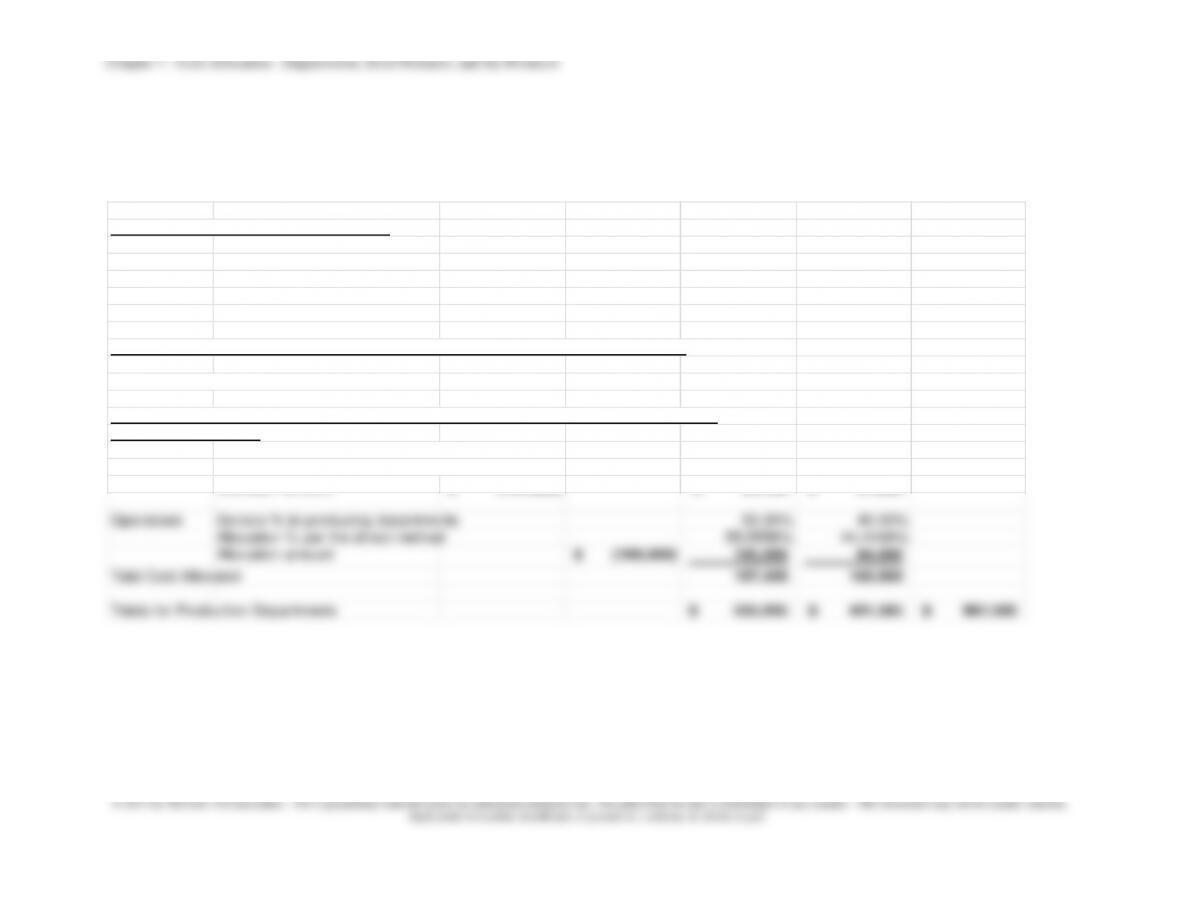
The Direct Method
Sourcing Operations Asssembly Finishing
Total
DEPARTMENTAL ALLOCATION BASES
Sourcing 25,000 45,000 70,000 140,000
percent 17.8571% 32.1429% 50.00% 100%
Operations 10,000 50,000 40,000 100,000
percent 10.00% 50.00% 40.00% 100%
FIRST PHASE: Trace Direct Costs and Perform Initial Allocation of Indirect Costs
Totals for All Departments 134,000$ 189,000$ 398,500$ 266,000$ 987,500$
SECOND PHASE: Reallocate Service Department Costs to Production Departments:
The Direct Method
Sourcing Service % to producing departments 32.1429% 50.0000%
Allocation % per the direct method 39.1304% 60.8696%
Allocation amount (134,000)$ 52,435$ 81,565$
Operations Service % to producing departments 50.00% 40.00%
Allocation % per the direct method 55.5556% 44.4444%
Allocation amount (189,000)$ 105,000 84,000
Total Cost Allocated 157,435 165,565
Totals for Production Departments 555,935$ 431,565$ 987,500$
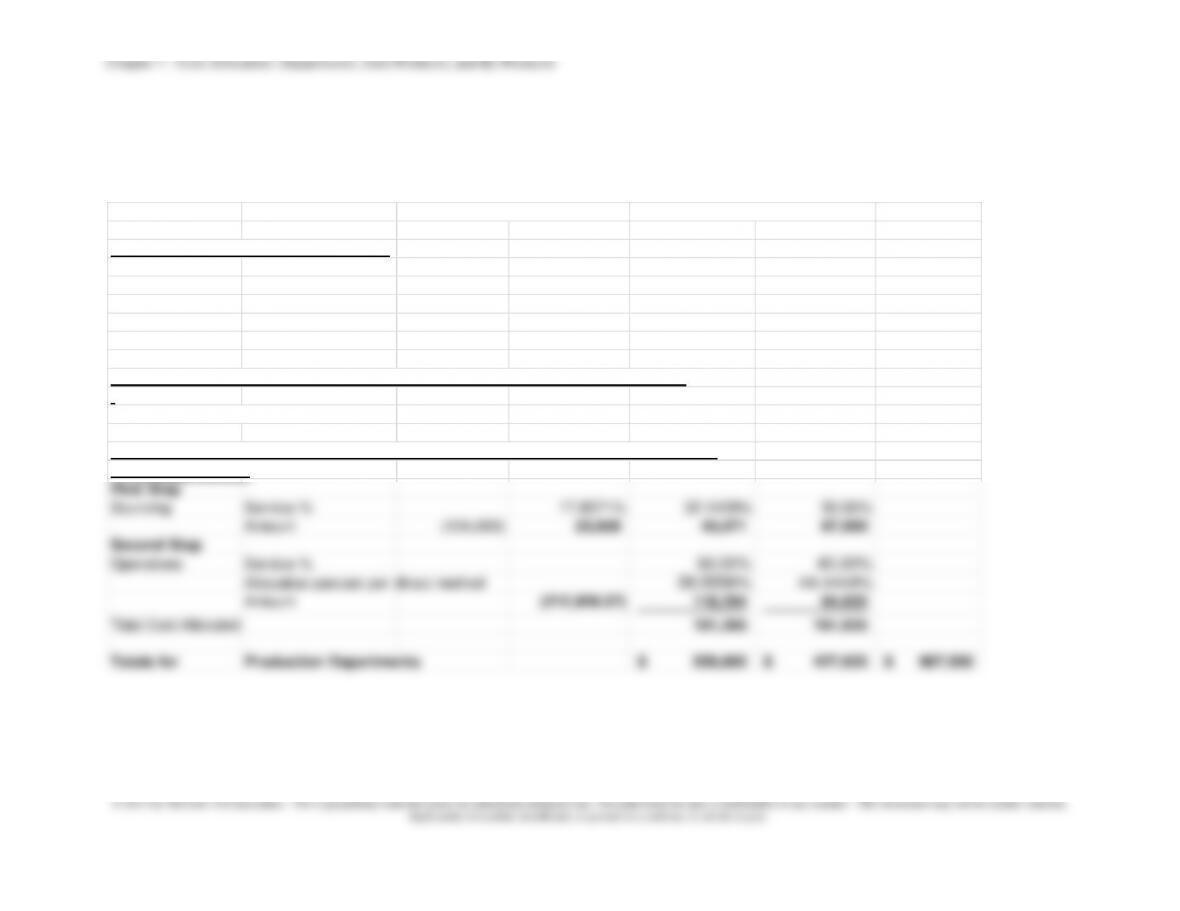
7-35 (continued-2)
The Step Method
Sourcing Operations Asssembly Finishing Total
DEPARTMENTAL ALLOCATION BASES
Sourcing 25,000 45,000 70,000 140,000
percent 17.8571% 32.1429% 50.00% 100%
Operations 10,000 50,000 40,000 100,000
percent 10.00% 50.00% 40.00% 100%
FIRST PHASE: Trace Direct Costs and Perform Initial Allocation of Indirect Costs
Totals for All Departments 134,000 189,000 398,500 266,000 987,500
SECOND PHASE: Reallocate Service Department Costs to Production Departments:
The Step Method
First Step
Sourcing Service % 17.8571% 32.1429% 50.00%
Amount (134,000) 23,929 43,071 67,000
Second Step
Operations Service % 50.00% 40.00%
Allocation percent per direct method 55.5556% 44.4444%
Amount (212,928.57) 118,294 94,635
Total Cost Allocated 161,365 161,635
Support Departments
Producing Departments