Chapter 5 – Activity-Based Costing and Customer Profitability Analysis
5-31
5-42 (continued-1)
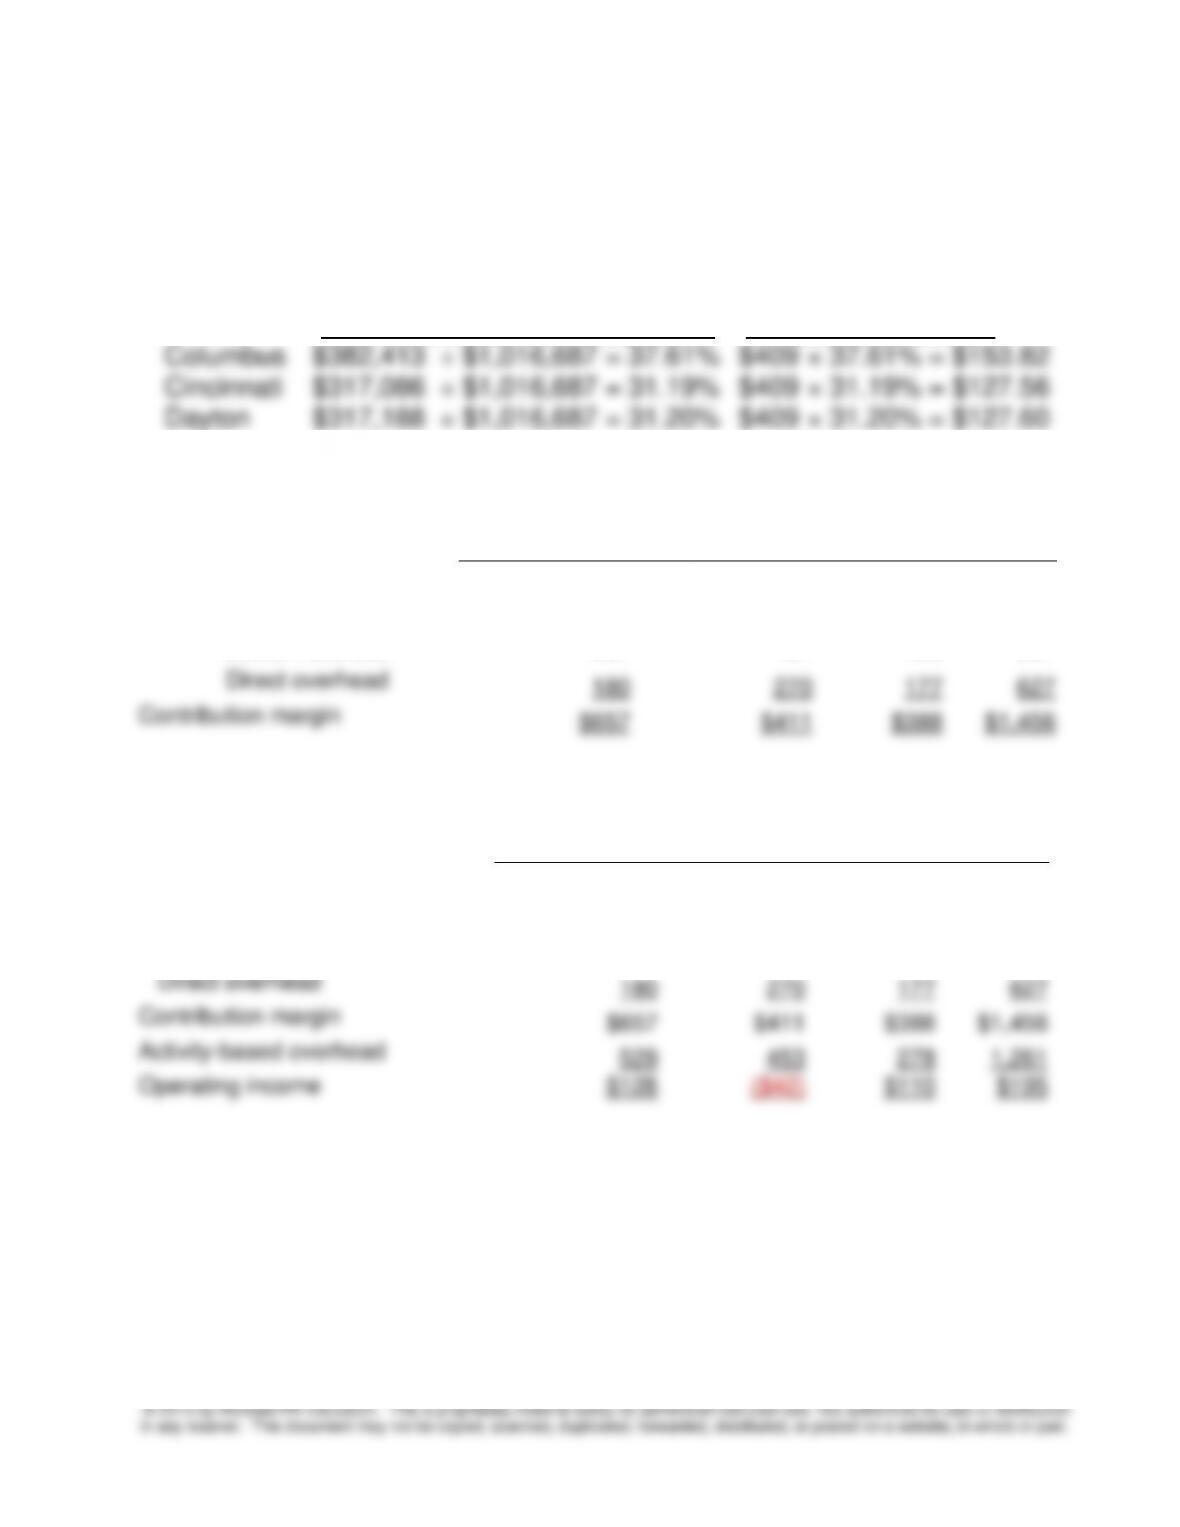
Calculation for general administration allocated to branches:
Total direct labor dollar: $382,413 + $317,086 + $317,188 = $1,016,687
Allocation of general administration based on direct labor dollar:
Proportion Allocated Amount
2. Contribution of each branch:
Columbus
Cincinnati
Dayton
Total
Sales
$1,500
$1,419
$1,067
$3,986
Less: Direct labor
382
317
317
1,016
Direct materials
281
421
185
887
Direct overhead
180
270
177
627
Contribution margin
$657
$411
$388
$1,456
3. Profitability of each branch using activity-based costing:
Columbus
Cincinnati
Dayton
Total
Sales
$1,500
$1,419
$1,067
$3,986
Less: Direct labor
382
317
317
1,016
Direct materials
281
421
185
887
Direct overhead
180
270
177
627
Contribution margin
$657
$411
$388
$1,456
Activity-based overhead
529
453
278
1,261
Operating income
$128
($42)
$110
$195
Chapter 5 – Activity-Based Costing and Customer Profitability Analysis
5-32
5-42 (continued-2)
4. Evaluating management concerns:
Overhead costs are usually aggregated in pools and allocated to
products and other cost objects based on volume measures such as
direct labor dollars or machine hours. The cost object, therefore,
supposedly shares proportionally in those costs necessary for its
production or existence. If however, overhead varies in accordance with
addition, existing marketing strategy may be promoting the wrong
location and strategic planning may be based on spurious assumptions
concerning relative profitability.
This case also illustrates that ABC is applicable to service organizations
as well as to manufacturing and that cost objects can consist of projects,
locations, customers, etc., as well as products. In essence, the better
Chapter 5 – Activity-Based Costing and Customer Profitability Analysis
5-33
5-43 Volume-based Costing Versus ABC (40 min)
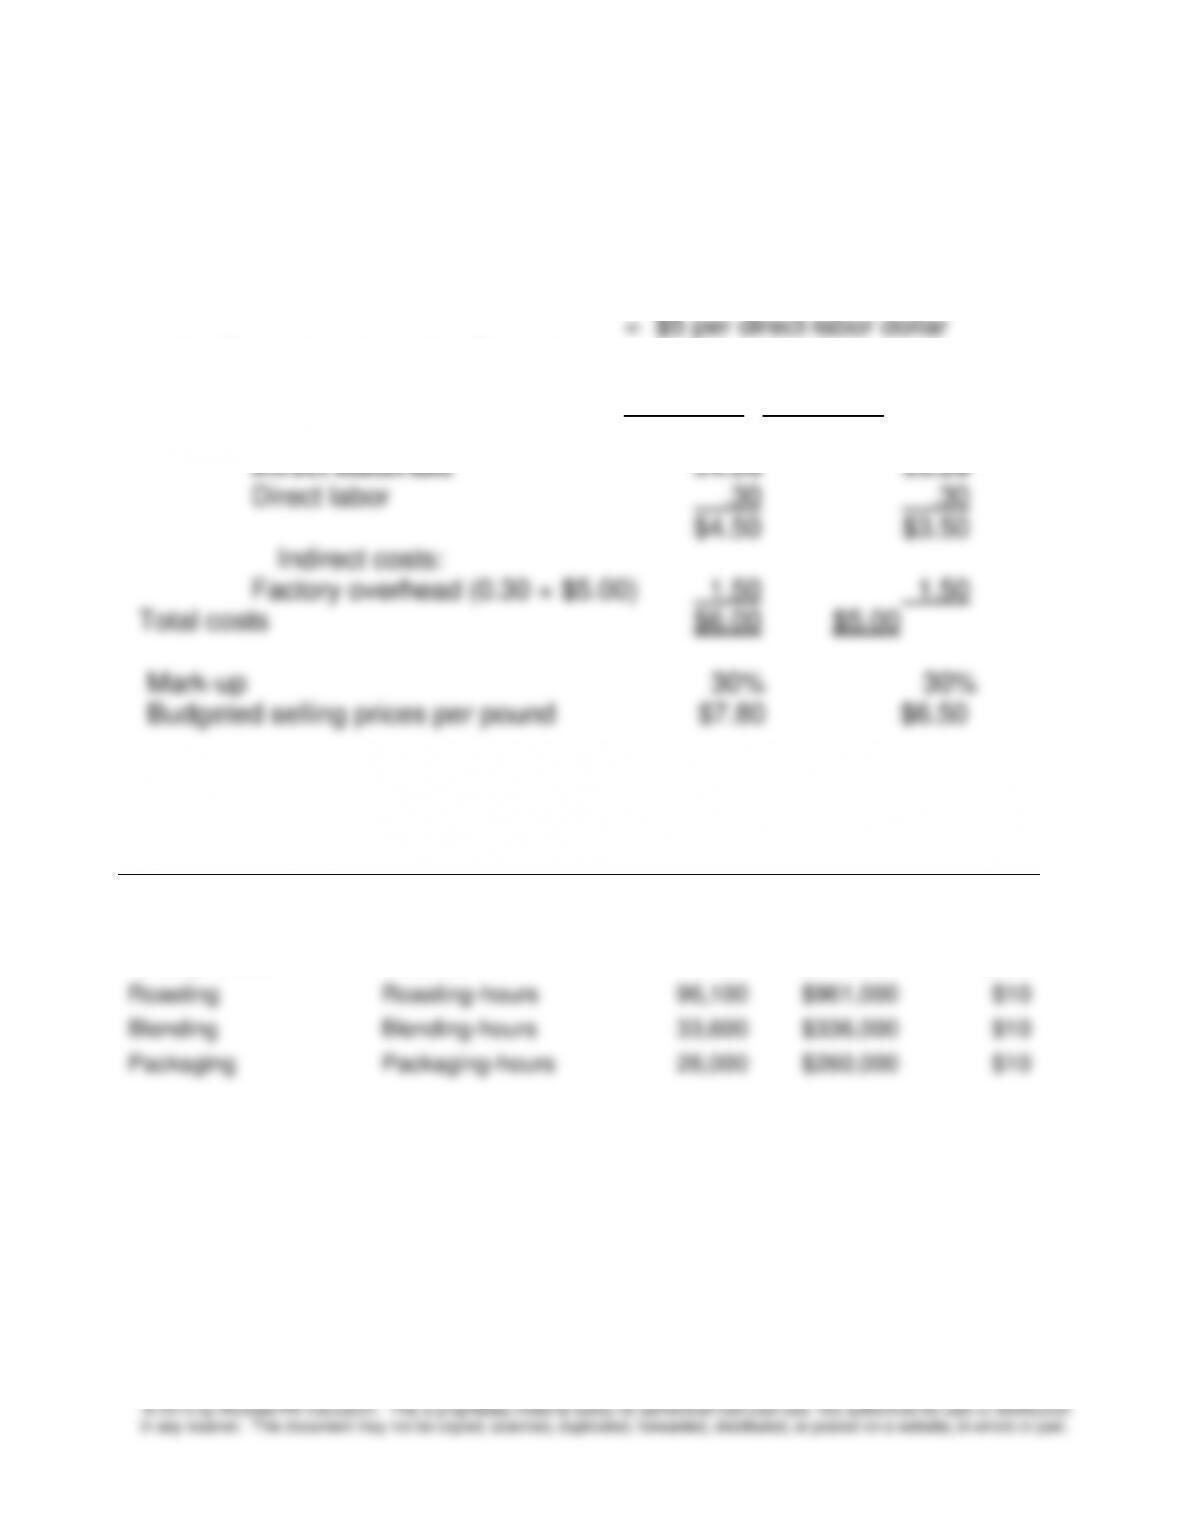
1. a. Predetermined factory overhead rate = $3,000,000 ÷ $600,000
= $5 per direct-labor dollar
b. Product costs and selling prices
Product Costs Mona Loa Malaysian
Direct costs:
2. The cost per driver unit is:
Activity
Cost Driver
Budgeted
Activity
Budgeted
Cost
Cost per
Unit
Purchasing
Purchase orders
1,158
$579,000
$500
Materials handling
Setups
1,800
$720,000
$400
Quality control
Batches
720
$144,000
$200
Roasting
Roasting-hours
96,100
$961,000
$10
Blending
Blending-hours
33,600
$336,000
$10
Packaging
Packaging-hours
26,000
$260,000
$10
Chapter 5 – Activity-Based Costing and Customer Profitability Analysis
5-34
5-43 (continued-1)
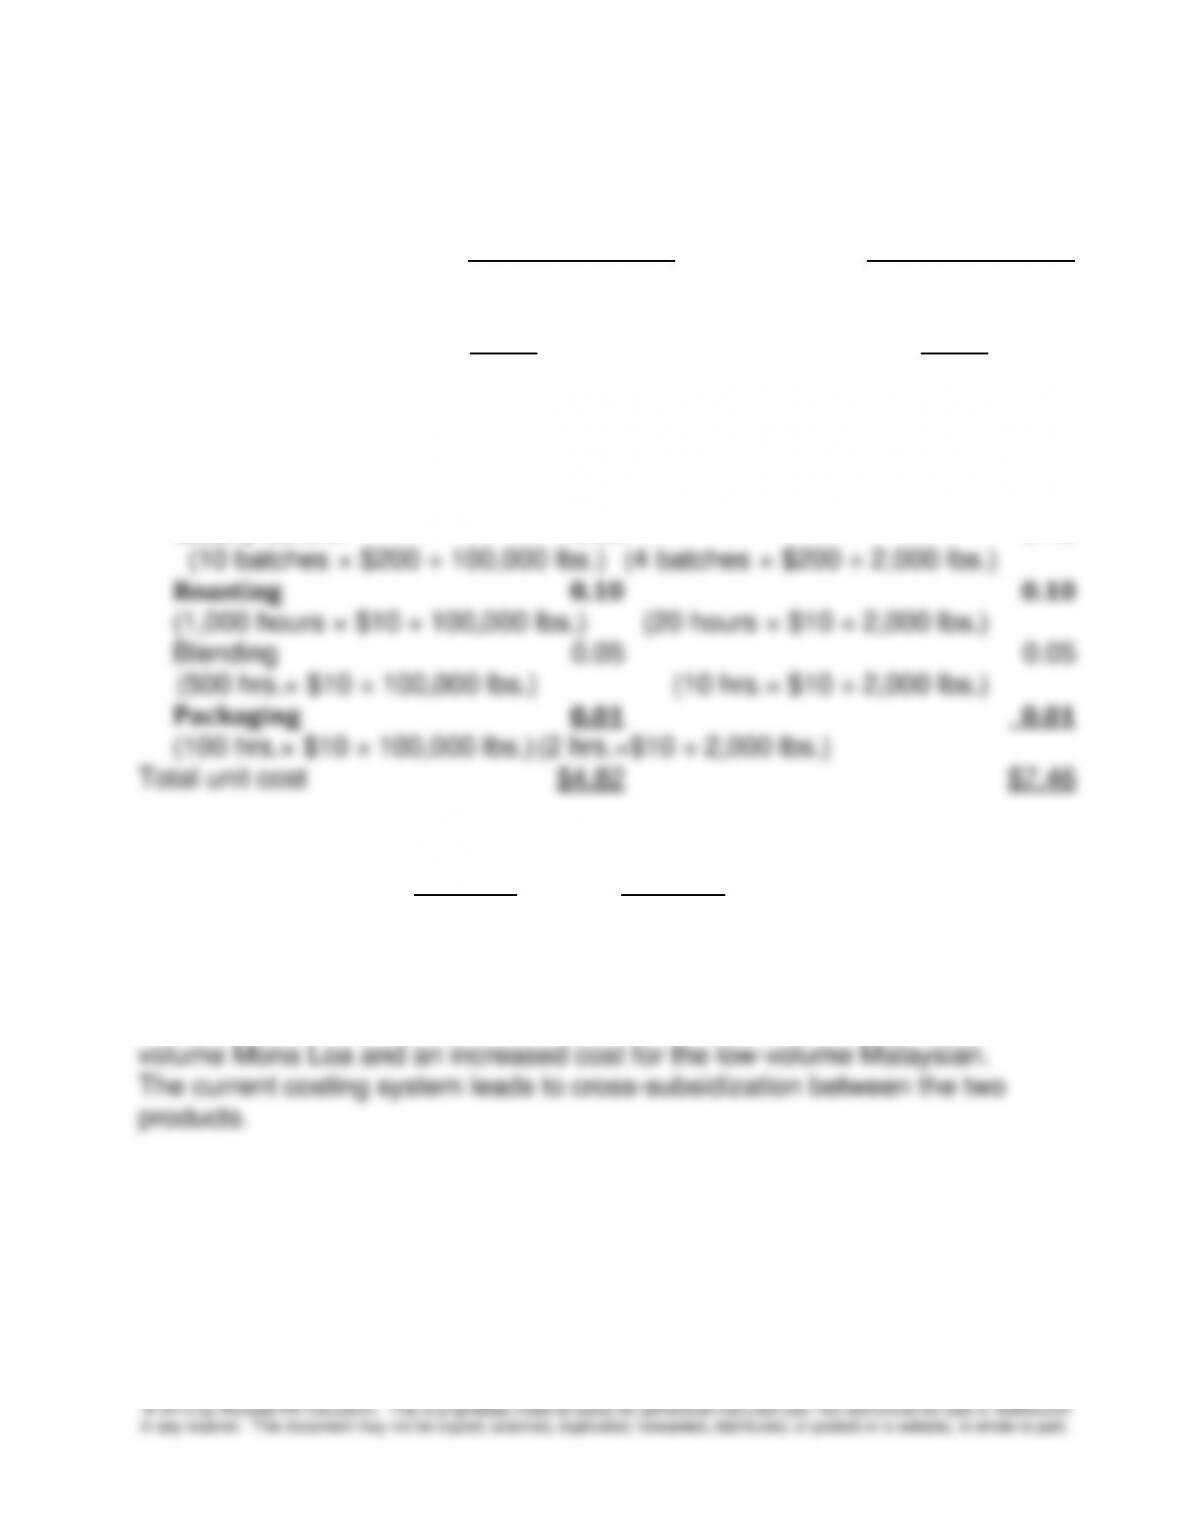
The budgeted unit costs per pound are:
Mona Loa Coffee Malaysian Coffee
Direct unit costs:
Direct materials $4.20 $3.20
Direct labor 0.30 $4.50 0.30 $3.50
Indirect unit costs:
Purchasing 0.02 1.00
(4 orders × $500 ÷ 100,000 lbs.) (4 orders × $500 ÷ 2,000 lbs.)
Material handling 0.12 2.40
(30 setups × $400 ÷ 100,000 lbs.) (12 setups × $400 ÷ 2,000 lbs.)
Quality control 0.02 0.40
The comparative cost numbers are:
Mona Loa
Malaysian
Requirement 1
$6.00
$5.00
Requirement 2
4.82
7.46
The ABC system in requirement 2 reports a decreased cost for the high–
Chapter 5 – Activity-Based Costing and Customer Profitability Analysis
5-35
5-43 (continued-2)
3. Three of the indirect cost items can be classified as output-unit driven:
Mona Loa
Coffee
Malaysian
Coffee
Roasting
$0.10
$0.10
Blending
0.05
0.05
Packaging
0.01
0.01
Total output-unit overhead
$0.16
$0.16
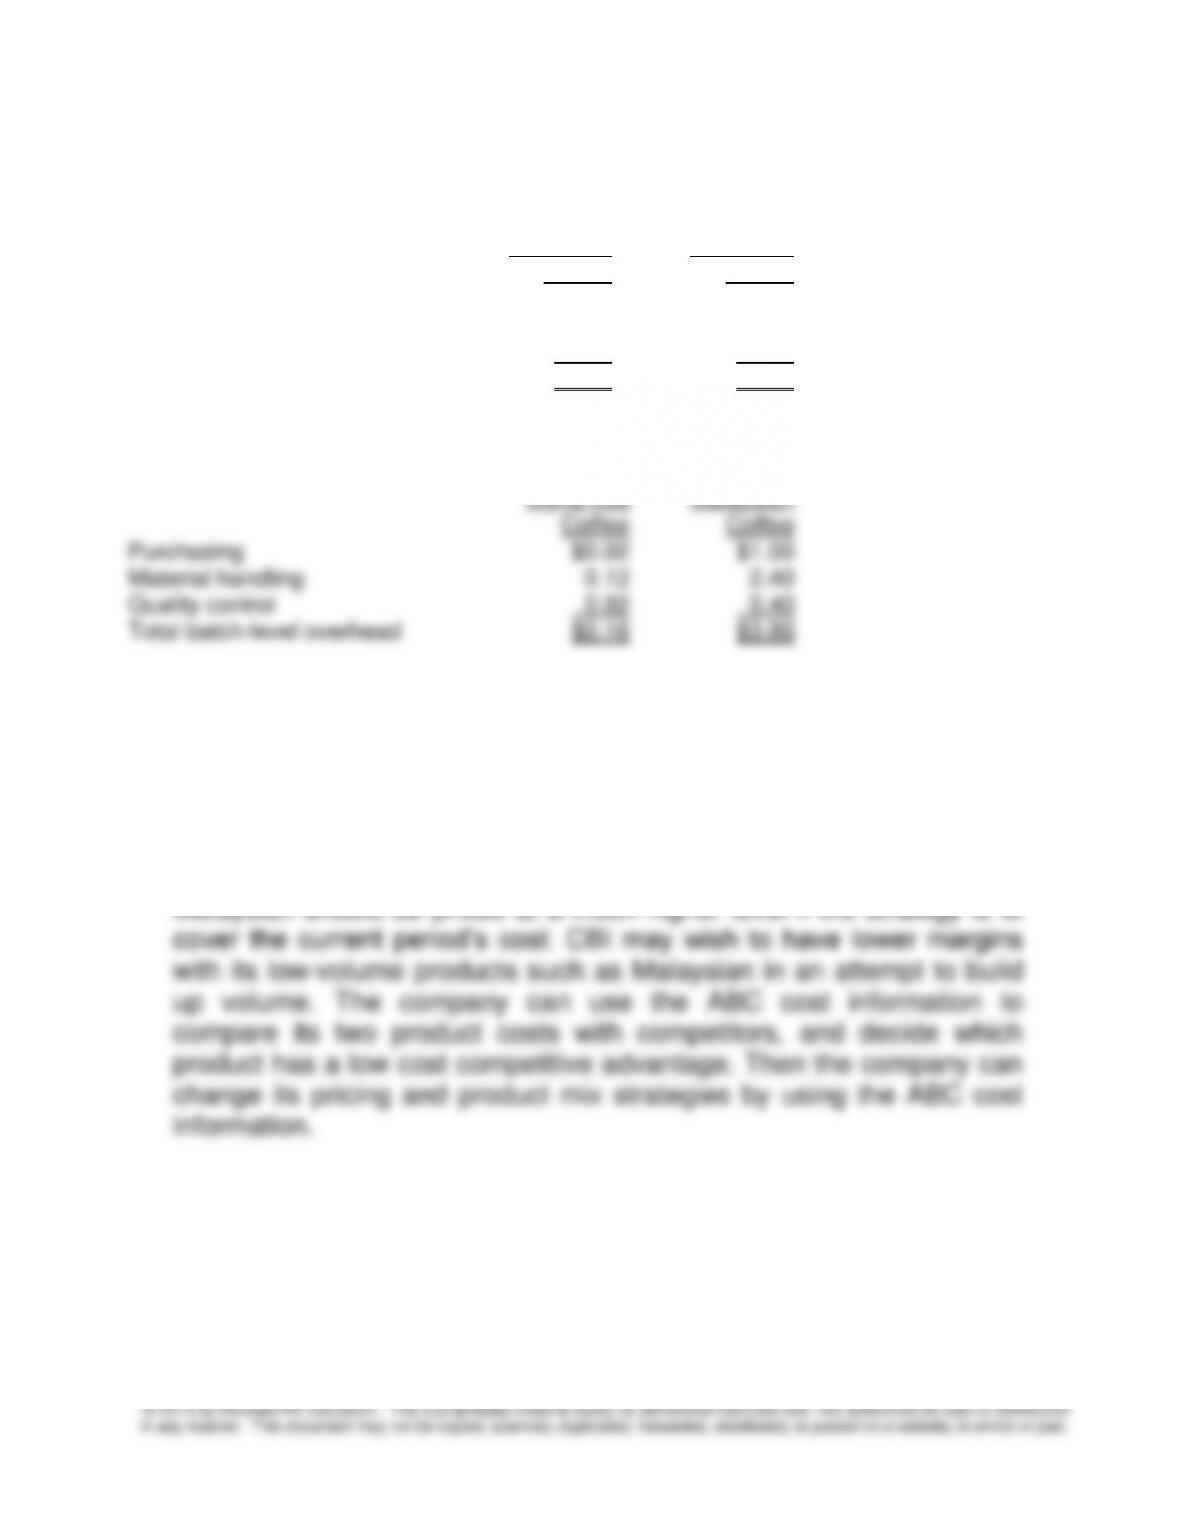
The other three indirect cost items are batch-level driven:
Mona Loa
Coffee
Malaysian
Coffee
Purchasing
$0.02
$1.00
Material handling
0.12
2.40
Quality control
0.02
0.40
Total batch-level overhead
$0.16
$3.80
Malaysian coffee has a greater number of setups per output unit than
does Mona Loa coffee. The result is that the unit cost of the lower–
volume Malaysian coffee is much higher than that of the higher-volume
coffee, even though its cost of direct materials is lower.
With the current costing system, the high-volume Mona Loa is
overcosted, while the low-volume Malaysian is undercosted. Pricing of
Mona Loa can be reduced to make it more competitive. In contrast,
Chapter 5 – Activity-Based Costing and Customer Profitability Analysis
5-36
5-43 (continued-3)
ABC cost data also point out that the reason for the Malaysian
coffee to have a higher unit cost is not because of high-priced
ingredients. In fact, Malaysian coffee has a lower cost of direct
materials than that of Mona Loa coffee. The costs of roasting,
5-44 Cost of Capacity; Continuation of 5-43 (25 min)
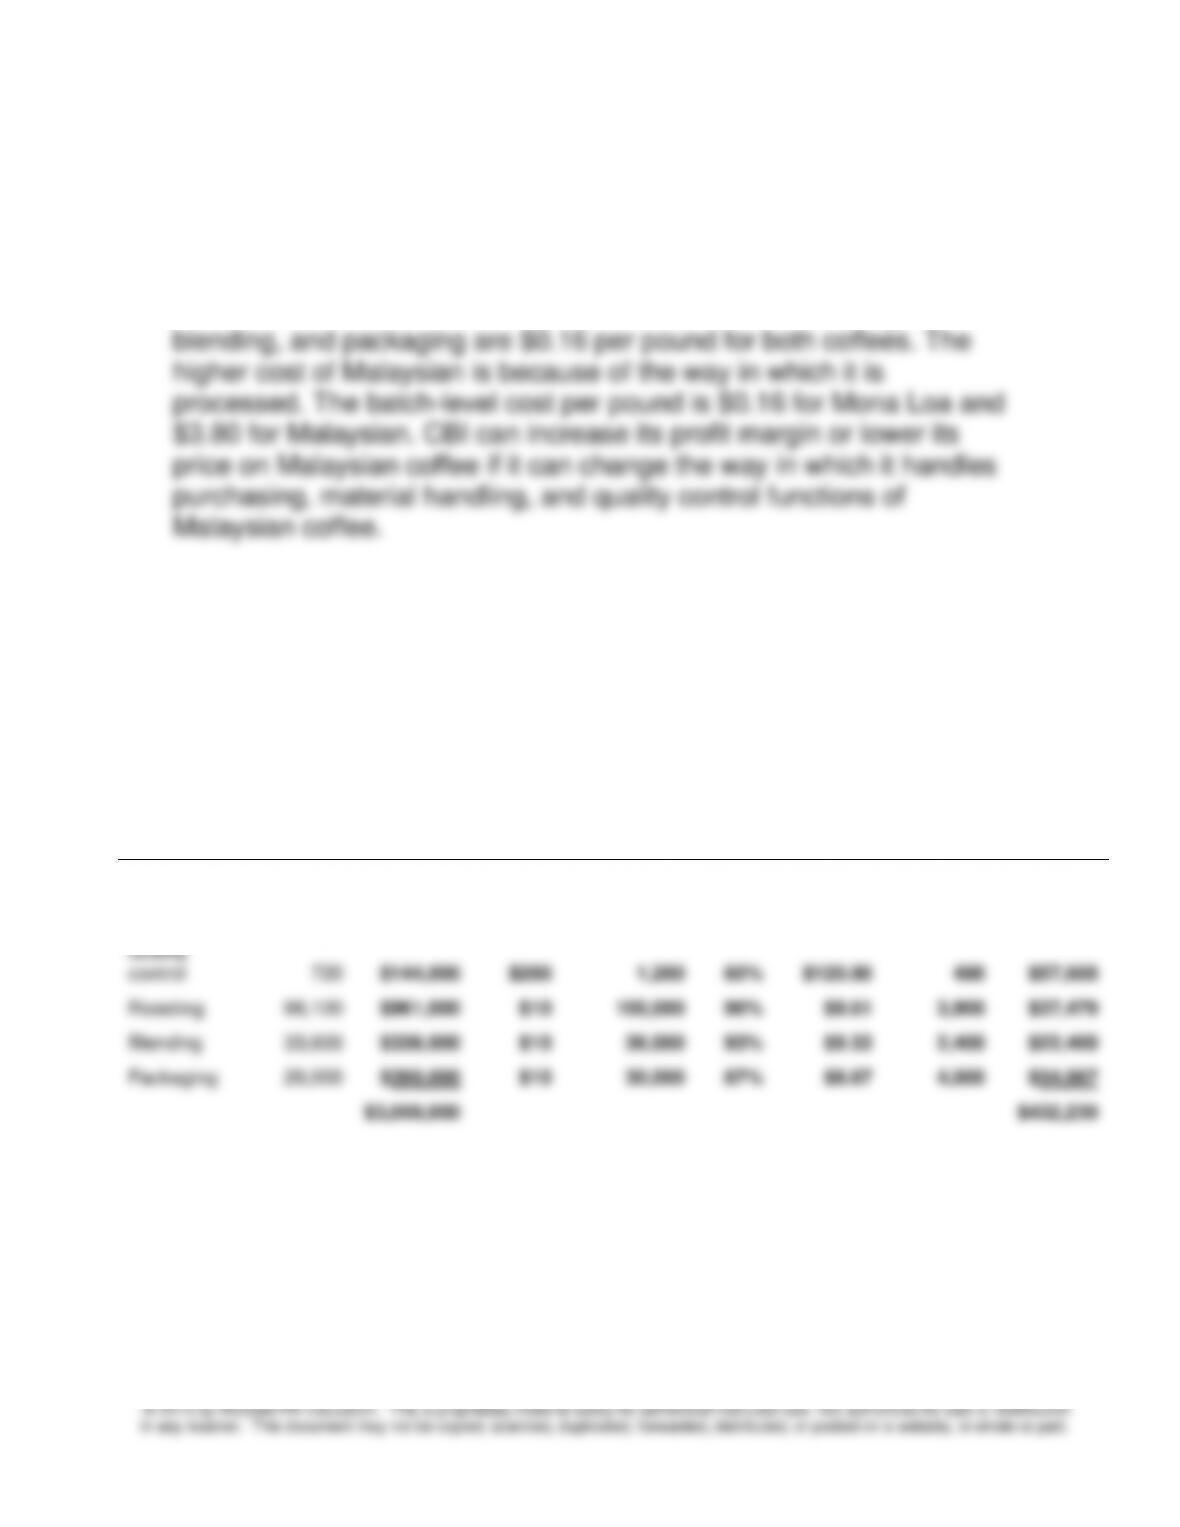
1. The calculation of the new activity rates and the cost of unused capacity is
determined below.
Activity
Budgeted
Activity
Budgeted
Cost
Usage
Based
Rate
Practical
Capacity at
current
spending
Usage
%
Practical
Capacity
Rate
Unused
Capacity
Cost of
Unused
Capacity
Purchasing
1,158
$579,000
$500
1,400
83%
$413.57
242
$100,084
Materials
handling
1,800
$720,000
$400
2,400
75%
$300.00
600
$180,000
Quality
control
720
$144,000
$200
1,200
60%
$120.00
480
$57,600
Roasting
96,100
$961,000
$10
100,000
96%
$9.61
3,900
$37,479
Blending
33,600
$336,000
$10
36,000
93%
$9.33
2,400
$22,400
Packaging
26,000
$260,000
$10
30,000
87%
$8.67
4,000
$34,667
$3,000,000
$432,230
Chapter 5 – Activity-Based Costing and Customer Profitability Analysis
5-37
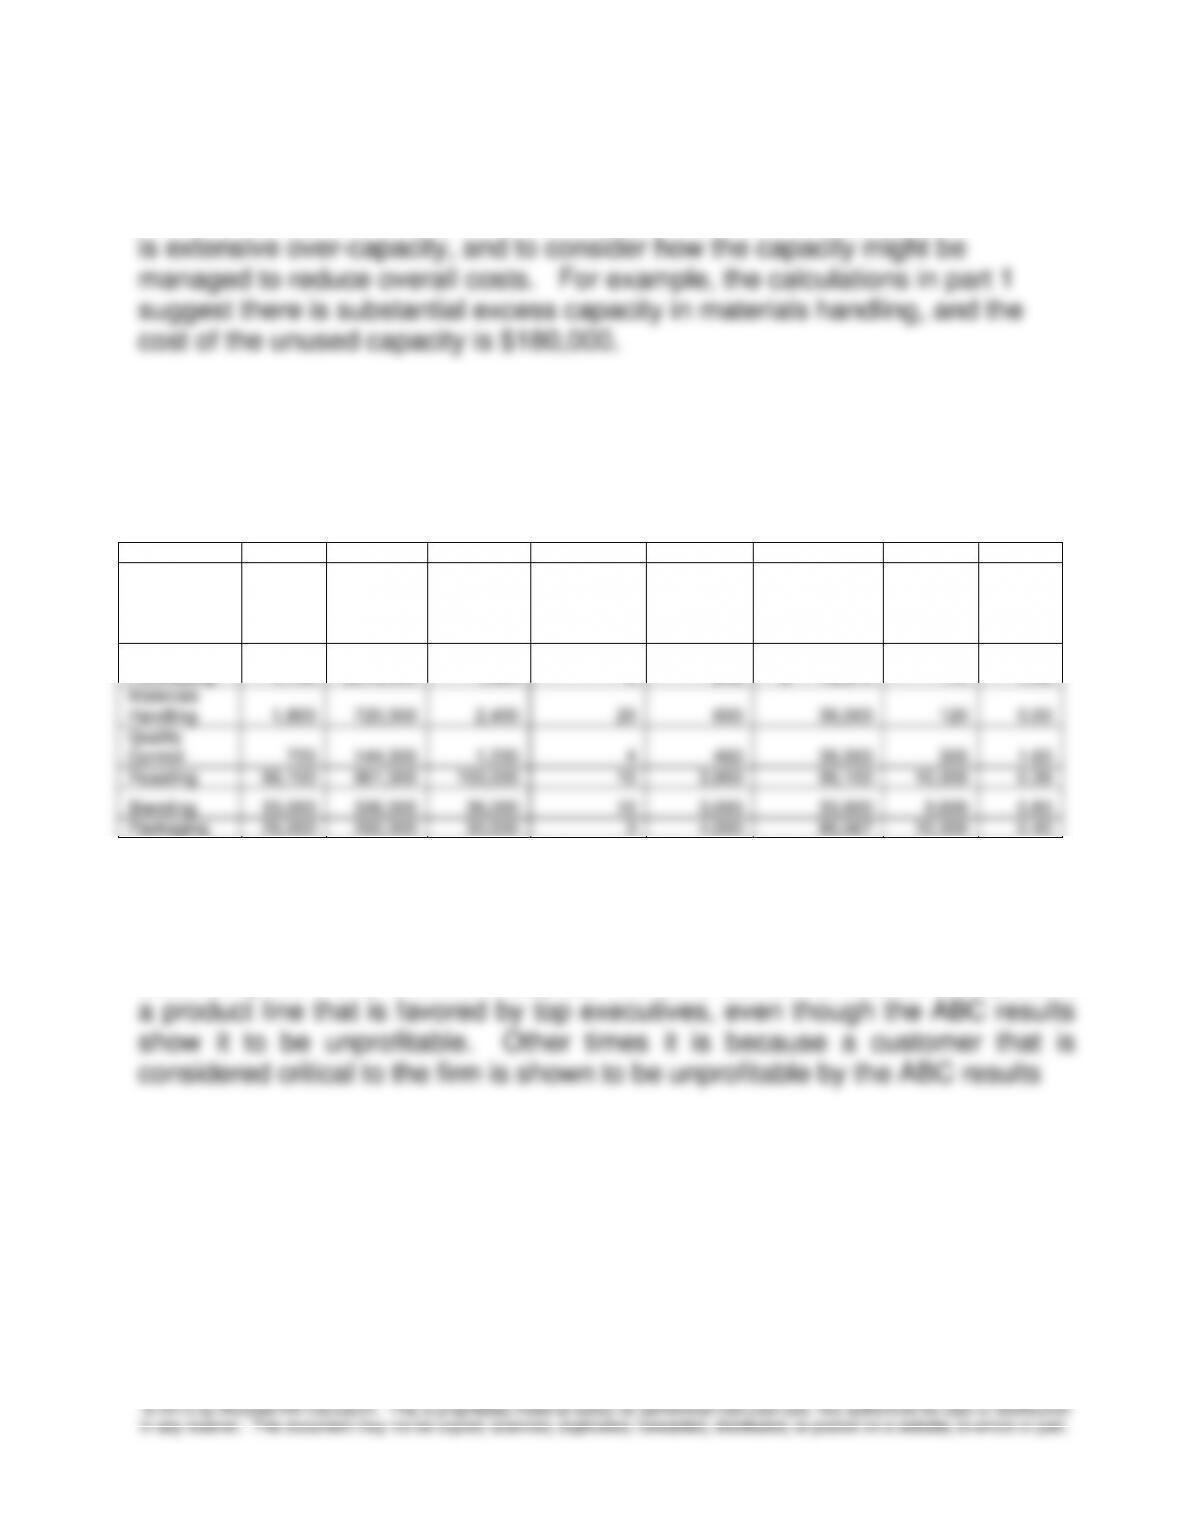
2. The information on cost of capacity can alert management to the total cost
of unused capacity, in this case $432,230 or approximately 14% of total
overhead cost. This information can be used to identify activities where there
3. The analysis below shows the number of employees “unused” in column
4. The analysis assumes that each employee (or machine) contributes an
equal share to the work of the activity. Note that the materials handling
activity appears to have as many as 5 unused employees.
1
2
3
4
5
6
7
8
Driver
Usage
Cost
Capacity
at Current
Spending
Step:
Number of
Employees
or Machines
Unused
Capacity
Cost per Step
=(2)÷(4)
Step Size
=(3)÷(4)
Steps
Not
Used
Purchasing
1,158
$579,000
1,400
8
242
$ 72,375
175
1.38
Materials
Handling
1,800
720,000
2,400
20
600
36,000
120
5.00
Quality
Control
720
144,000
1,200
4
480
36,000
300
1.60
Roasting
96,100
961,000
100,000
10
3,900
96,100
10,000
0.39
Blending
33,000
336,000
36,000
10
3,000
33,600
3,600
0.83
Packaging
26,000
260,000
30,000
3
4,000
86,667
10,000
0.40
5-45 Ethics, Cost System Selection (5 min)
Unfortunately, there are a number of reasons why ABC costing systems are
studied by firms and then not adopted. In some cases the reason is to protect

Chapter 5 – Activity-Based Costing and Customer Profitability Analysis
5-38
In the case of Aero Dynamics, the reason has to do with an ethical issue, that
is, the use of cost allocation to improperly charge a cost-plus customer (the
federal government) for overhead costs. The management accountant should
keep the professional ethics code in mind. First, he or she should try to
persuade other ABC pilot project members and the company controller to
strongly recommend that top management adopt the more accurate ABC
method. If the company top management still would not listen, then the
management accountant should report the situation to the company’s audit
committee. Because of the management accountant’s responsibility for
confidentiality, he or she should not report the matter outside the firm. (See
the Institute of Management Accountant’s Code of Ethics in Exhibit 1-10).
An interesting footnote to the case is that the Government Accounting Office,
to assist the Dept of Defense, in part due to issues of this nature, developed in
the 1970s a series of cost accounting standards. These standards apply
generally to companies contracting with the federal government, especially the
DOD. See http://www.gao.gov/casb1.htm for the CASB website. Also, the
Federal Government in 1990 created the Federal Accounting Standards
Advisory Board (www.fasab.gov) which sets standards for financial and
managerial reporting within the federal government. The FASAB web site is
an interesting place to see the progress/continuing issues of accounting at the
federal government.
Chapter 5 – Activity-Based Costing and Customer Profitability Analysis
5-39
5-46 Time-Driven Activity-Based Costing (TDABC) in a Call Center
(20min)
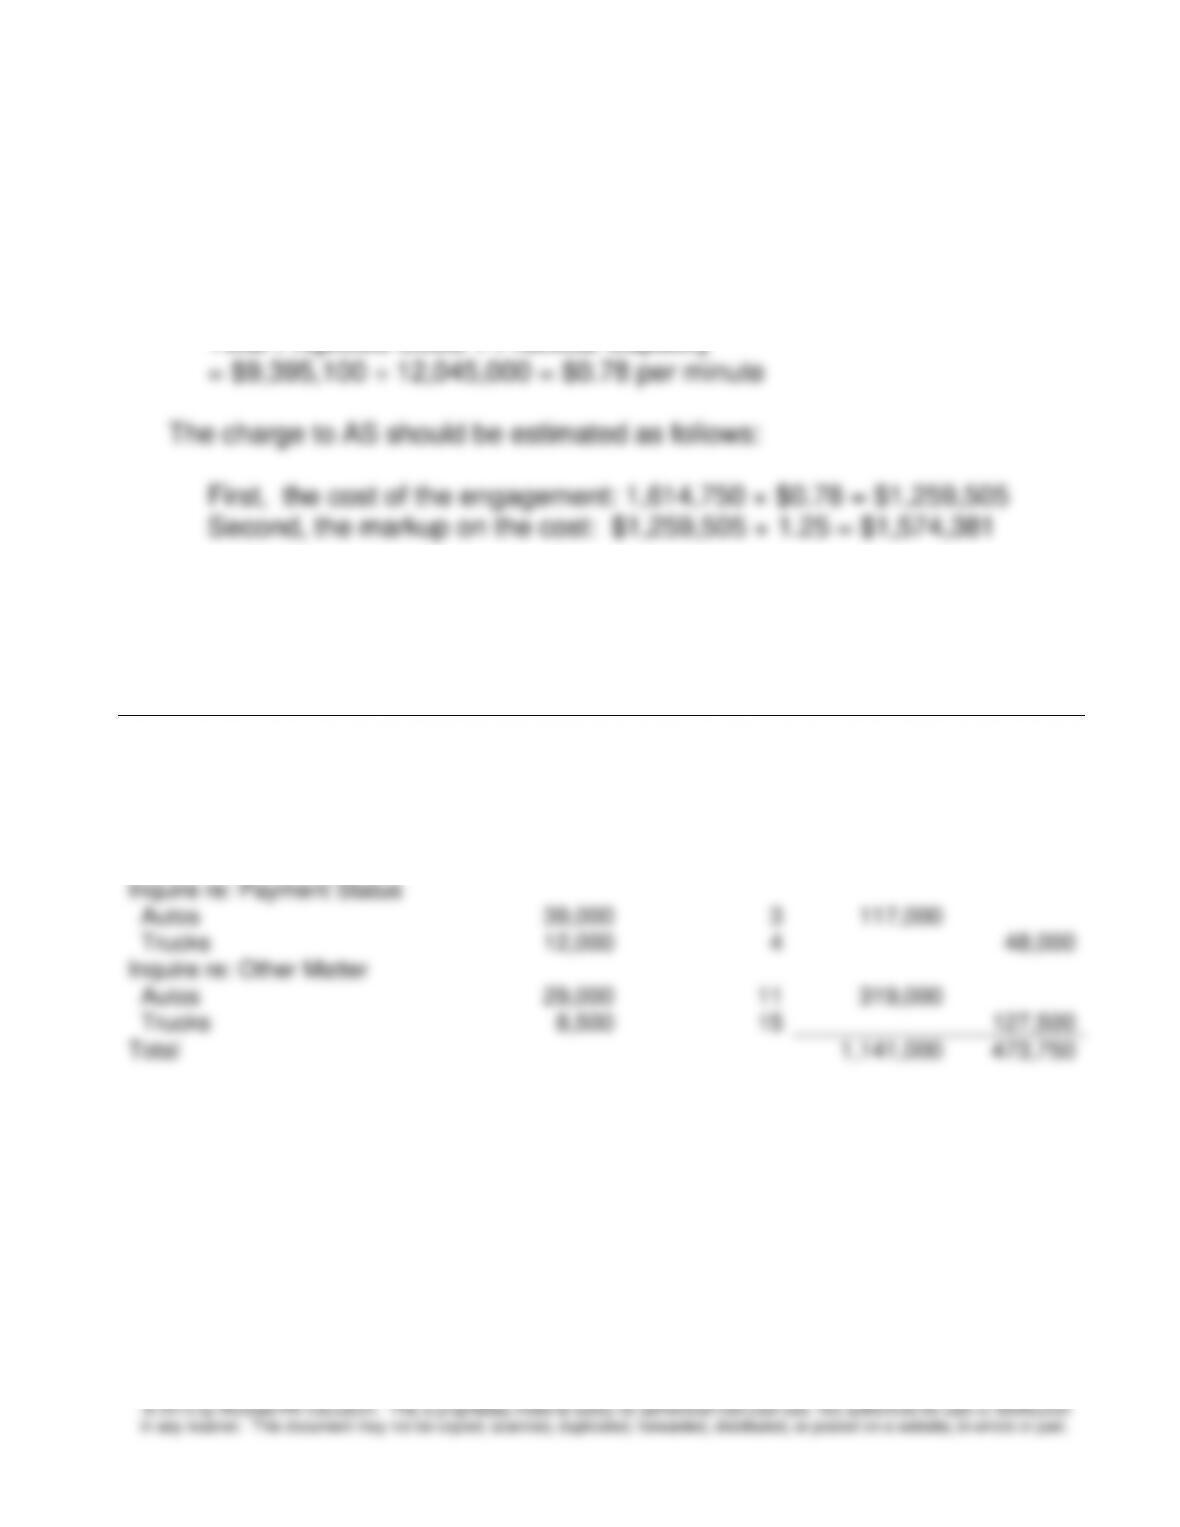
1. The TDABC rate per minute for MSI is determined as follows:
Total Projected Costs ÷ Practical Capacity
2. The total time for each type of loan is determined as follows:
Total Calls
Answered
Avg. No. of
Minutes/C
all
Total Time (minutes)
Inquiries
Autos
Trucks
Inquire re: Rates and Terms
Autos
96,000
5
480,000
Trucks
32,000
7
224,000
Inquire re: Loan App Status
Autos
37,500
6
225,000
Trucks
6,750
11
74,250
Inquire re: Payment Status
Autos
39,000
3
117,000
Trucks
12,000
4
48,000
Inquire re: Other Matter
Autos
29,000
11
319,000
Trucks
8,500
15
127,500
Total
1,141,000
473,750
Chapter 5 – Activity-Based Costing and Customer Profitability Analysis
5-40
5-46 (continued)
The revised proposal would show:
Cost for Autos (1,141,000 x $.78)
$889,980
Cost for Trucks (473,750 x $.78)
$369,525
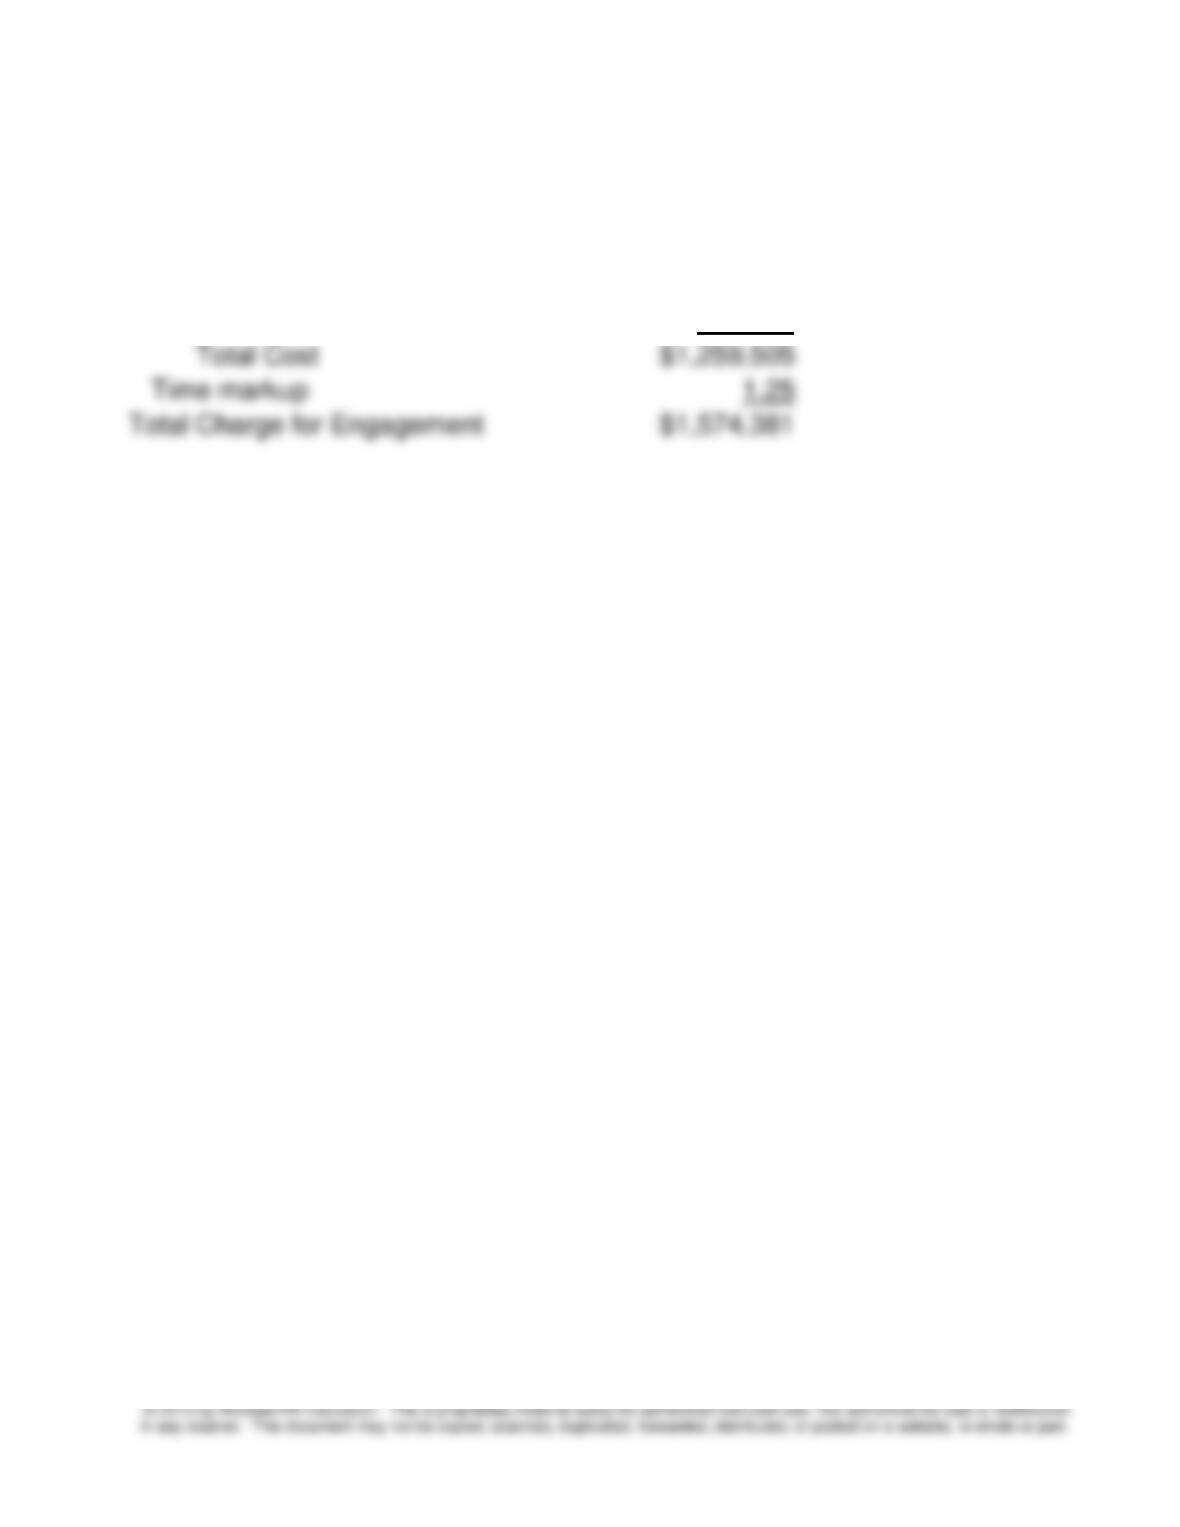
Total Cost
$1,259,505
Time markup
1.25
Total Charge for Engagement
$1,574,381
Note: For further information on TDABC and call centers, see Robert S.
Kaplan and Steven R. Anderson, Time-Driven Activity-Based Costing, Harvard
Business School Press, 2007; and Bilbert Y. Uang and Roger C Wu,
“Strategic Costing & ABC,” Management Accounting, May 1993, pp 33-37.
5-41
© 2013 by McGraw-Hill Education. This is proprietary material solely for authorized instructor use. Not authorized for sale or distribution
in any manner. This document may not be copied, scanned, duplicated, forwarded, distributed, or posted on a website, in whole or part.
5-47 TDABC; Continuation of Problem 5-46 (20 min)
1. The amount of unused capacity is determined as follows.
Total Calls
Answered
Avg. No. of
Minutes/Call
Total
Platinum Regional Bank
234,000
6.0
1,404,000
Healthwise Software Inc.
66,788
5.0
333,940
Johnson Manufacturing
122,665
4.0
490,660
Lesco Online Shopping
233,756
6.0
1,402,536
Babcock Insurance Service
55,455
5.5
305,003
Garcia Electric Supply and Service
38,956
3.4
132,450
Gilbert’s Online Garden Supplies
145,902
4.0
583,608
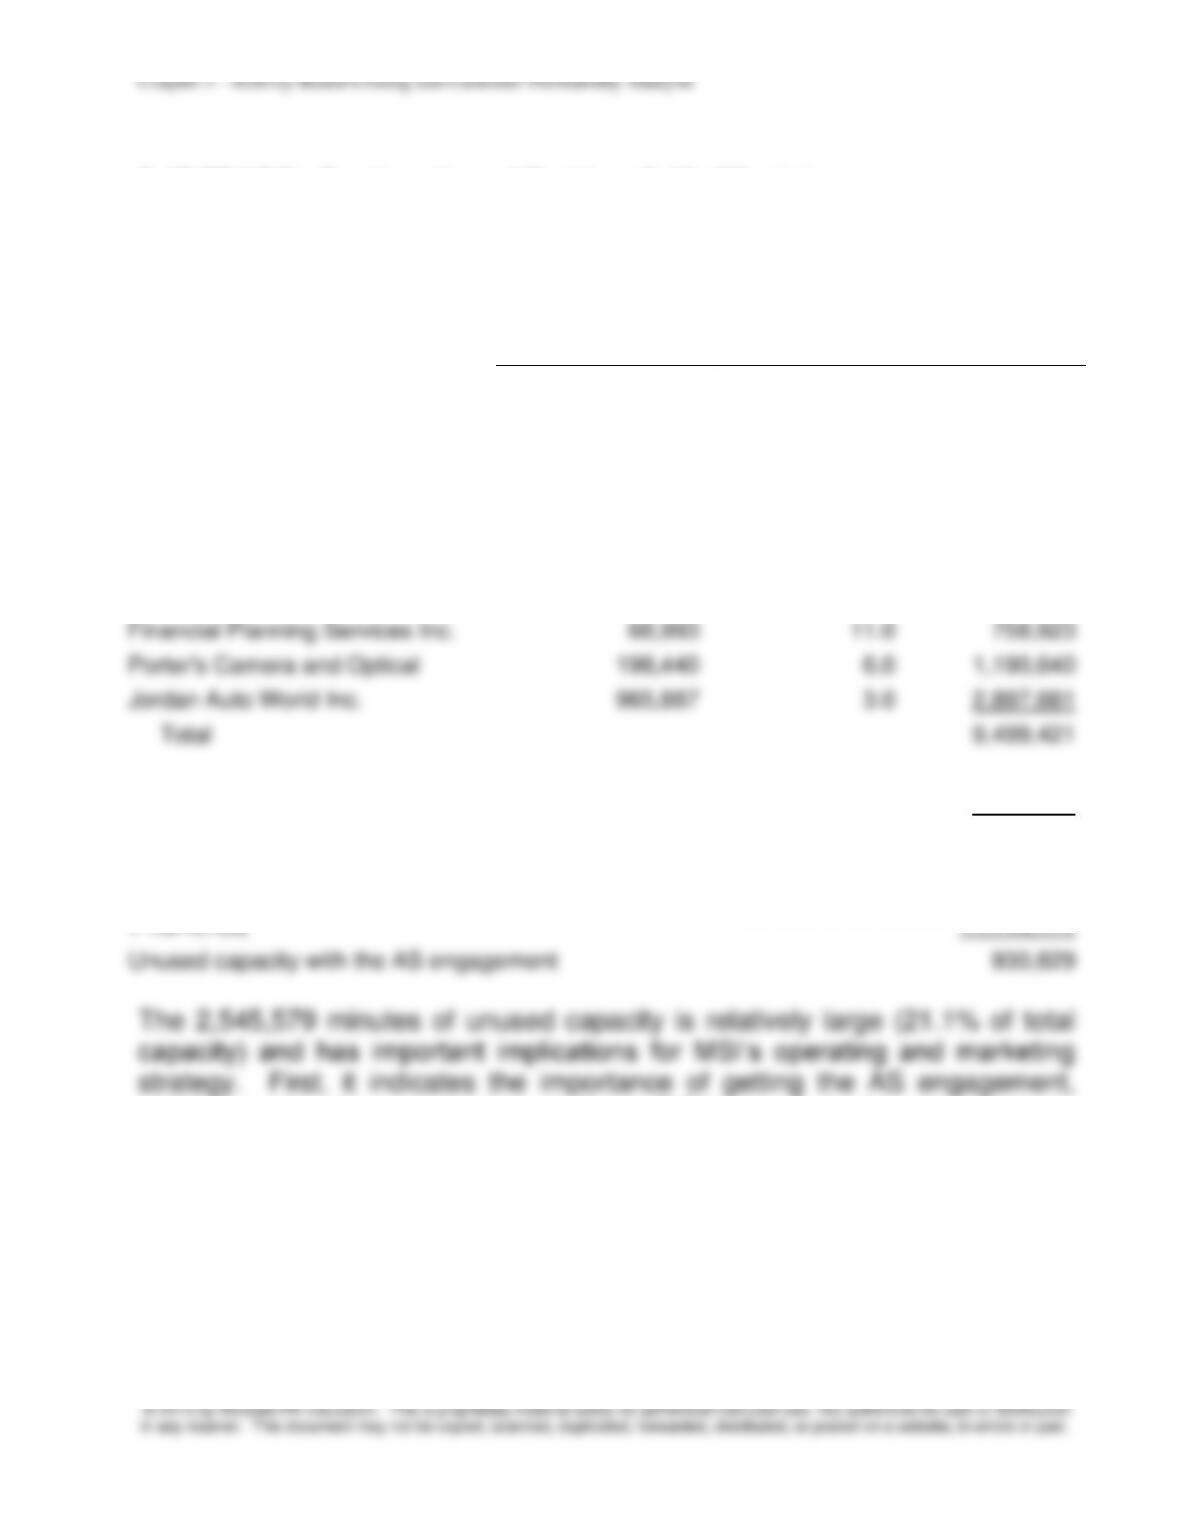
Financial Planning Services Inc.
68,993
11.0
758,923
Porter’s Camera and Optical
198,440
6.0
1,190,640
Jordan Auto World Inc.
965,887
3.0
2,897,661
Total
9,499,421
Unused Capacity
2,545,579
Call Center Practical Capacity
12,045,000
Total minutes used with the AS engagement (9,499,421
+ 1,614,750)
11,114,171
Unused capacity with the AS engagement
930,829
which would reduce unused capacity to 7.7%, a substantial improvement.
Also, it points to the need to examine staffing levels to bring down the cost of
unused capacity. Alternatively, MSI can use the unused time to provide staff
training in order to improve their performance and to make MSI’s services
more attractive to other potential clients.