Chapter 5 – Activity-Based Costing and Customer Profitability Analysis
5-16
5-35 Customer Profitability Analysis (25 minutes)
1.
Jerry Inc.
Kate Co.
Customer Unit Level Costs:
Sales return(40×$5;175×$5)
$200
$875
Customer Batch Level Costs:
Order processing (5×$300; 30×$300)
$1,500
$9,000
Sales return (2×$100; 5×$100)
$200
$500
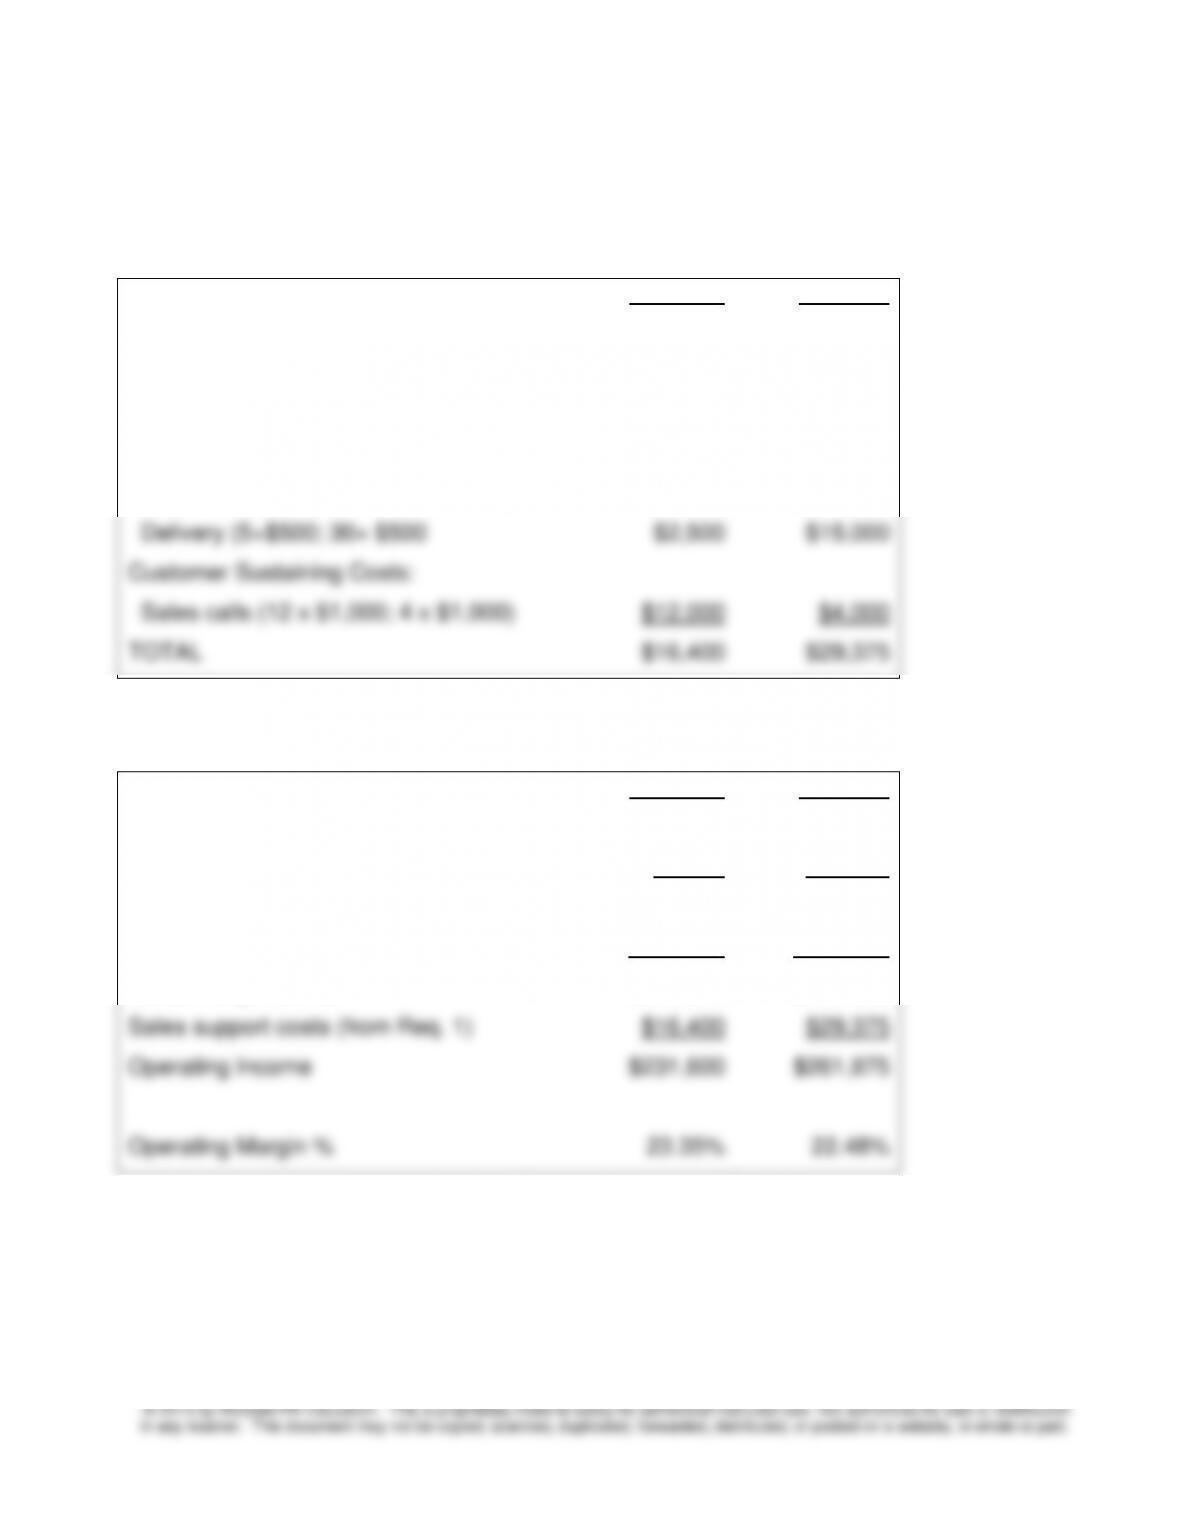
Delivery (5×$500; 30× $500
$2,500
$15,000
Customer Sustaining Costs:
Sales calls (12 x $1,000; 4 x $1,000)
$12,000
$4,000
TOTAL
$16,400
$29,375
2.
Jerry Inc.
Kate Co.
Sales
$1,000,000
$1,200,000
Sales Return (40×$200; 175×$200)
$8,000
$35,000
Net Sales
$992,000
$1,165,000
Cost of goods sold
$744,000
$873,750
Gross margin (25%)
$248,000
$291,250
Sales support costs (from Req. 1)
$16,400
$29,375
Operating Income
$231,600
$261,875
Operating Margin %
23.35%
22.48%
Chapter 5 – Activity-Based Costing and Customer Profitability Analysis
5-17
5-36 Customer Profitability Analysis (25 min)
1. Determination of the $100.50 order-filling cost per unit
Total number of orders:(2 × 100 PCs) + (10 × 4,000 SCs) = 40,200
Total number of orders
40,200
Number of orders per block
60
Total number of blocks
670
Cost per block
× $60,000
Total cost of order blocks
$ 40,200,000
Total number of orders
40,200
Per order order-filling cost
× $1,500
Total cost per order
+ 60,300,000
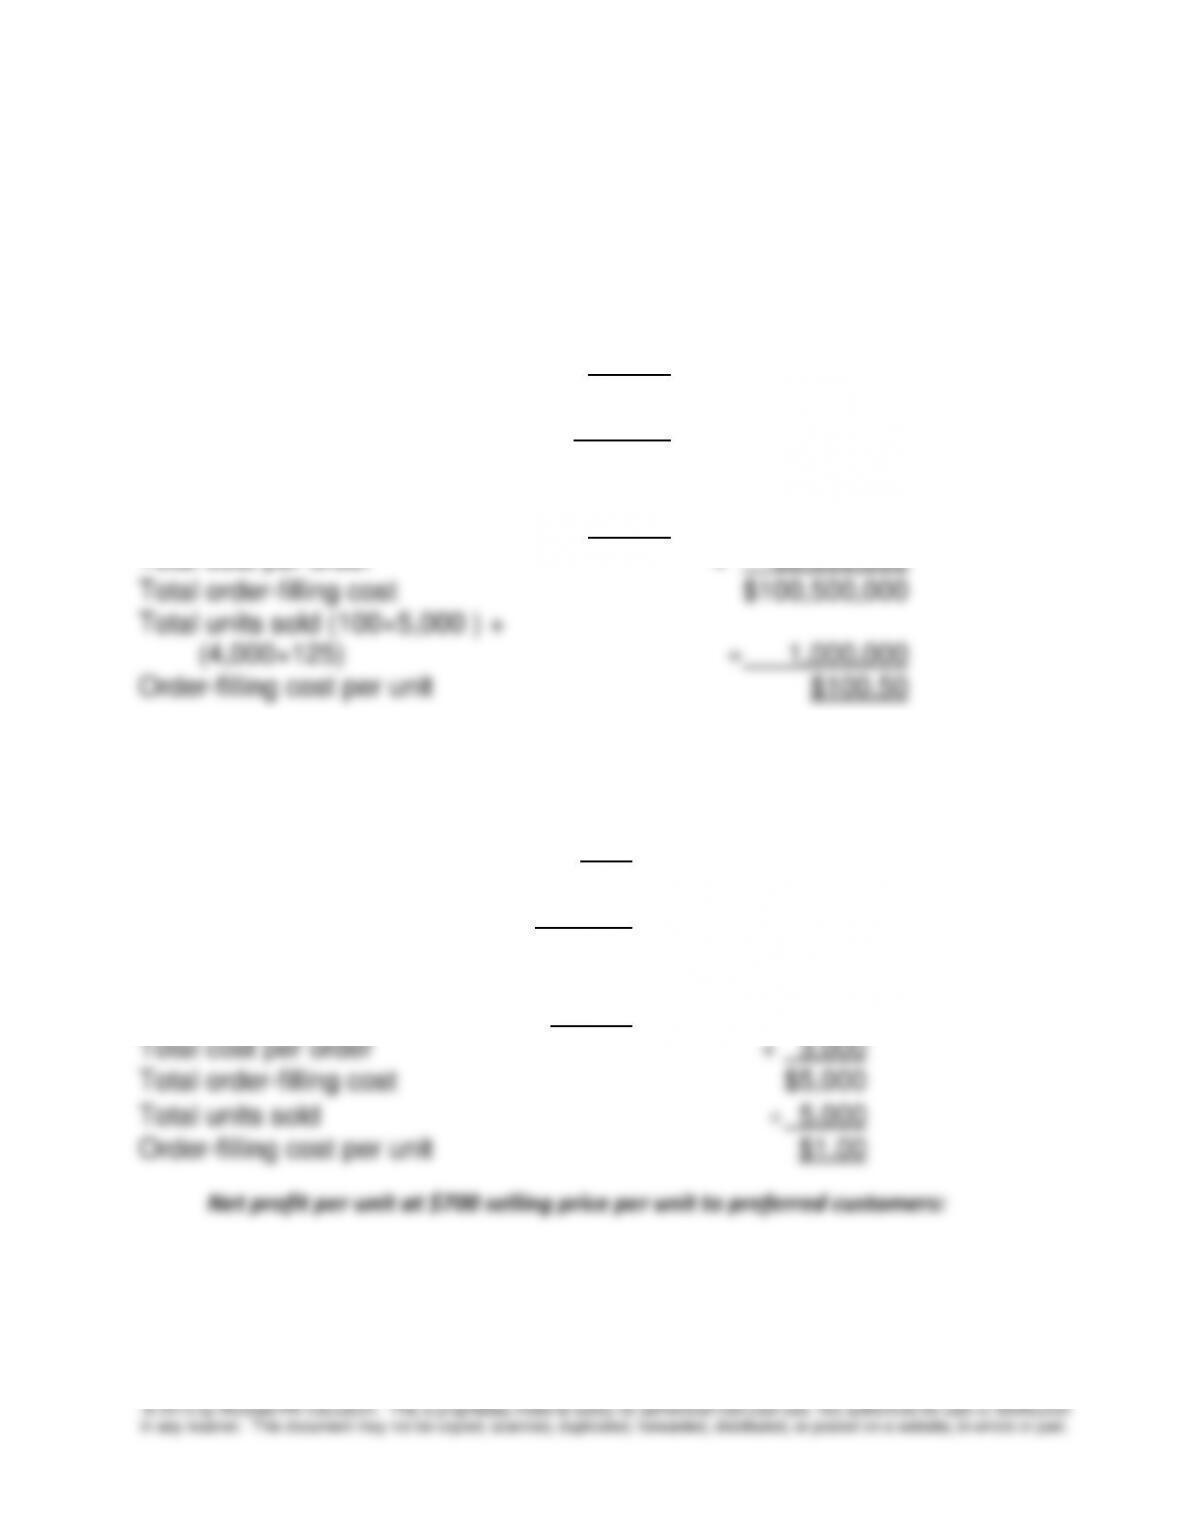
Total order-filling cost
$100,500,000
Total units sold (100×5,000 ) +
(4,000×125)
1,000,000
Order-filling cost per unit
$100.50
2. Order filling cost per unit sold to PC:
Total number of orders
2
Number of orders per block
60
Total number of blocks
1/30
Cost per block
× $60,000
Total block cost
$2,000
Total number of orders
2
Order-filling cost per order
× $1,500
Total cost per order
+ 3,000
Total order-filling cost
$5,000
Total units sold
5,000
Order-filling cost per unit
$1.00
Net profit per unit at $700 selling price per unit to preferred customers:
Chapter 5 – Activity-Based Costing and Customer Profitability Analysis
5-18
5-36 (continued)
3. Order filling cost per order by SC:
Cost per block
$60,000
Number of orders per block
÷ 60
Block cost per order
$1,000
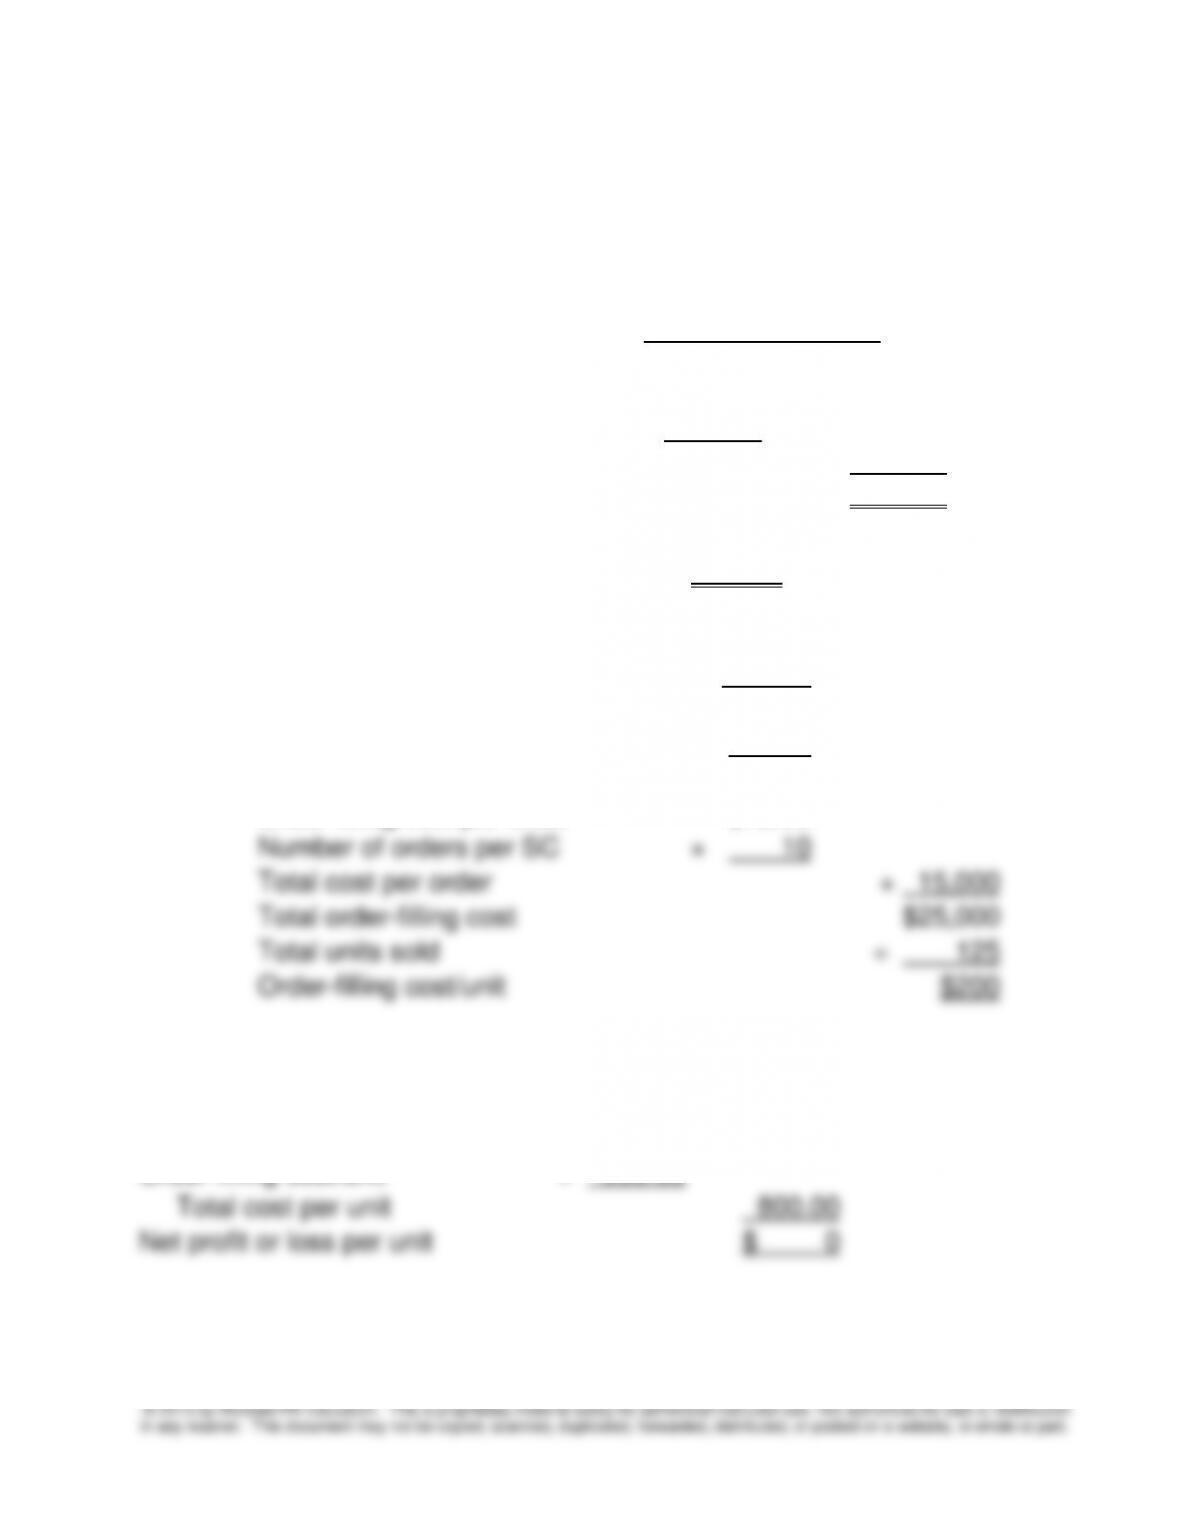
Number of orders per SC
× 10
Total block cost per SC
$10,000
Order-filling cost per order
$1,500
Number of orders per SC
× 10
Total cost per order
+ 15,000
Total order-filling cost
$25,000
Total units sold
÷ 125
Order-filling cost/unit
$200
Profitability per unit at $800 selling price per unit to SC
Selling price per unit
$800.00
Manufacturing cost
$600.00
Order-filling cost/unit
+ 200.00
Total cost per unit
800.00
Net profit or loss per unit
$ 0
Preferred Customer
Selling price per unit
$700.00
Manufacturing cost
$600.00
Order-filling cost/unit
+ 1.00
Total cost per unit
601.00
Net Profit per unit
$ 99.00
Profit margin per unit
14.14%
5-19
© 2013 by McGraw-Hill Education. This is proprietary material solely for authorized instructor use. Not authorized for sale or distribution
in any manner. This document may not be copied, scanned, duplicated, forwarded, distributed, or posted on a website, in whole or part.
5-37 Tools for Successful ABC/M Implementation (10 min)
Other guides or tip for successful implementation are noted in the text, but
some are listed below:
• Choose a type of context where ABC is likely to succeed, such as a
Additional Sources: Dan Swenson and Douglas Barney, “ABC/M: Which
Companies Have Success?” The Journal of Corporate Accounting & Finance,
March/April 2001, pp 35-44. See also, Douglas T. Hicks, “Good Decisions
Require Good Models: Developing Activity-Based Solutions that Work for
Decision Makers,” Cost Management, March/April 2005, pp 32-40, and
Michael D. Shields and Michael A. McEwen, “Implementing Activity-Based
Costing Systems Successfully,” Cost Management, Winter, 1996, pp15-22.
Chapter 5 – Activity-Based Costing and Customer Profitability Analysis
5-20
PROBLEMS
5-38 Activity-Based Costing, Value Chain Analysis (25 min)
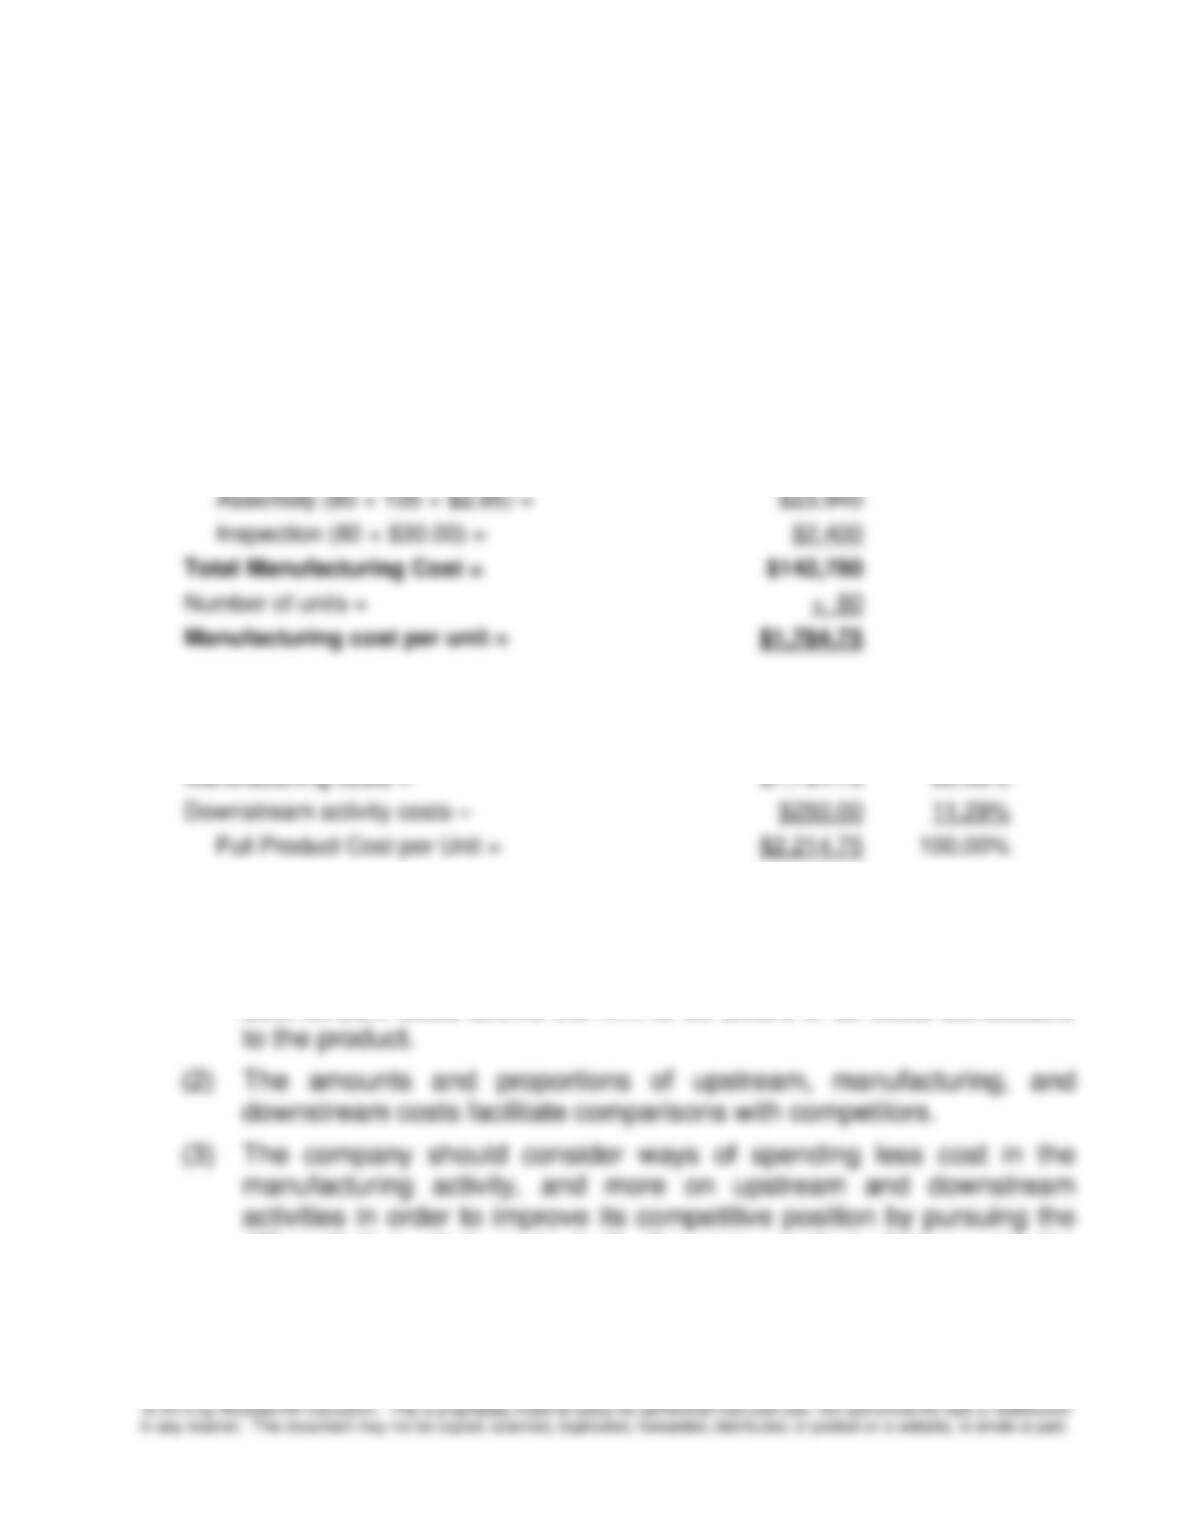
1. Manufacturing cost (total, and per unit):
Prime manufacturing cost (80 ×$1,250) =
$100,000
Manufacturing overhead:
Materials handling (80 × 105 × $0.50) =
$4,200
Machining (80 × 3 × $51.00) =
$12,240
Assembly (80 × 105 × $2.85) =
$23,940
Inspection (80 × $30.00) =
$2,400
Total Manufacturing Cost =
$142,780
Number of units =
÷ 80
Manufacturing cost per unit =
$1,784.75
2. Computation of full cost:
Upstream activity costs =
$180.00
8.13%
Manufacturing costs =
$1,784.75
80.58%
Downstream activity costs =
$250.00
11.29%
Full Product Cost per Unit =
$2,214.75
100.00%
Strategic implications:
(1) Knowing the full cost of a product including upstream and
downstream costs allows the firm to be aware of all costs attributable
differentiation strategy in both the new product design and the
customer service.
Chapter 5 – Activity-Based Costing and Customer Profitability Analysis
5-21
5-38 (continued)
3. The total value chain cost provides the firm a long-term perspective of
the product cost, in addition to the short term manufacturing cost.
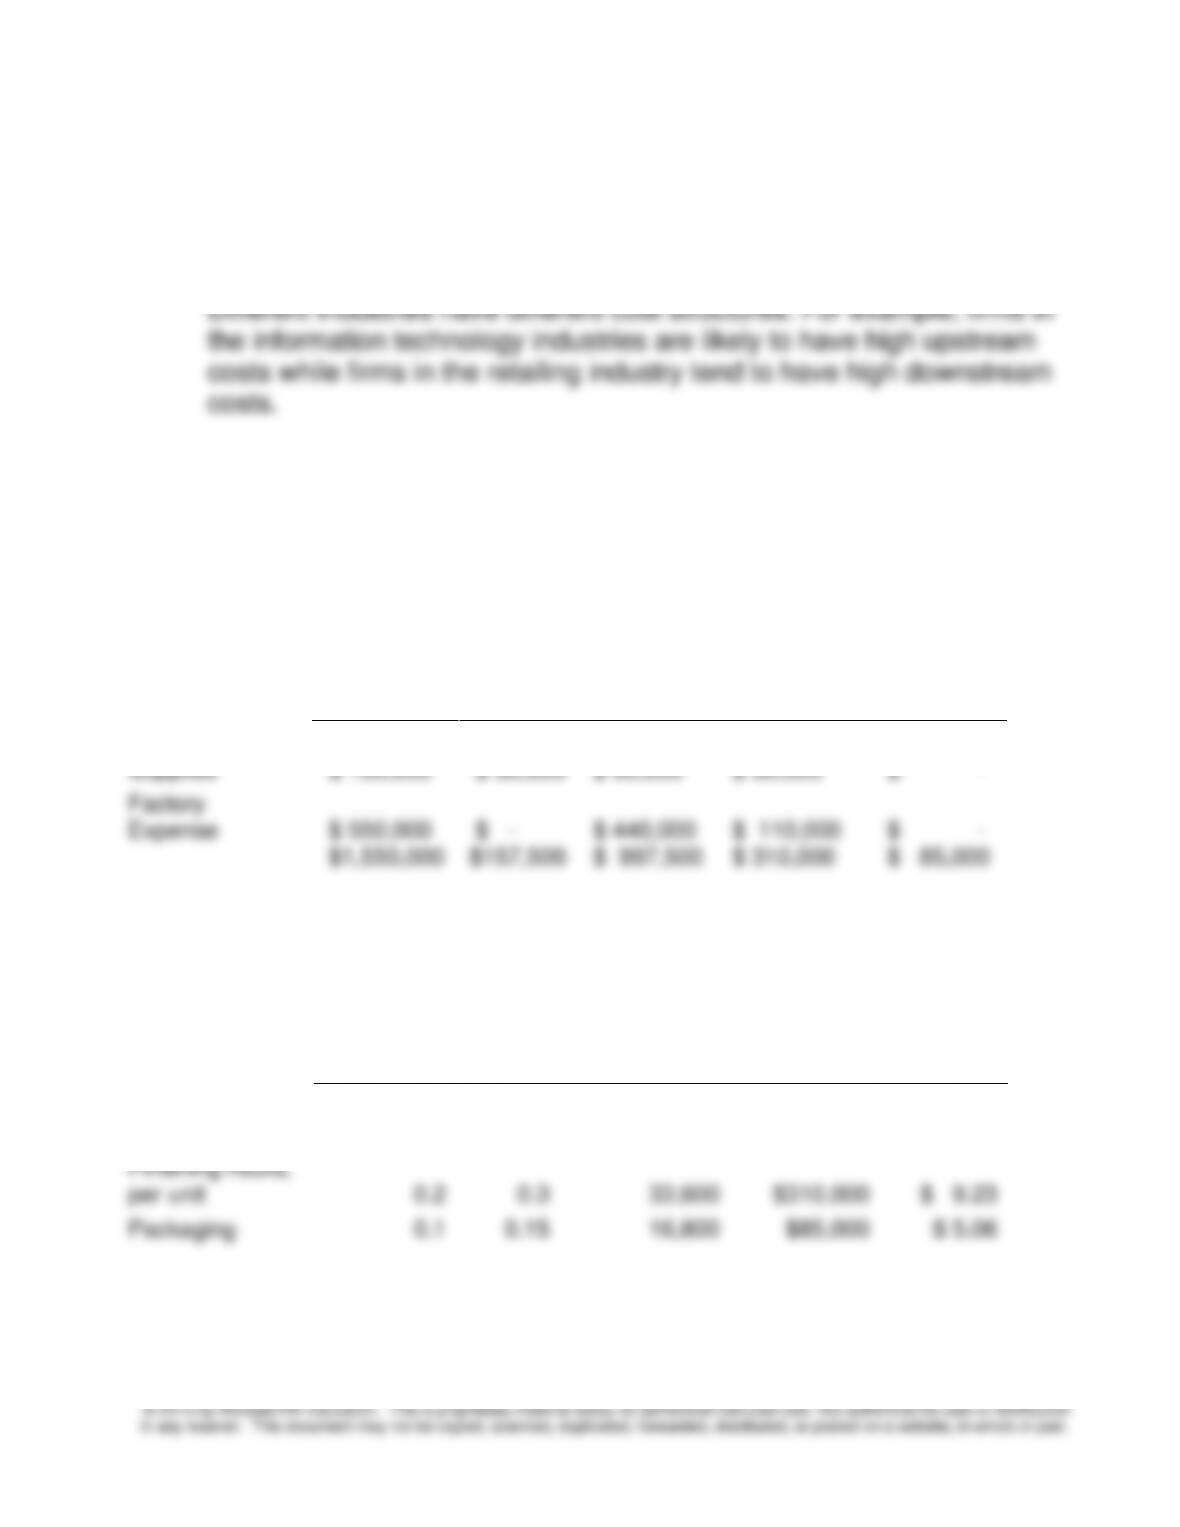
5-39 Resource and Activity-Based Cost Drivers (25 min)
1. The activity based cost pools are determined from the percent-of-use
information; for example, total setup cost = $157,500 = (.15 × $850,000)
+ (.2 × $150,000).
Factory
Costs
Setup
Assembly
Inspect
&Finishing
Packaging
Salaries
$ 850,000
$127,500
$ 467,500
$ 170,000
$ 85,000
Supplies
$ 150,000
$ 30,000
$ 90,000
$ 30,000
$ –
Factory
Expense
$ 550,000
$ –
$ 440,000
$ 110,000
$ –
$1,550,000
$157,500
$ 997,500
$ 310,000
$ 85,000
2. The activity rates are determined as follows:
Safe-V
Safe-T
Total Activity
Consumption
Activity
Costs
Activity-
based
Rates
Batches
250
600
850
$157,500
$185.29
Units
60,000
72,000
132,000
$997,500
$ 7.56
Finishing hours,
per unit
0.2
0.3
33,600
$310,000
$ 9.23
Packaging
0.1
0.15
16,800
$85,000
$ 5.06
Chapter 5 – Activity-Based Costing and Customer Profitability Analysis
5-22
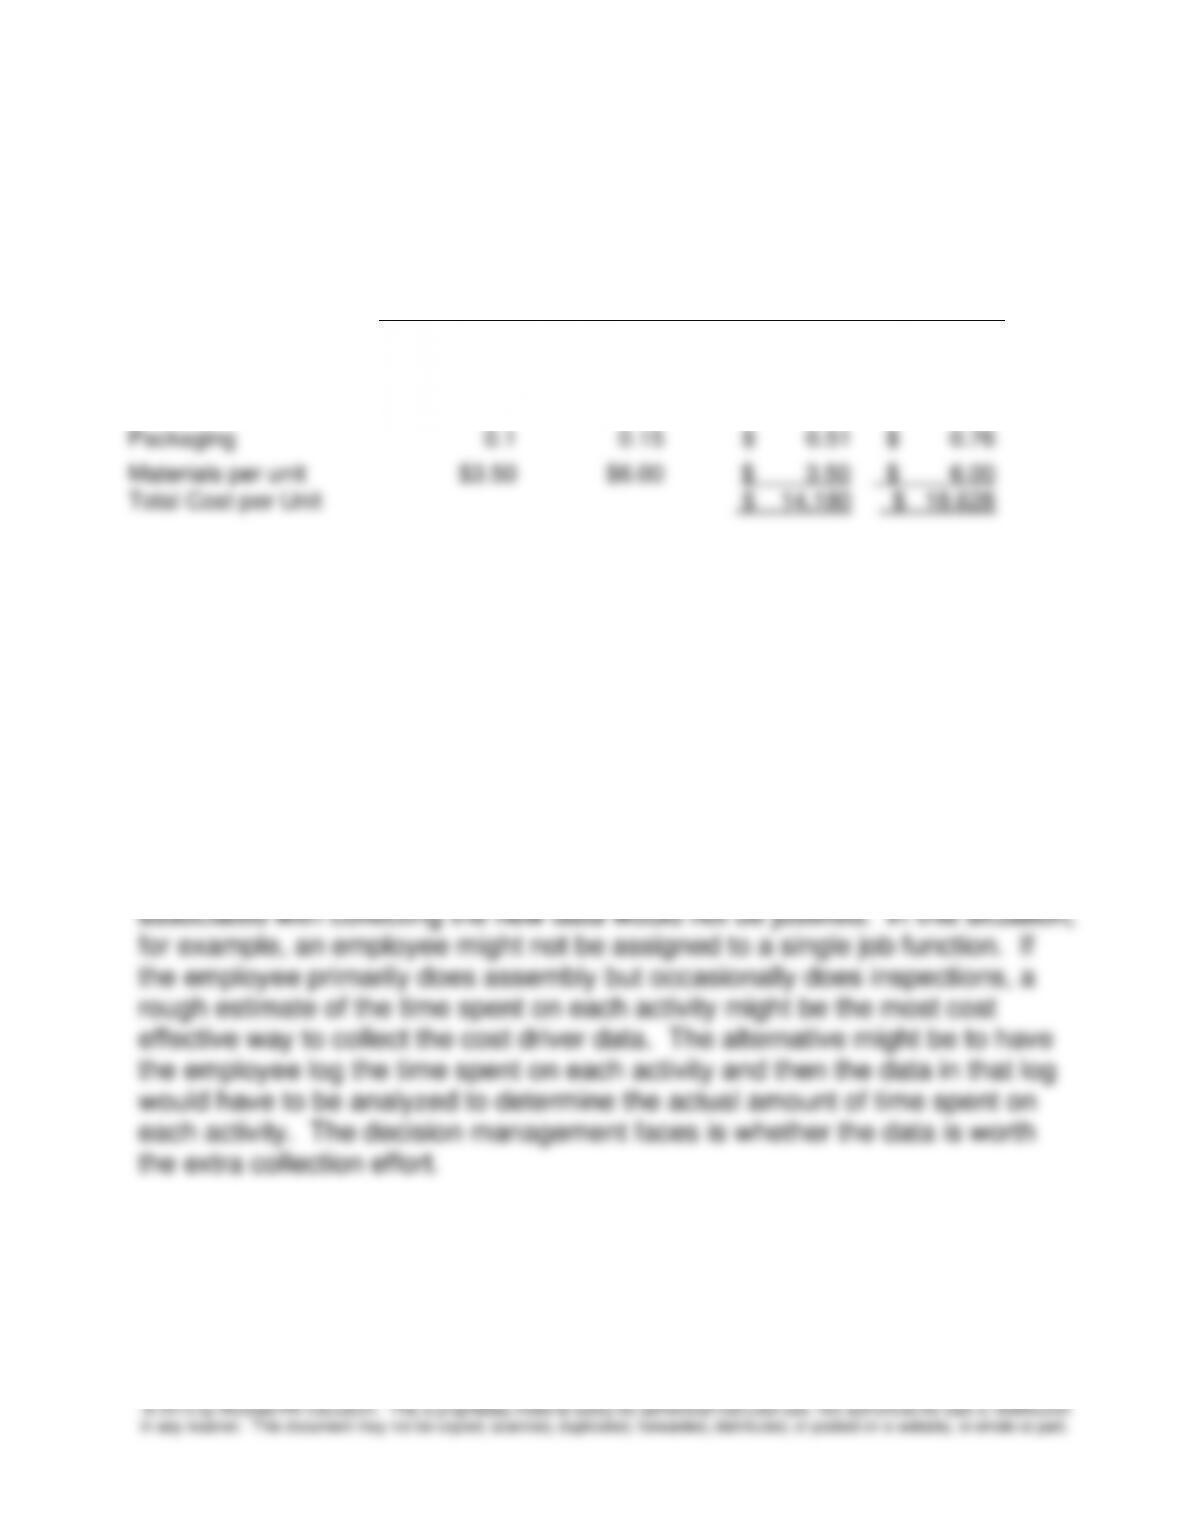
3. The per unit activity-based costs are $14.18 for Safe-V and $18.63 for the
Safe-T
Activity Requirements
Activity-Based
Costs/Unit
Safe-V
Safe-T
Safe-V
Safe-T
Setup
250
600
$ 0.77
$ 1.54
Assembly
60,000
72,000
$ 7.56
$ 7.56
Inspect and Finish
0.2
0.3
$ 1.85
$ 2.77
Packaging
0.1
0.15
$ 0.51
$ 0.76
Materials per unit
$3.50
$6.00
$ 3.50
$ 6.00
Total Cost per Unit
$ 14.180
$ 18.628
5-39 (continued)
4. The activity-based information can be used by EEI to set prices and
assess the profitability of its two product lines.
5. The collection of more accurate cost driver data can only be justified when
the cost of data collection and analysis is less than the expected benefit.
Management would have to decide whether they think their decisions would
change based on the more accurate data. If not, then the extra effort and cost
Chapter 5 – Activity-Based Costing and Customer Profitability Analysis
5-23
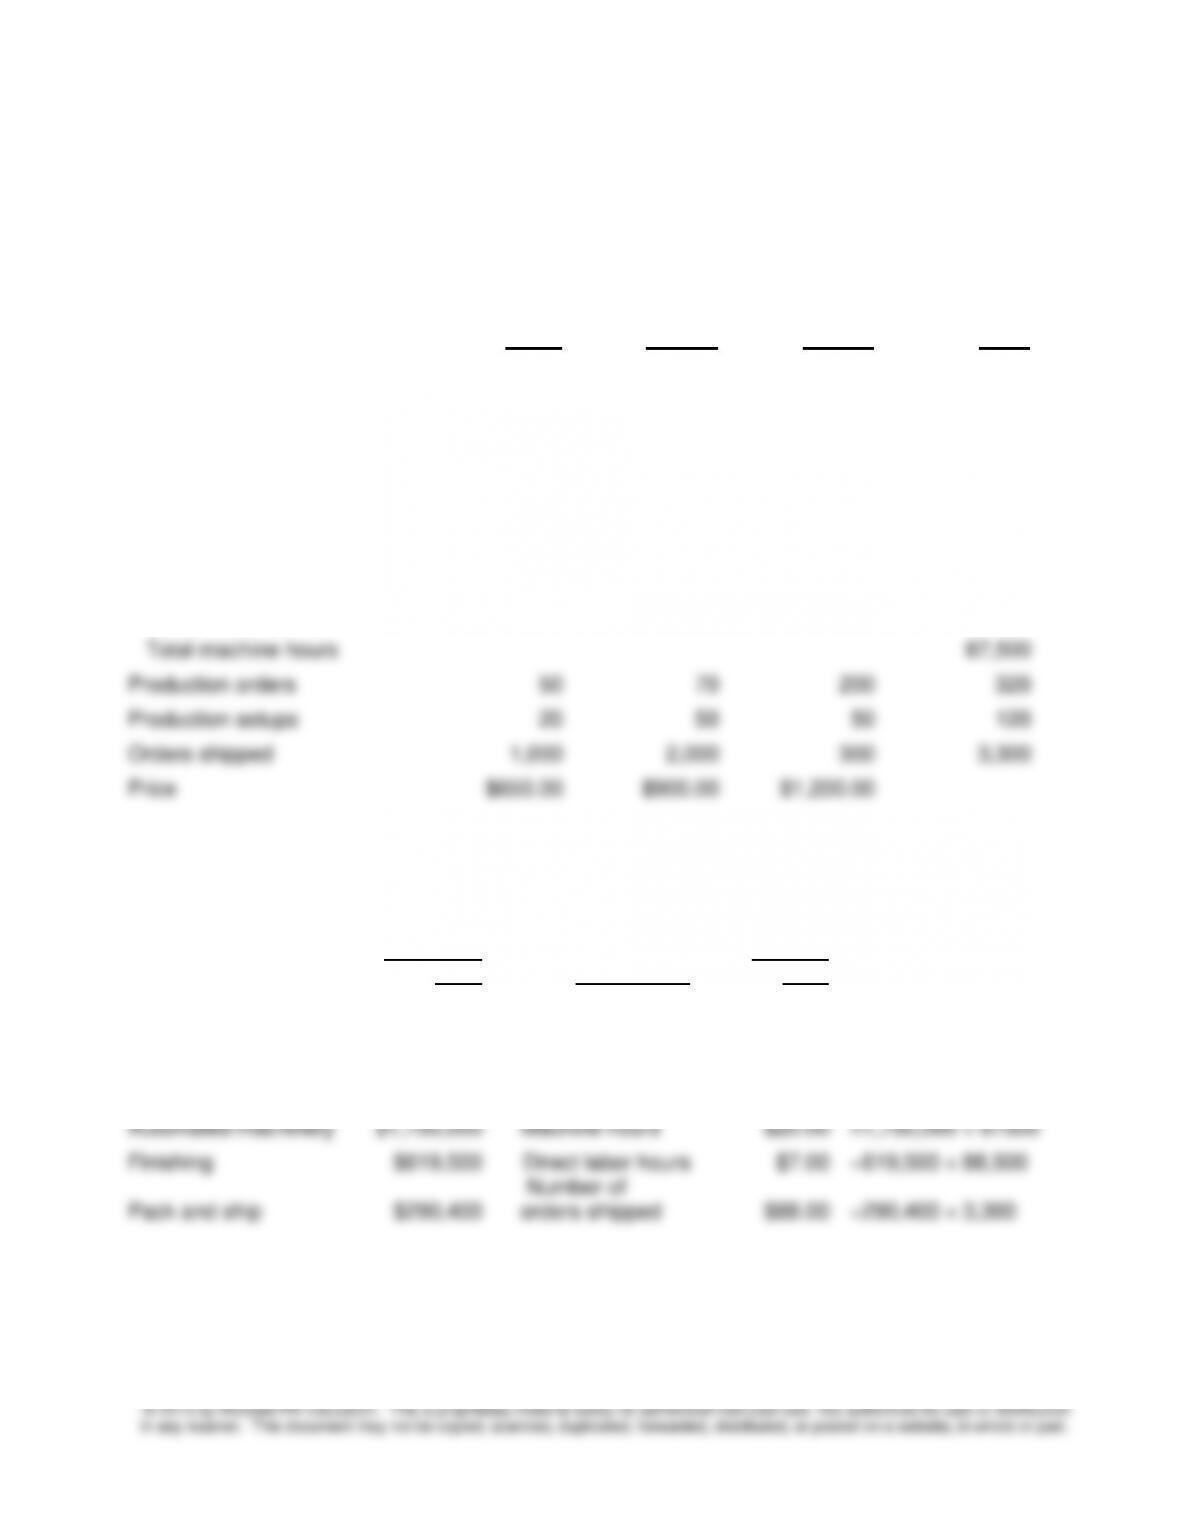
5-40 Activity-Based Costing; Customer Group Cost Analysis (40 min)
1. First, obtain the total levels for activity cost drivers:
Product Lines
Value
Quality
Luxury
Total
Units produced
15,000
5,000
500
20,500
Direct materials cost per unit
$80
$50
$110
Total direct materials cost
$ 1,505,000
Number of parts per unit
30
50
120
Total parts
760,000
Direct labor hours per unit
4
5
7
Total labor hours
88,500
Machine hours per unit
3
7
15
Total machine hours
87,500
Production orders
50
70
200
320
Production setups
20
50
50
120
Orders shipped
1,000
2,000
300
3,300
Price
$650.00
$900.00
$1,200.00
Then, obtain the activity rates:
Budgeted
Cost
Cost Driver
Activity
Rate
Materials handling
$349,600
Number of parts
$0.46
=$349,600 ÷ 760,000
Product scheduling
$160,000
Number of
production orders
$500.00
=160,000 ÷ 320
Setup labor
$216,000
Number of setups
$1,800.00
=216,000 ÷ 120
Automated machinery
$1,750,000
Machine hours
$20.00
=1,750,000 ÷ 87500
Finishing
$619,500
Direct labor hours
$7.00
=619,500 ÷ 88,500
Pack and ship
$290,400
Number of
orders shipped
$88.00
=290,400 ÷ 3,300
Chapter 5 – Activity-Based Costing and Customer Profitability Analysis
5-24
5-40 (continued –1)
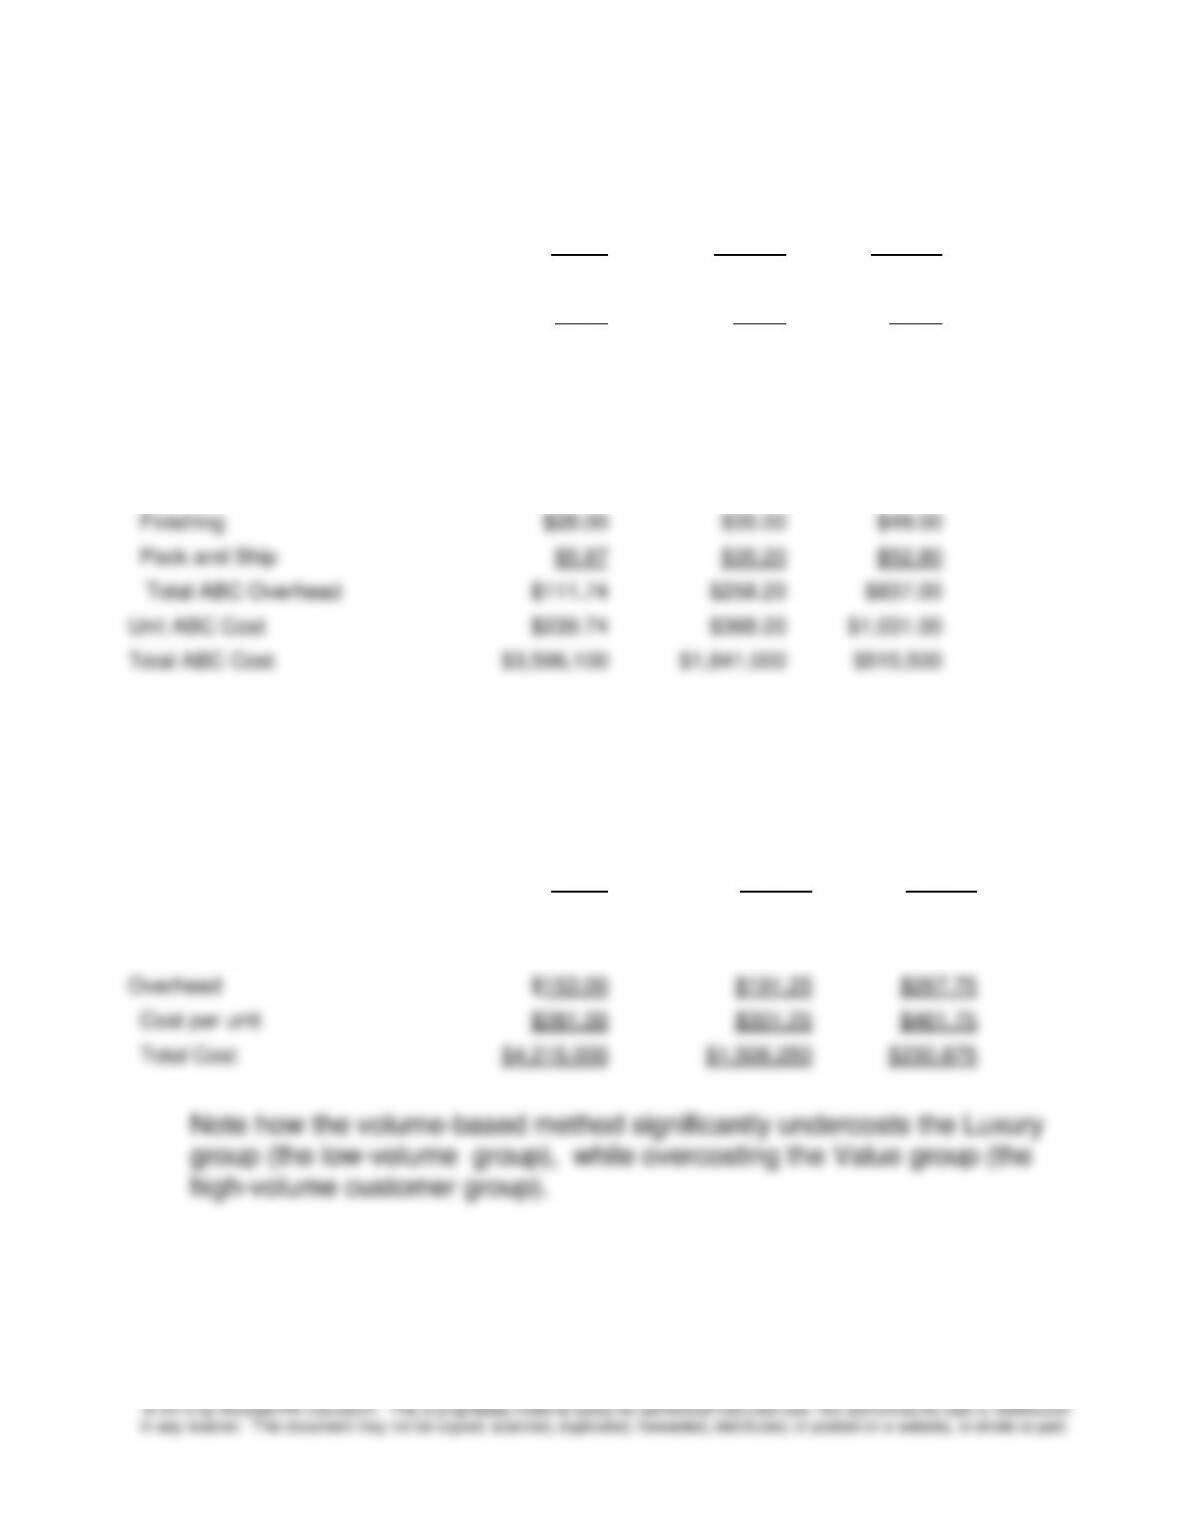
The activity-based cost per unit and total cost is as follows:
Value
Quality
Luxury
Direct Materials
$80.00
$50.00
$110.00
Direct Labor
$48.00
$60.00
$84.00
Overhead:
Materials handling
$13.80
$23.00
$55.20
Product Scheduling
$1.67
$7.00
$200.00
Setup Labor
$2.40
$18.00
$180.00
Automated Machinery
$60.00
$140.00
$300.00
Finishing
$28.00
$35.00
$49.00
Pack and Ship
$5.87
$35.20
$52.80
Total ABC Overhead
$111.74
$258.20
$837.00
Unit ABC Cost
$239.74
$368.20
$1,031.00
Total ABC Cost
$3,596,100
$1,841,000
$515,500
2. Volume-based results $3,385,500 ÷ 88,500 DLH = $38.25 per DLH
Value
Quality
Luxury
Direct Materials
$80.00
$50.00
$110.00
Direct Labor
$48.00
$60.00
$84.00
Overhead
$153.00
$191.25
$267.75
Cost per unit
$281.00
$301.25
$461.75
Total Cost
$4,215,000
$1,506,250
$230,875
Note how the volume-based method significantly undercosts the Luxury
group (the low-volume group), while overcosting the Value group (the
high-volume customer group).
Chapter 5 – Activity-Based Costing and Customer Profitability Analysis
5-25
5-40 (continued –2)
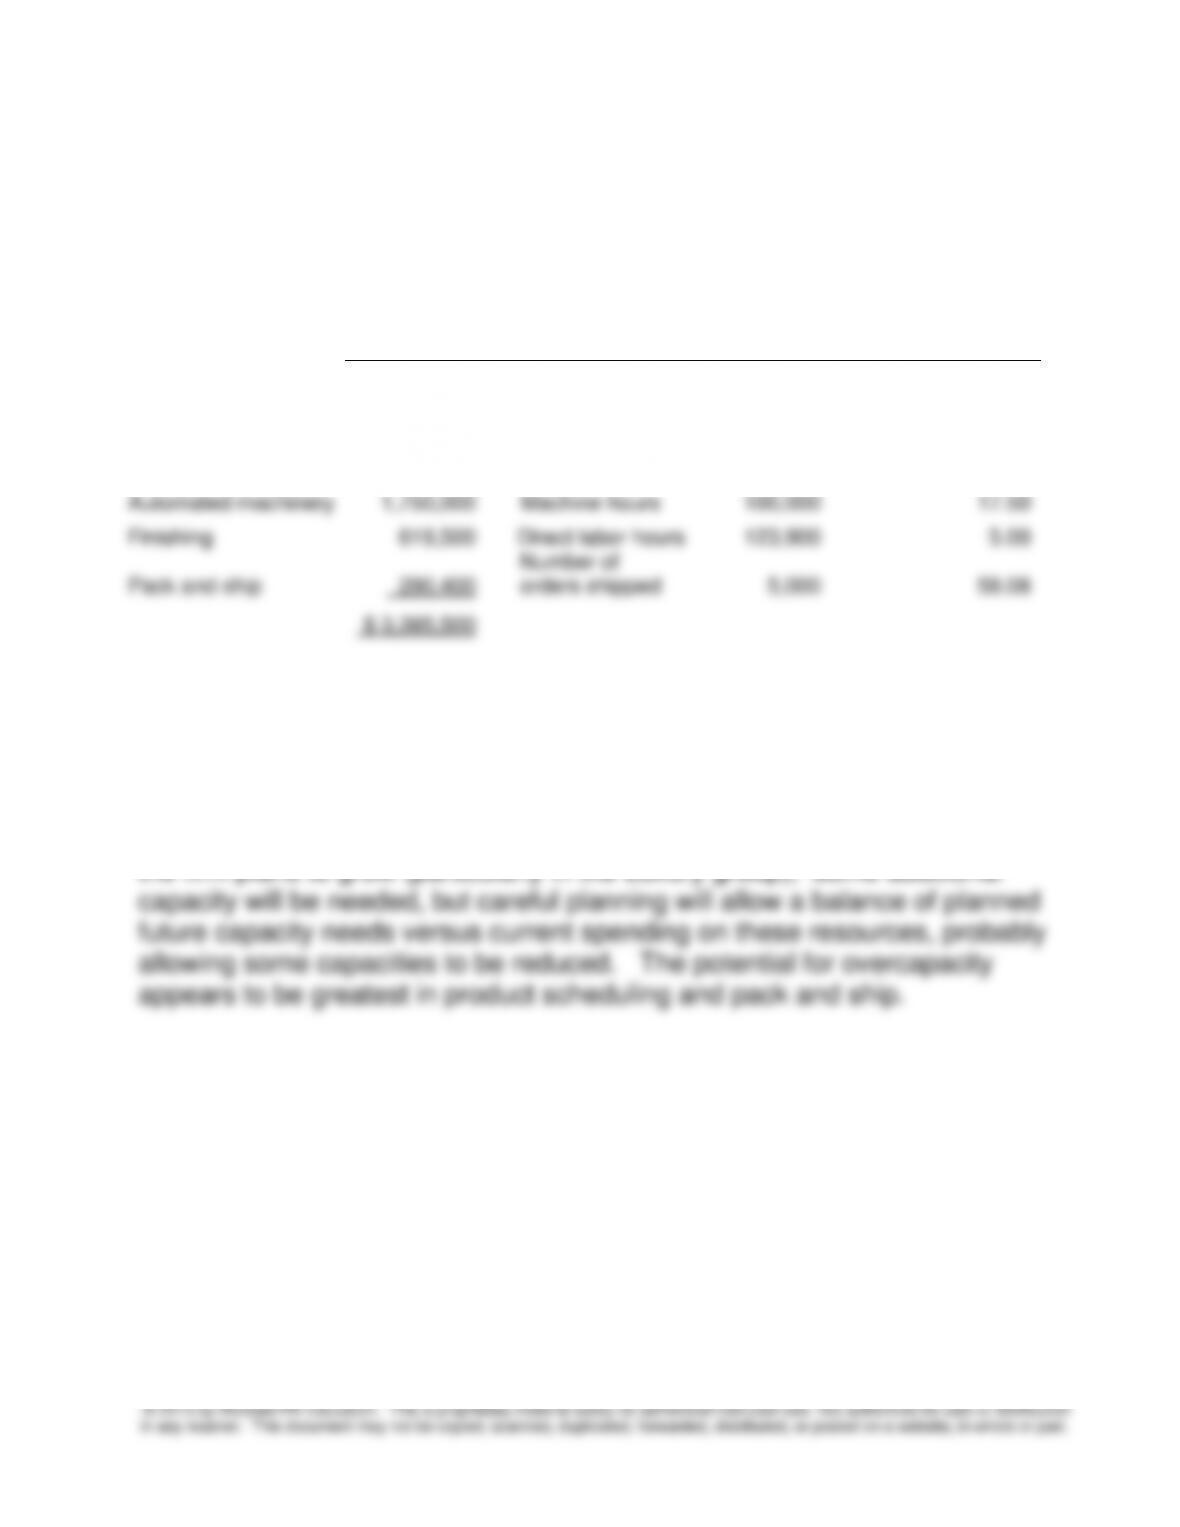
3. The new activity rates based on practical capacity are as follows.
Budgeted
Cost
Cost Driver
Practical
Capacity
Practical
Capacity-Based
Rates
Materials handling
$ 349,600
Number of parts
990,000
$ 0.35
Product scheduling
160,000
Number of
production orders
800
200.00
Setup labor
216,000
Number of setups
200
1,080.00
Automated machinery
1,750,000
Machine hours
100,000
17.50
Finishing
619,500
Direct labor hours
123,900
5.00
Pack and ship
290,400
Number of
orders shipped
5,000
58.08
$ 3,385,500
Note that the rates have changed significantly from the calculations in part 1
above, because there is a significant level of unused capacity in many of the
activities. This information could be used by management to calculate unit
ABC-based costs using the practical capacity rates, and thereby identify the
cost of unused capacity. Moreover, the information about capacity utilization
can be used to help bring resource spending in line with resource usage. As
Chapter 5 – Activity-Based Costing and Customer Profitability Analysis
5-26
5-40 (continued – 3)
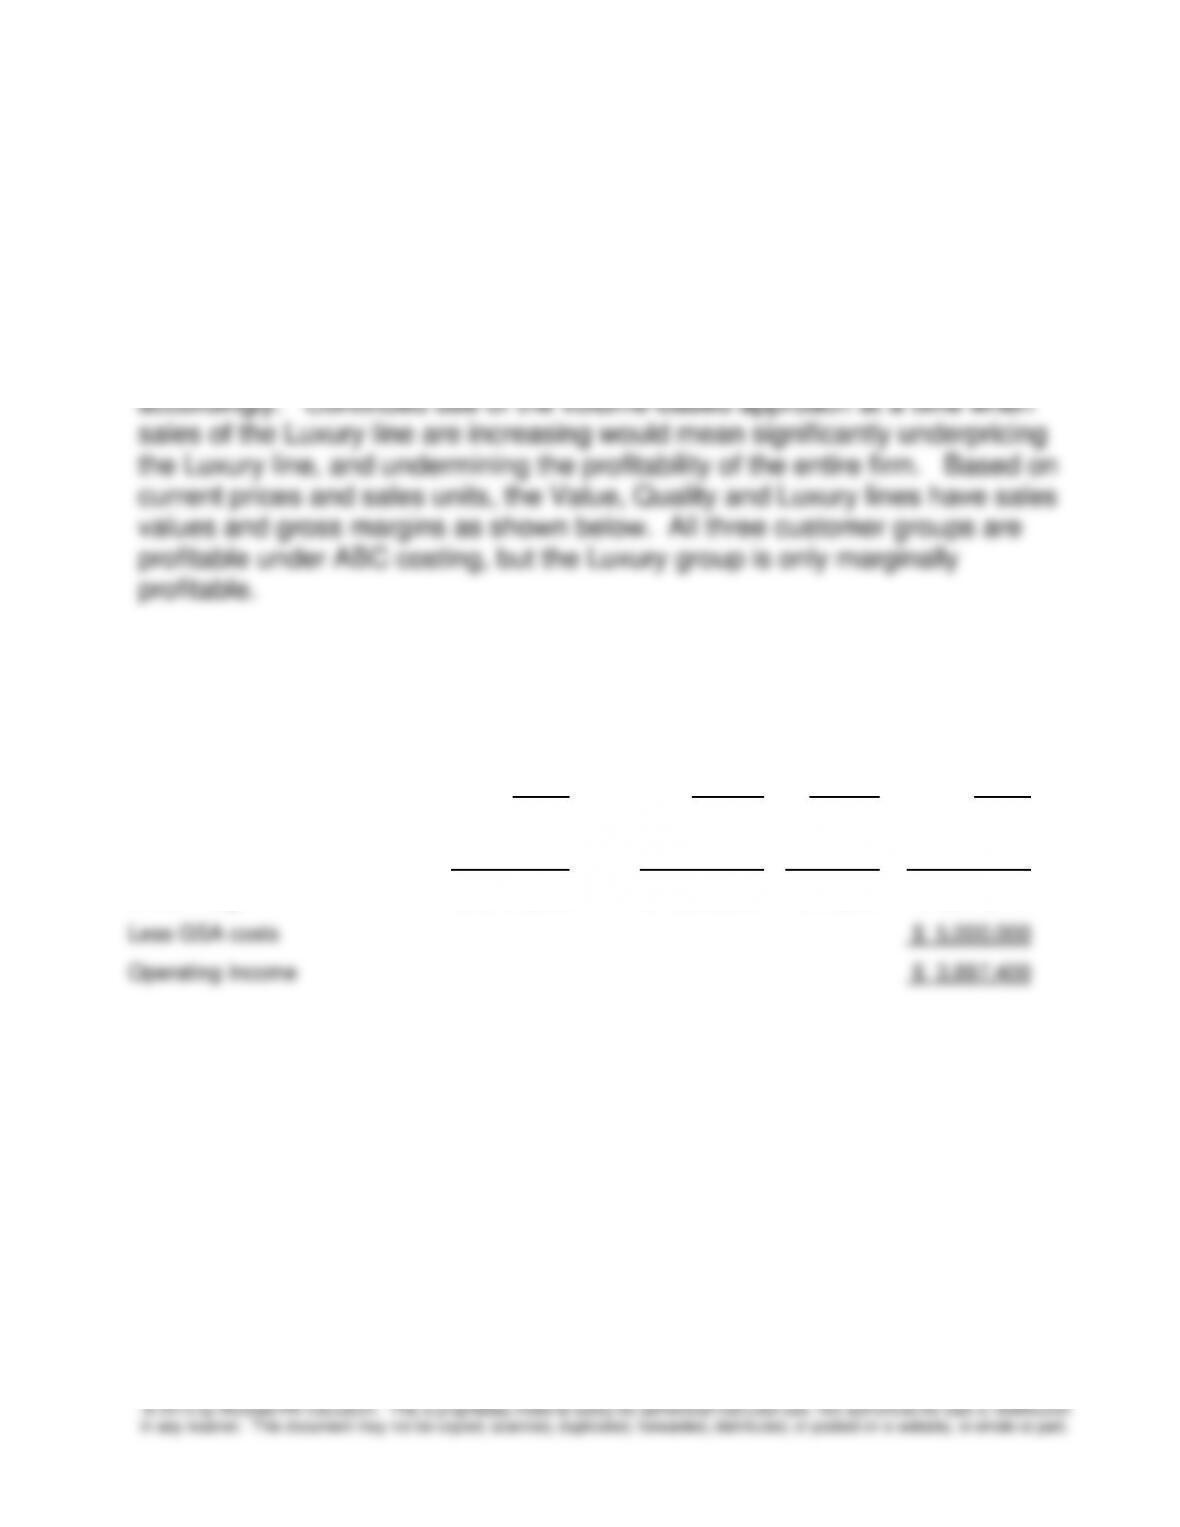
4. The ABC costing shows clearly how expensive the Luxury group is to
produce. The volume-based approach fails to account for the activity usage
of the Luxury line, and undercosts it significantly. ABC allows LFI to better
understand how its costs will increase with the expected increased production
of the Luxury line, and how it will have to adapt its pricing practices
Profitability by Customer Group
Profitability by Customer Group
Value
Quality
Luxury
Total
Sales Value of each product
$ 9,750,000
$ 4,500,000
$600,000
$ 14,850,000
Less ABC Manufacturing cost
$ 3,596,100
$ 1,841,000
$515,500
$ 5,952,600
Gross Margin
$ 6,154,000
$ 2,659,000
$ 84,500
$ 8,897,400
Less GSA costs
$ 5,000,000
Operating Income
$ 3,897,400
Chapter 5 – Activity-Based Costing and Customer Profitability Analysis
5-27
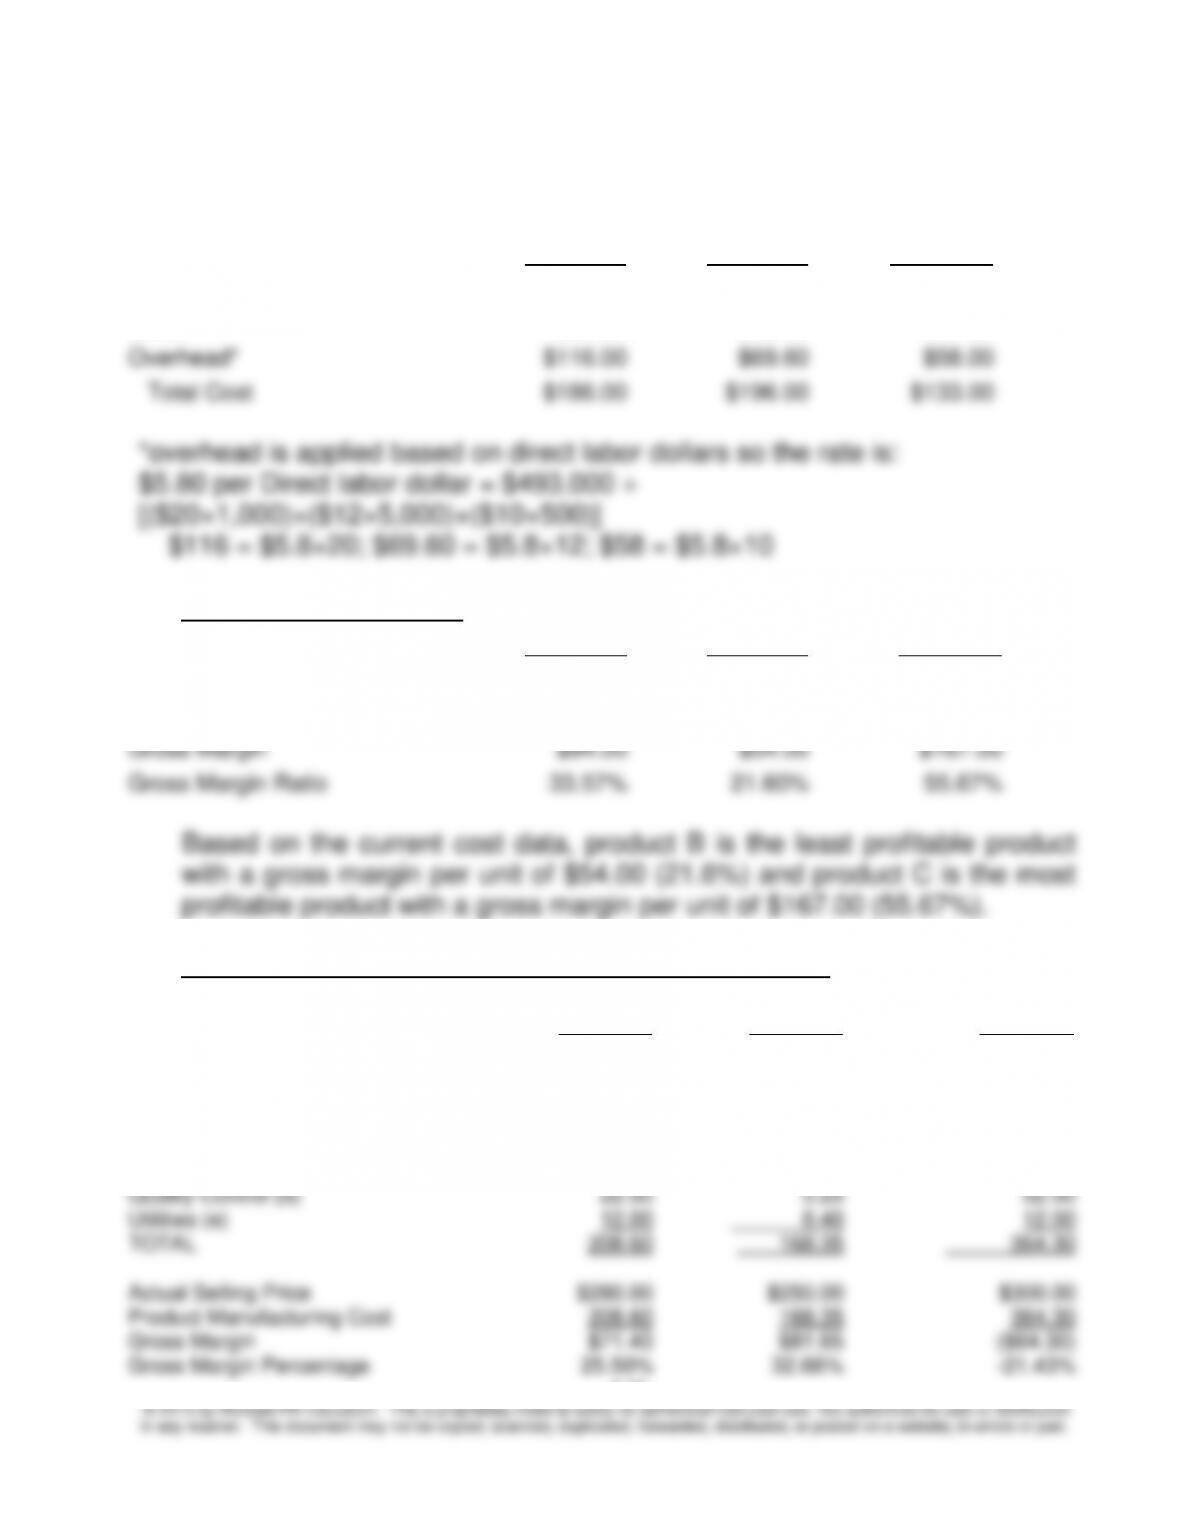
5-41 Volume-based Costing Versus ABC (35 min)
Product A
Product B
Product C
Materials
$50.00
$114.40
$65.00
Labor
$20.00
$12.00
$10.00
Overhead*
$116.00
$69.60
$58.00
Total Cost
$186.00
$196.00
$133.00
*overhead is applied based on direct labor dollars so the rate is:
$5.80 per Direct labor dollar = $493,000 ÷
[($20×1,000)+($12×5,000)+($10×500)]
$116 = $5.8×20; $69.60 = $5.8×12; $58 = $5.8×10
1. Current Costing system
Product A
Product B
Product C
Actual Selling Price
$280.00
$250.00
$300.00
Product Manufacturing Cost
$186.00
$196.00
$133.00
Gross Margin
$94.00
$54.00
$167.00
Gross Margin Ratio
33.57%
21.60%
55.67%
Based on the current cost data, product B is the least profitable product
with a gross margin per unit of $54.00 (21.6%) and product C is the most
profitable product with a gross margin per unit of $167.00 (55.67%).
Product costs based on the activity-based costing system
(calculate on per unit basis)
Product A
Product B
Product C
Direct Materials
50.00
114.40
65.00
Direct Labor
20.00
12.00
10.00
Factory Overhead:
Setups (a)
1.60
0.80
4.80
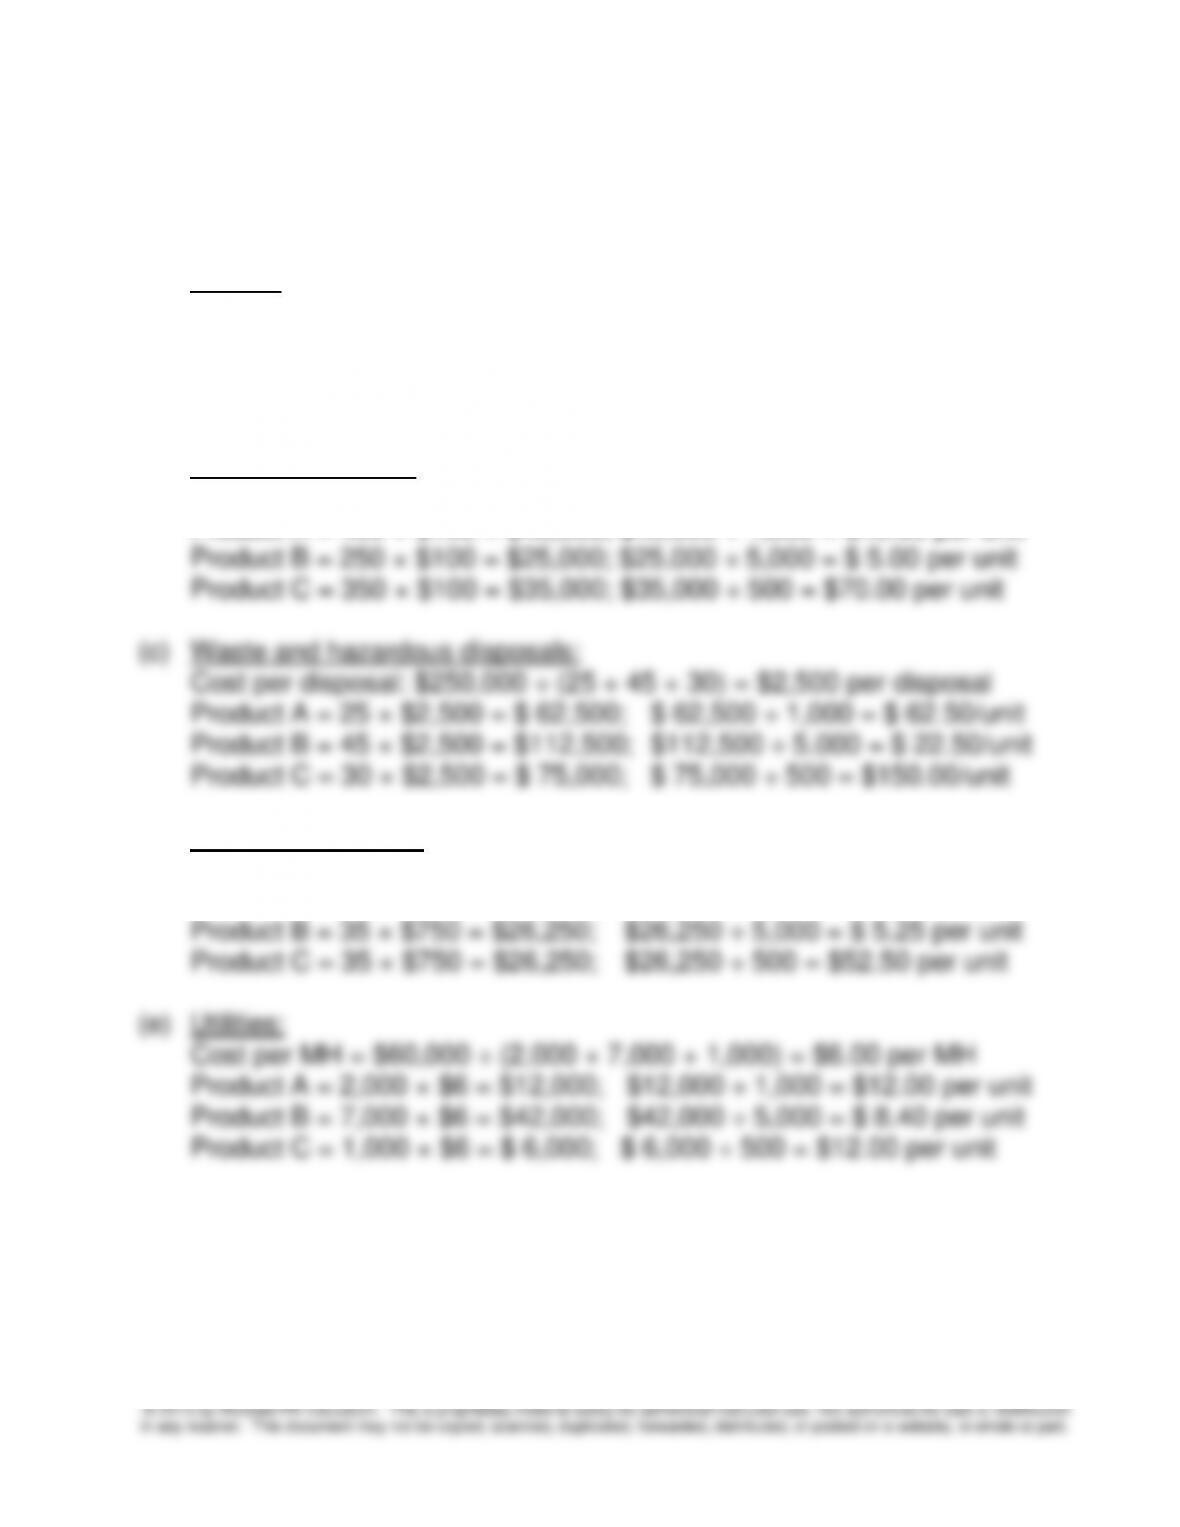
Materials Handling (b)
40.00
5.00
70.00
Hazardous Control (c)
62.50
22.50
150.00
Quality Control (d)
22.50
5.25
52.50
Utilities (e)
12.00
8.40
12.00
TOTAL
208.60
168.35
364.30
Actual Selling Price
$280.00
$250.00
$300.00
Product Manufacturing Cost
208.60
168.35
364.30
Gross Margin
$71.40
$81.65
($64.30)
Gross Margin Percentage
25.50%
32.66%
-21.43%
Chapter 5 – Activity-Based Costing and Customer Profitability Analysis
5-28
5-41 (continued –1)
Notes:
(a) Setups:
Cost per setup: $8,000 ÷ (2 + 5 + 3) =$800 per setup
Product A = 2 × $800 = $1,600; $1,600 ÷1,000 = $1.60 per unit
Product B = 5 × $800 = $4,000; $4,000 ÷5,000 = $0.80 per unit
Product C = 3 × $800 = $2,400; $2,400 ÷500 = $4.80 per unit
(b) Materials handling:
Cost per pound = $100,000 ÷ (400 + 250 + 350) = $100 per pound
Product A = 400 × $100 = $40,000; $40,000 ÷ 1,000 = $40.00 per unit
(d) Quality inspections:
Cost per inspection = $75,000 ÷ (30 + 35 + 35) = $750 per inspection
Product A = 30 × $750 = $22,500; $22,500 ÷ 1,000 = $22.50 per unit
5-29
5-41 (continued-2)
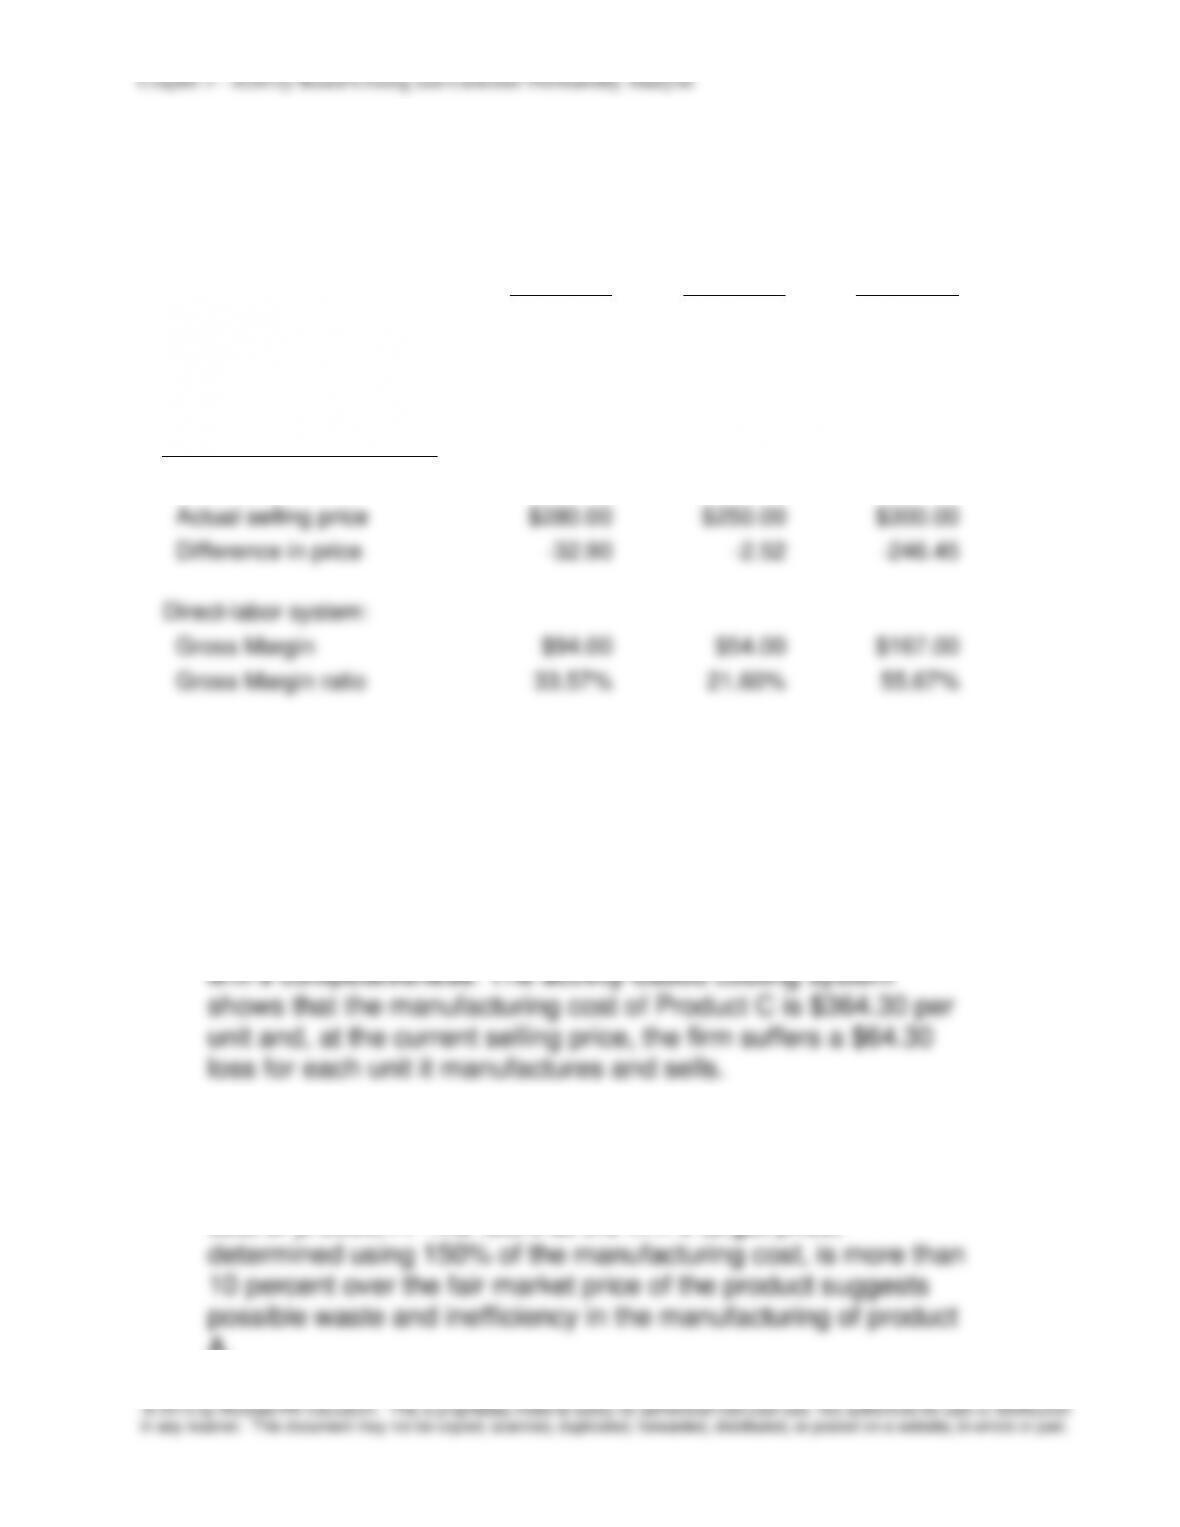
2. Comparison of reported product costs, new target price, actual selling price,
and gross margin (loss):
Product A
Product B
Product C
Product Costs:
Direct-labor system
$186.00
$196.00
$133.00
Activity system
$208.60
$168.35
$364.30
ABC– based product costs:
Target price
$312.90
$252.53
$546.45
Actual selling price
$280.00
$250.00
$300.00
Difference in price
-32.90
-2.52
-246.45
Direct-labor system:
Gross Margin
$94.00
$54.00
$167.00
Gross Margin ratio
33.57%
21.60%
55.67%
ABC system:
Gross Margin
$71.40
$81.65
-$64.30
Gross Margin ratio
25.50%
32.66%
-21.43%
3. Strategic and Competitive Analysis
a. Emphasizing Product C as suggested by the current direct-
labor-cost based overhead costing system is likely to harm the
b. If the actual selling prices of products A & B are fair market
prices for these products and a markup of 150% is a common
industry practice, the firm needs to examine the manufacturing
cost of product A. The fact that the firm’s target price,
A.
Chapter 5 – Activity-Based Costing and Customer Profitability Analysis
5-30
5-42 Activity-Based Costing (35-40 min)
(“Miami Valley Architects, Inc.” by Beth M. Chaffman, and John Talbott,
Management Accounting Campus Report, Fall 1992, p.4)
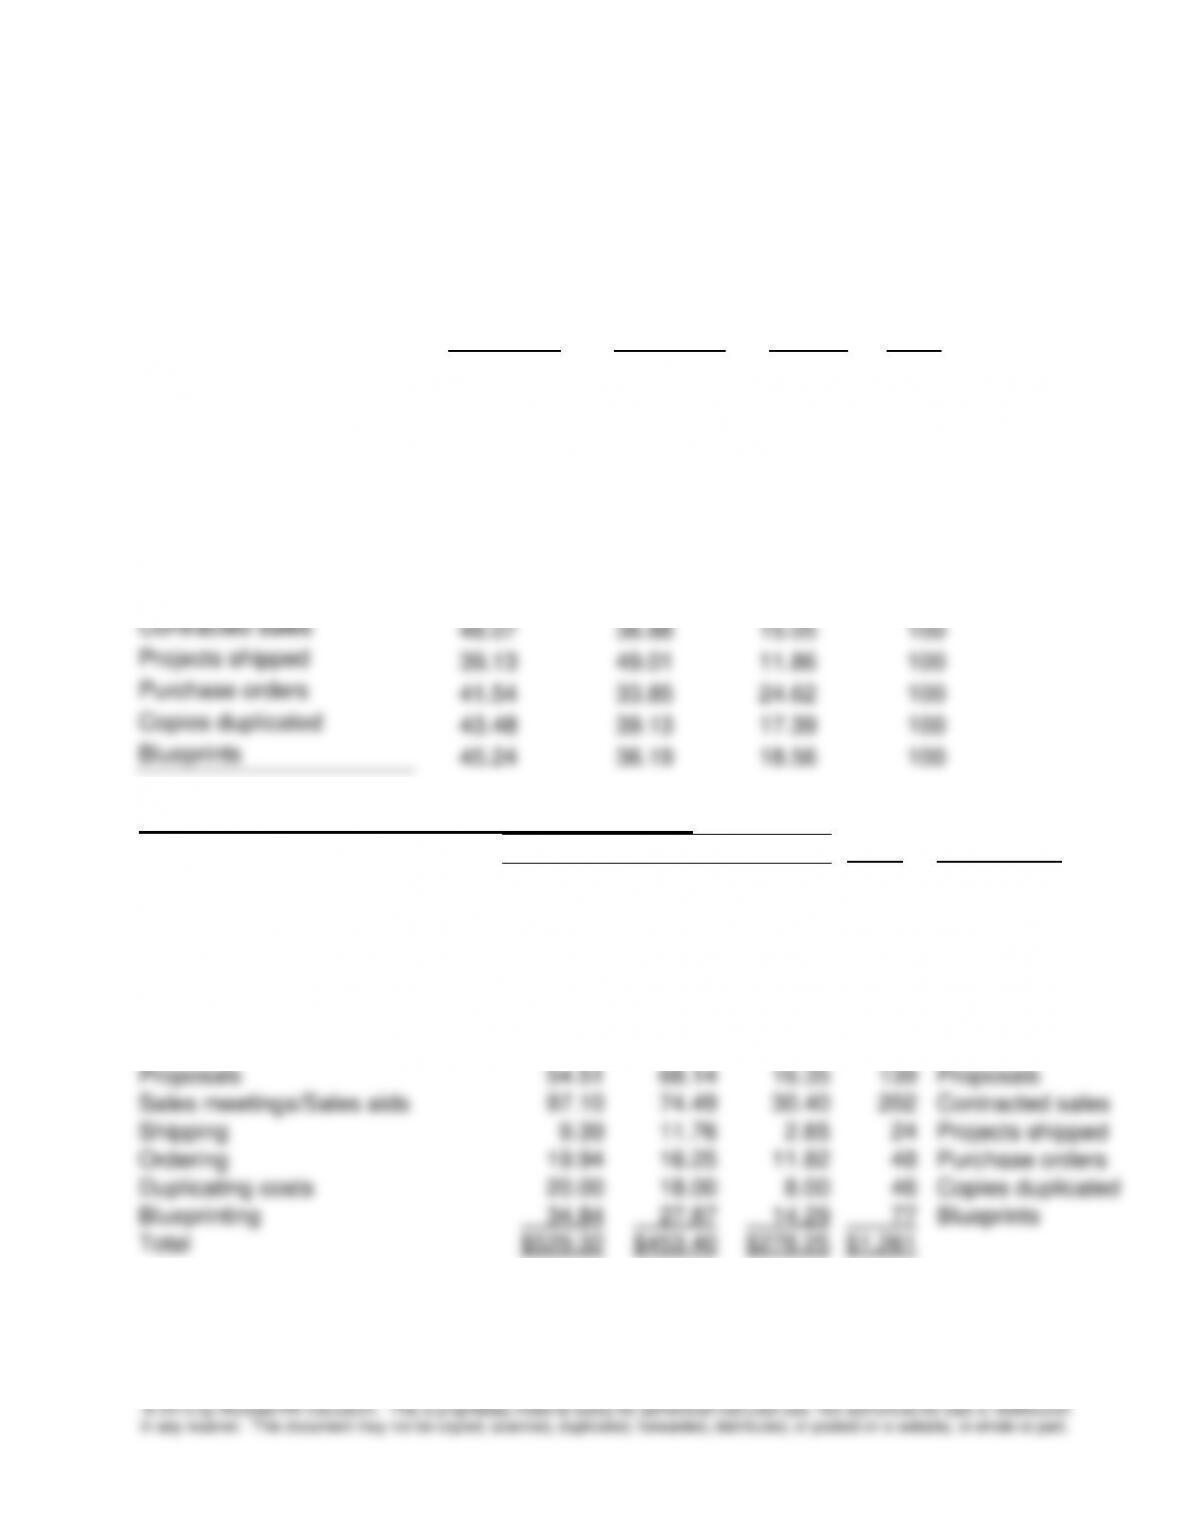
1. Overhead Cost assigned to each branch under the ABC costing:
Columbus
Cincinnati
Dayton
Total
Direct labor dollar
37.61%
31.19%
31.20%
100%
Timesheet entries
45.11
28.57
26.32
100
Vendor invoices
44.93
37.44
17.62
100
Client invoices
52.13
39.36
8.51
100
Employees
34.33
38.81
26.87
100
New hires
42.11
21.05
36.84
100
Insurance claims filed
34.33
38.81
26.87
100
Proposals
39.22
49.02
11.76
100
Contracted sales
48.07
36.88
15.05
100
Projects shipped
39.13
49.01
11.86
100
Purchase orders
41.54
33.85
24.62
100
Copies duplicated
43.48
39.13
17.39
100
Blueprints
45.24
36.19
18.56
100
Activity-based overhead allocation (000s)
Colum.
Cinci.
Dayton
Total
Cost Driver
General administration
$153.82
$127.56
$127.60
$ 409
Direct labor dollar
Project costing
21.65
13.71
12.63
48
Timesheet entries
Accounts payable/receiving
62.46
52.05
24.49
139
Vendor invoices
Accounts receivable
24.50
18.50
4.00
47
Client invoices
Payroll/Mail sort & delivery
10.30
11.64
8.06
30
Employees
Personnel recruiting
16.00
8.00
14.00
38
New hires
Employee insurance process.
4.81
5.43
3.76
14
Insurance claims filed
Proposals
54.51
68.14
16.35
139
Proposals
Sales meetings/Sales aids
97.10
74.49
30.40
202
Contracted sales
Shipping
9.39
11.76
2.85
24
Projects shipped
Ordering
19.94
16.25
11.82
48
Purchase orders
Duplicating costs
20.00
18.00
8.00
46
Copies duplicated
Blueprinting
34.84
27.87
14.29
77
Blueprints
Total
$529.32
$453.40
$278.25
$1,261
Note: Results will vary slightly if % used from part 1 are rounded to 2 places