Chapter 5 – Activity-Based Costing and Customer Profitability Analysis
5-1
Chapter 5
Activity-Based Costing and Customer Profitability Analysis
Teaching Notes for Cases
5-1 Blue Ridge Manufacturing (Activity-Based Costing for Marketing Channels)
Case Description:
Blue Ridge Manufacturing produces and sells towels for the U.S. “sport towel” market. A “sport towel” is a towel that
has the promotion of an event or a log printed on it. Most often they are used in connection with major sporting events
such as the Super Bowl.
Case Writers: Paul E. Juras and Paul A. Dierks, Wake Forest University; written for the IMA 1994 Student Case
Competition
Teaching Objectives:
The main teaching objective of the case is to illustrate, with an extensive numerical exercise, the use of value chain
analysis for profitability analysis. The analysis follows an ABC model, in which selling and administrative costs are
allocated to customer groups for the purpose of analyzing customer profitability.
Main Points:
Activity-Based Costing
Value Chain Analysis
Customer profitability analysis
Discussion Questions:
1. What is Blue Ridge’s competitive strategy?
The current strategy appears to be a combination of focus (on the southeast states) and cost leadership. The
manufacturing is in a modern plant with upgraded facilities, including the use of ABC costing for manufacturing
costs and the commitment to introducing advanced manufacturing techniques. This suggests a commitment to
competitors.
The case does not provide sufficient information for a thorough strategic analysis. However, the student’s
should be expected to identify strategic issues, as noted above, and also:
a) Is the new ink patented? How soon are competitors expected to meet this new innovation?
b) Are Blue Ridge’s licenses with the sports teams of unique value, or do competitors have the same access as
Blue Ridge?
c) How strong are Blue Ridge’s ties to its customers, especially the large customers? Are these ties sufficiently
strong to protect against competition for the next few years?
d) Has Blue Ridge integrated the marketing and manufacturing strategies, so that they are consistent? Given the
changes in both manufacturing (new ink) and marketing (going national, seeking more profitable customers), the
integration of these functions is important.
Chapter 5 – Activity-Based Costing and Customer Profitability Analysis
5-2
2. What type of cost system does Blue Ridge use, and is it consistent with their strategy?
The ABC costing system in use is consistent with the cost leadership strategy. It will also assist the firm in
innovation.
3. What is Blue Ridge likely to gain from a value chain analysis? What are some of the opportunities for cost reduction
and for value added for the customers?
embroidery, and marketing-distribution:
A study of the value chain raises issues for possible cost reduction and value added.
Cost reduction:
– Can Blue Ridge obtain better terms or prices from its suppliers? Materials cost represents a large share of total
manufacturing cost.
– Use profitability analysis (as illustrated in the computer exercise below) to determine the “full” costs of each
– Geographic location
– Technical support requirements
(Does Blue Ridge do design or other service for any of the customers, and if so are they properly charged to the
customer?)
Value Added for Customers
– Develop service links with the larger customers, as in the case of Proctor and Gamble and Wal-Mart; where the retailer
and manufacturer share data so that the manufacturer knows when, where and what to restock at the retailer’s various
locations
– Faster delivery, better coordination with all customers, especially the largest ones
– Identify new ways to improve customer satisfaction
– Identify new ways to boost demand at the retail level
Computer Assignment:
Develop a spreadsheet analysis, which can be used to assess the profitability of the three customer groups of Blue Ridge
— large, medium and small customer account size. Use the information in Tables 1-4 to trace and allocate the costs
necessary for the analysis.
The solution is shown on the attached spreadsheet. The solution process involves three stages:
Stage 1: Allocate SG & A Costs to SG & A Activities.
1. Collect all SG & A costs incurred in each function (Shipping, Sales, Marketing) as showed in Table 4A of
the case.
2. For each function, collect usage % for each activity (Entering P.O., Commissions, Shipping, Invoicing,
Making Sales Calls, Checking Credit, Samples & Catalog Information, Special Handling, Distribution
Management, Marketing by Customer Type, Advertising & Promotion, Marketing, Administrative Office
Support, and Licenses & Fees) as shown in 4A.
3. Then, allocate function costs to activities by usage %.
Chapter 5 – Activity-Based Costing and Customer Profitability Analysis
5-3
Stage 2: Allocate activity costs to Customer Type (Large, Medium, Small).
1. Identify cost drivers (as shown in Table 4) and their consumption statistics for each customer type (as
shown in Table 1).
Dyeing), SG & A cost and total costs for each customer group (using data from Tables 1 & 2).
3. Calculate customer profits ($102,661, $49,742, -$4,828) and profit per customer ($12,833, $323, -$6) for
each customer type.
Note that the analysis makes it clear the group of large customers provide most of the profits for Blue Ridge.
Show how the cost of purchase orders, shipping, the medium and small customer groups predominantly cause credit
checks, advertising, and marketing. The analysis shows clearly that these two groups, on a per customer basis, are
marginally profitable. This analysis indicates that Blue Ridge should concentrate on its largest customers and/or
determines how to make its smaller customers more profitable. This is especially important if the firm is planning to “go
national” and this may bring in an even larger portion of medium and smaller customers.
Chapter 5 – Activity-Based Costing and Customer Profitability Analysis
5-4
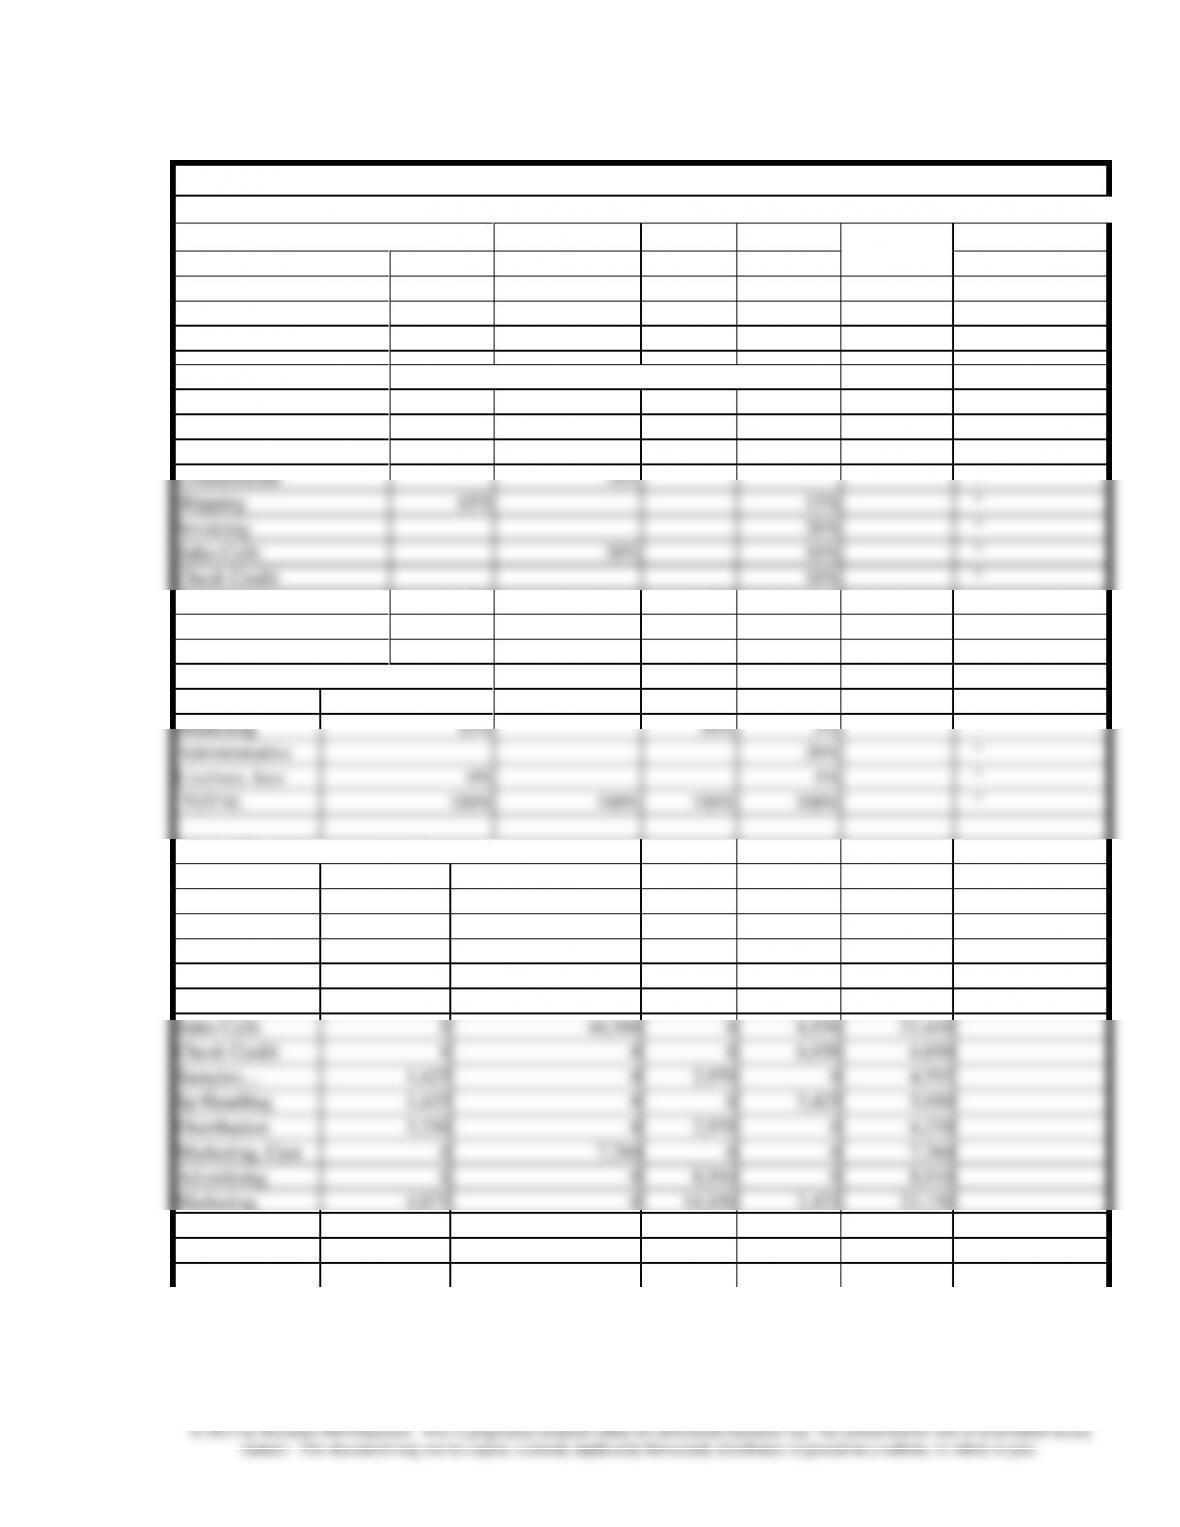
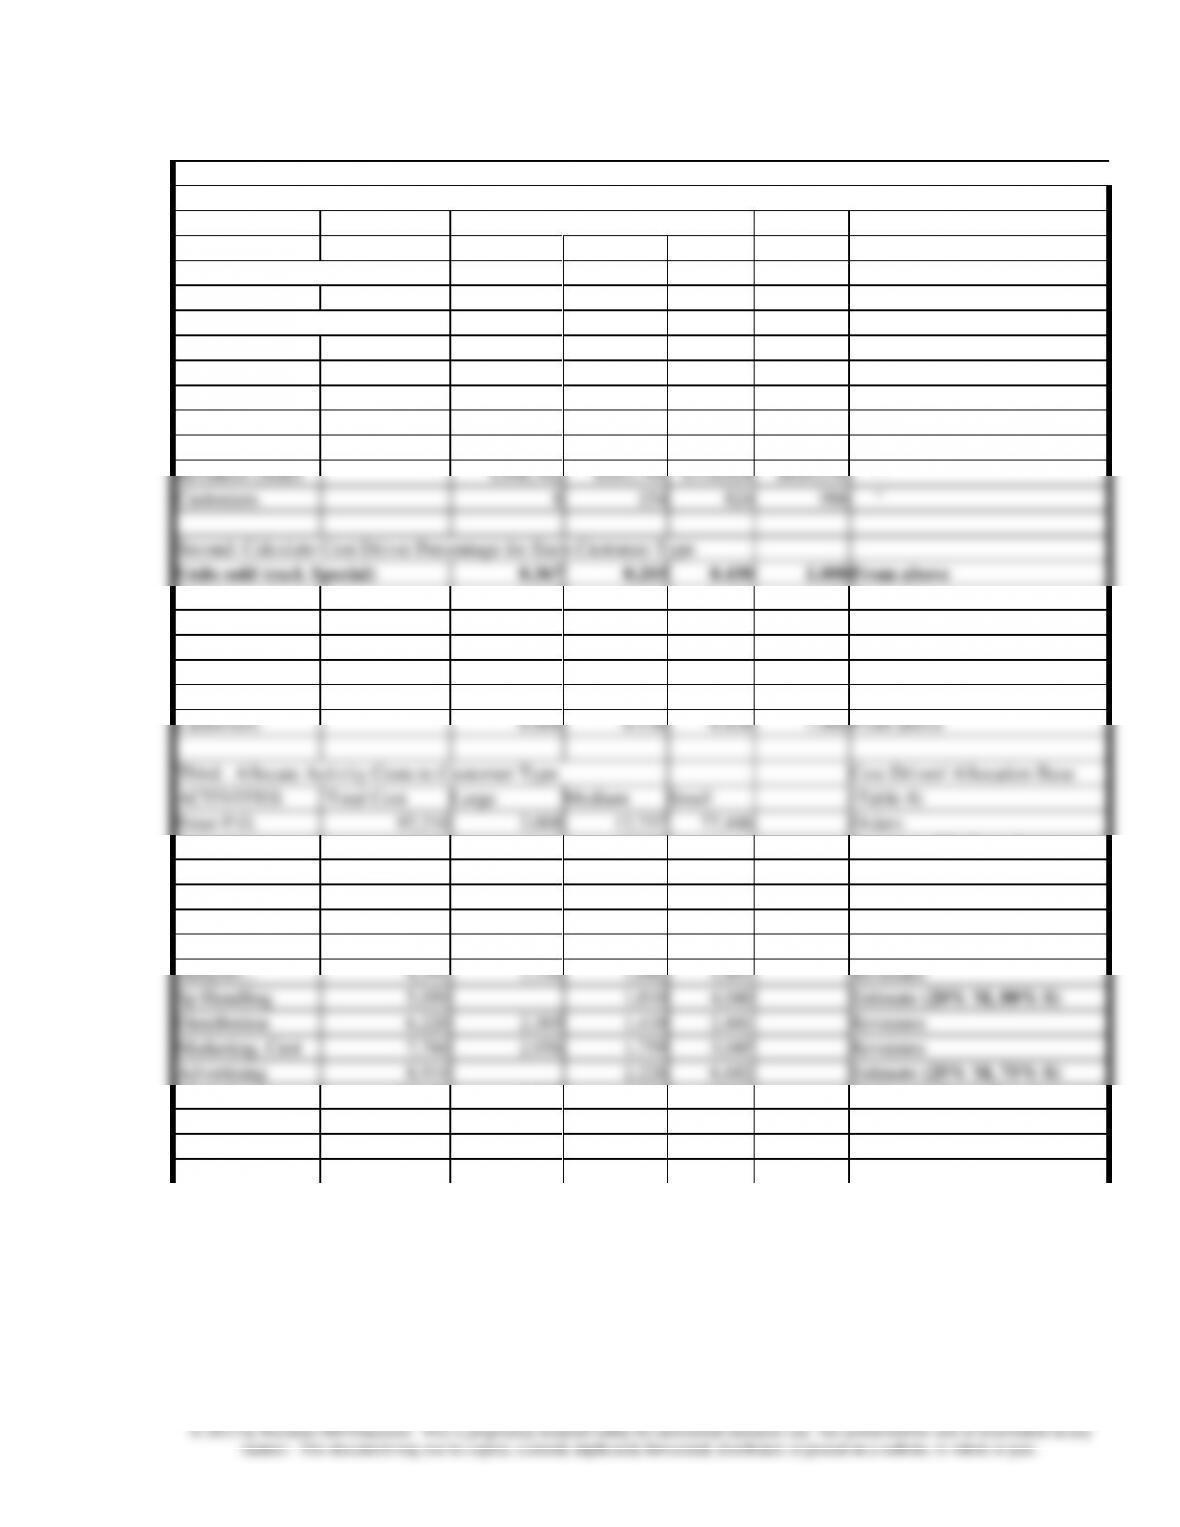
Blue Ridge Manufacturing
First Stage Allocation: Allocate SG&A Costs to SG&A Activities
First: SG&A Costs
Total
Assigned
Shipping
Sales
Marketing
Other
Source
Administration
17,000
37,400
20,400
56,100
130,900
Table 3
Selling
15,500
117,800
9,300
12,400
155,000
Table 3
$32,500
$155,200
$29,700
$68,500
$285,900
Percentage of…
Second: SG&A
Shipping
Sales
Marketing
Other
ACTIVITIES
Enter P.O.
55%
10%
Table 3
Commissions
10%
”
Shipping
65%
15%
”
Invoicing
20%
”
Sales Calls
30%
10%
”
Check Credit
10%
”
Samples…
5%
10%
”
Sp Handling
5%
5%
”
Distribution
10%
10%
”
Marketing, Customer
5%
”
Advertising
30%
”
Marketing
15%
50%
5%
”
Administrative
20%
”
Licenses, fees
0%
5%
”
TOTAL
100%
100%
100%
100%
”
Third: Allocate Costs to Activities
Shipping
Sales
Marketing
Other
Total
ACTIVITIES
Enter P.O.
0
85,360
0
6,850
92,210
Commissions
0
15,520
0
0
15,520
Shipping
21,125
0
0
10,275
31,400
Invoicing
0
0
0
13,700
13,700
Sales Calls
0
46,560
0
6,850
53,410
Check Credit
0
0
0
6,850
6,850
Samples,…
1,625
0
2,970
0
4,595
Sp Handling
1,625
0
0
3,425
5,050
Distribution
3,250
0
2,970
0
6,220
Marketing, Cust
0
7,760
0
0
7,760
Advertising
0
0
8,910
0
8,910
Marketing
4,875
0
14,850
3,425
23,150
Administrative
0
0
0
13,700
13,700
Licenses, fees
0
0
0
3,425
3,425
TOTAL
$ 32,500
$155,200
$29,700
$68,500
$285,900
Table 3
Chapter 5 – Activity-Based Costing and Customer Profitability Analysis
5-5
Second Stage Allocation: Allocates SA&A Activities to Customer Type (Large, Medium, Small)
First: Identify Cost Driver and Its Consumption Level or Amount
Customer Type...
COST DRIVER
Large
Medium
Small
Total
Units sold- w/o specials
99,770
55,118
116,812
271,700
Units sold-Total
100,250
58,544
117,406
276,200
Table 1
Units embroidered
5,959
6,490
29,394
41,843
”
Units dyed
20,536
9,935
12,328
42,799
”
Orders
133
845
5,130
6,108
”
Shipments
147
923
5,431
6,501
”
Invoices
112
754
4,737
5,603
”
%>60days
1
11
122
134
”
Revenues (Sales
$308,762
$183,744
$318,024
$810,530
”
Customers
8
154
824
986
”
Second: Calculate Cost Driver Percentage for Each Customer Type
Units sold (excl. Special)
0.367
0.203
0.430
1.000
From above
Orders
0.022
0.138
0.840
1.000
From above
Shipments
0.023
0.142
0.835
1.000
From above
Invoices
0.020
0.135
0.845
1.000
From above
%>60days
0.007
0.082
0.910
1.000
From above
Revenues
0.381
0.227
0.392
1.000
From above
Customers
0.008
0.156
0.836
1.000
From above
Third: Allocate Activity Costs to Customer Type
Cost Driver/ Allocation Base
ACTIVITIES
Total Cost
Large
Medium
Small
(Table 4)
Enter P.O.
92,210
2,008
12,757
77,446
Orders
Commissions
15,520
15,520
Revenues (Medium Customers
Shipping
31,400
710
4,458
26,232
Shipments
Invoicing
13,700
274
1,844
11,583
Invoices
Sales Calls
53,410
53,410
Revenues (Large
Check Credit
6,850
51
562
6,237
%>60days
Samples…
4,595
1,750
1,042
1,803
Revenues
Sp Handling
5,050
1,010
4,040
Estimate (20% M, 80% S)
Distribution
6,220
2,369
1,410
2,441
Revenues
Marketing, Cust
7,760
2,956
1,759
3,045
Revenues
Advertising
8,910
2,228
6,682
Estimate (25% M, 75% S)
Marketing
23,150
8,501
4,696
9,953
Units sold (Excluding Specials)
Administrative
13,700
5,031
2,779
5,890
Units sold (Excluding Specials)
Licenses, fees
3,425
3,425
Revenues (Medium Customers
TOTAL
285,900
77,060
53,490
155,350
AA
Chapter 5 – Activity-Based Costing and Customer Profitability Analysis
5-6
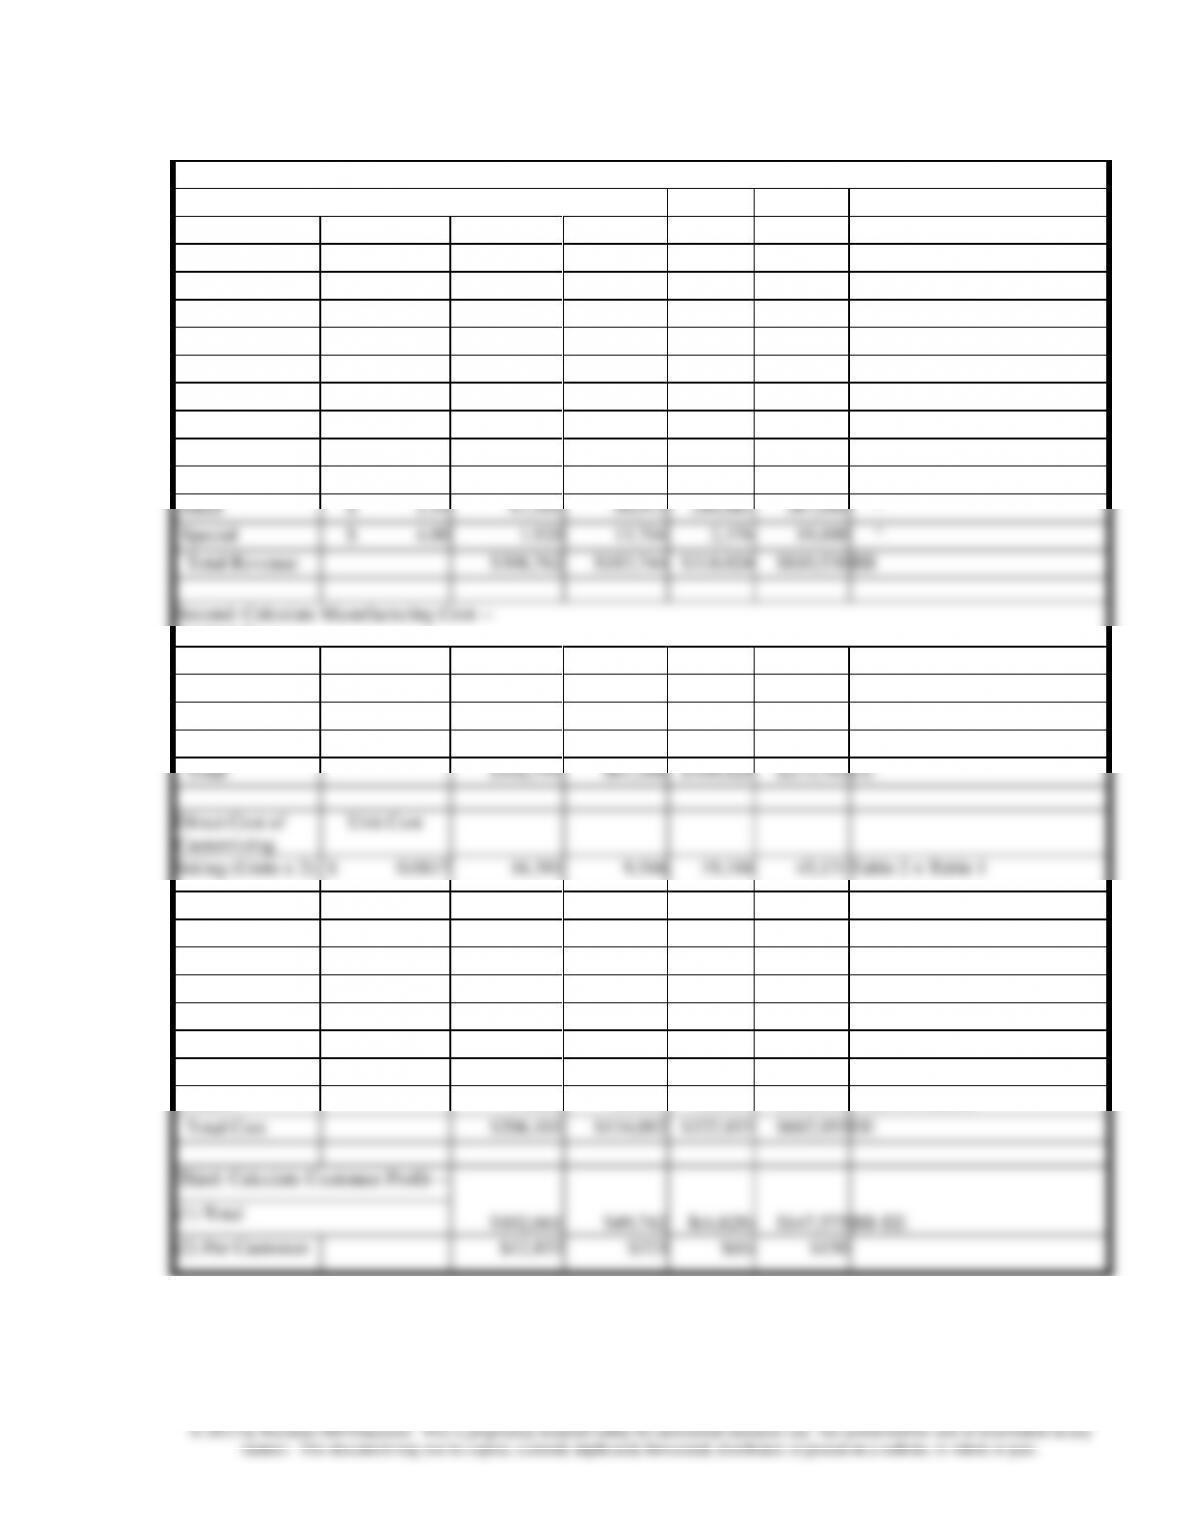
Third Stage: Customer Profitability Analysis
First: Get Revenues by Customer Group
Unit Sales
Large
Medium
Small
Regular
27,250
16,600
10,550
54,400
Table 1
Mid-size
36,640
18,552
10,308
65,500
”
Hand
35,880
19,966
95,954
151,800
”
Special
480
3,426
594
4,500
”
Total
100,250
58,544
117,406
276,200
Revenue
Price
Large
Medium
Small
Regular
$ 3.60
98,100
59,760
37,980
195,840
Table 2
Mid-size
$ 3.20
117,248
59,366
32,986
209,600
”
Hand
$ 2.55
91,494
50,913
244,683
387,090
”
Special
$ 4.00
1,920
13,704
2,376
18,000
”
Total Revenue
$308,762
$183,744
$318,024
$810,530
BB
Second: Calculate Manufacturing Cost —
(1) Unit Cost
Regular
$ 1.19
32,428
19,754
12,554
64,736
Table 2 x Table 1
Mid-size
$ 1.03
37,739
19,109
10,617
67,465
”
Hand
$ 0.89
31,933
17,770
85,399
135,102
”
Special
$ 1.44
691
4,933
855
6,480
”
Total
$102,791
$61,566
$109,426
$273,783
CC
Direct Cost of
Customizing
Unit Cost
Inking (Units x 2)
$ 0.0817
16,381
9,566
19,184
45,131
Table 2 x Table 1
Embroidery
$ 1.2770
7,610
8,288
37,536
53,434
Dyeing
$ 0.1100
2,259
1,093
1,356
4,708
$26,249
$18,947
$58,076
$103,272
DD
(2) Total Cost
Mfg Cost
$102,791
$61,566
$109,426
$273,783
From CC above
Customizing
$26,249
$18,947
$58,076
$103,272
From DD above
SG&A
77,060
53,490
155,350
$285,900
From AA above
Total Cost
$206,101
$134,002
$322,853
$662,955
EE
Third: Calculate Customer Profit —
$102,661
$49,742
$(4,828)
$147,575
BB–EE
(1) Total
(2) Per Customer
$12,833
$323
$(6)
$150

Chapter 5 – Activity-Based Costing and Customer Profitability Analysis
5-7
5-2 Columbo Soft-Serve Frozen Yogurt
Purpose of the case:
This case illustrates the application of Activity-based costing to marketing costs in a food manufacturer.
While the purpose of analyzing product costs is to identify costs per unit of product, the purpose of analyzing
marketing costs is to identify costs per customer or customer group. This case illustrates how cost drivers are
identified and used to compare two separate customer groups based on the channels of distribution. These
cost drivers could also be used to analyze marketing costs for individual customers. This information is very
useful for understanding profitability in the two channels and for decisions about how to service the two
channels.
Suggested Strategy for Use:
About 60 to 90 minutes are needed to discuss the case thoroughly. This fits well in a 90 minute
class with some lecture about Activity-based costing. I suggest starting with a short background
about marketing in the food business followed by a discussion of the critical issues in the case.
Then, discuss the activity-based costing analysis of the marketing costs. During this phase,
discuss the development of cost drivers, how the firm might have identified them, whether other
cost drivers might be applicable, how to measure the cost drivers and how to collect data about
the cost drivers. Finally, discuss the suggestions for changes in strategy.
Background for the Case Analysis
Food Industry Structure:
There are two distinct channels of distribution in the food business. Grocery and Foodservice.
Grocery is defined as food purchased for later assembly, preparation and consumption in the local
Grocery store. Foodservice is defined as meals prepared for the consumer away from home. While
most are familiar with the local grocery store, foodservice includes any location a consumer may
venture to purchase or eat a meal such as the corner deli, Red Lobster, McDonald‘s or the college
cafeteria. Foodservice comprises more than 52 percent of consumer‘s food dollars and is growing at a
real rate of 1.5% faster than Grocery
.
Grocery and Foodservice evolved independently due to three primary factors: Packaging
requirements, Shipping/Logistics requirements and Marketing requirements.
▪ Packaging. The end use packaging format was the primary determinant of this separation.
Grocery stores sell relatively small package sizes whereas Foodservice uses either single-serve
Chapter 5 – Activity-Based Costing and Customer Profitability Analysis
5-8
© 2013 by McGraw-Hill Education. This is proprietary material solely for authorized instructor use. Not authorized for sale or distribution in
any manner. This document may not be copied, scanned, duplicated, forwarded, distributed, or posted on a website, in whole or part.
▪ Shipping/Logistics. There are six hundred thousand foodservice operators in the United States
and only thirty thousand grocery stores. Given similar channel sizes, the average foodservice
outlet purchases 1/20th the volume of the average grocery store. Furthermore, foodservice
operators generally have little storage room, so they tend to order more often than grocers do.
As a result, Grocery operators deal directly with manufacturers whereas Foodservice operators
deal with foodservice distributors who deal with the manufacturers. The Foodservice
distributors (such as Sysco, Alliant, US Foodservice) carry the entire line of products their
foodservice customers require including cooking equipment, dry food, fresh food, meats, etc.
In addition, the manufacturer distribution centers differ for each subchannel because Grocery
orders are predominately full cube/full truck orders whereas Foodservice orders are mostly
part cube and less than truckload (LTL) orders. Thus, grocery distribution centers are highly
standardized with significant automation whereas foodservice distribution centers are highly
customized and manually intense operations.
business (small, independent operators) through their sales force (Distributor Sales Rep œ
DSR) but remain beholden to the large foodservice operators.
Since the large foodservice operators are few and powerful, manufacturers have found it
profitable to develop strong business ties to these operators and use those relationships to
pull product into distributor inventories. Once they have the product, the distributor will
encourage their DSR‘s to sell the product on the street in an effort to maximize inventory
turns. Less than half the 600M foodservice operators are represented by chains, rather they
are independently operated. So the decision making in this market is quite uneven: a
General Mills planned to use this sales force to market Colombo yogurt.
This case concentrates only on Foodservice. Within Foodservice, there are two distinct sub-channels—
Shops and Impulse locations. These sub-channels differ in marketing and shipping requirements.
Shops specialize in frozen yogurt whereas Impulse locations specialize in other products—yogurt is an
add-on.
Chapter 5 – Activity-Based Costing and Customer Profitability Analysis
5-9
1. General Mills and Colombo Competitive Environment:
General Mills focuses on high quality and high sales service. They had a large sales force already selling to
Impulse segment; Colombo offered the advantage of one more product. The appeal was added profit for
little added effort. General Mills had little experience or expertise in selling to Shops
2. Activity-based costing analysis:
Cost of goods sold: – $14,250,000 (same for all cases) = $14,250,000/1,500,000 cases = $9.50 per case
▪ Impulse: 1,200,000 @ $9.50 = $11,400,000
▪ Shops: 300,000 @ $9.50 = $2,850,000
Chapter 5 – Activity-Based Costing and Customer Profitability Analysis
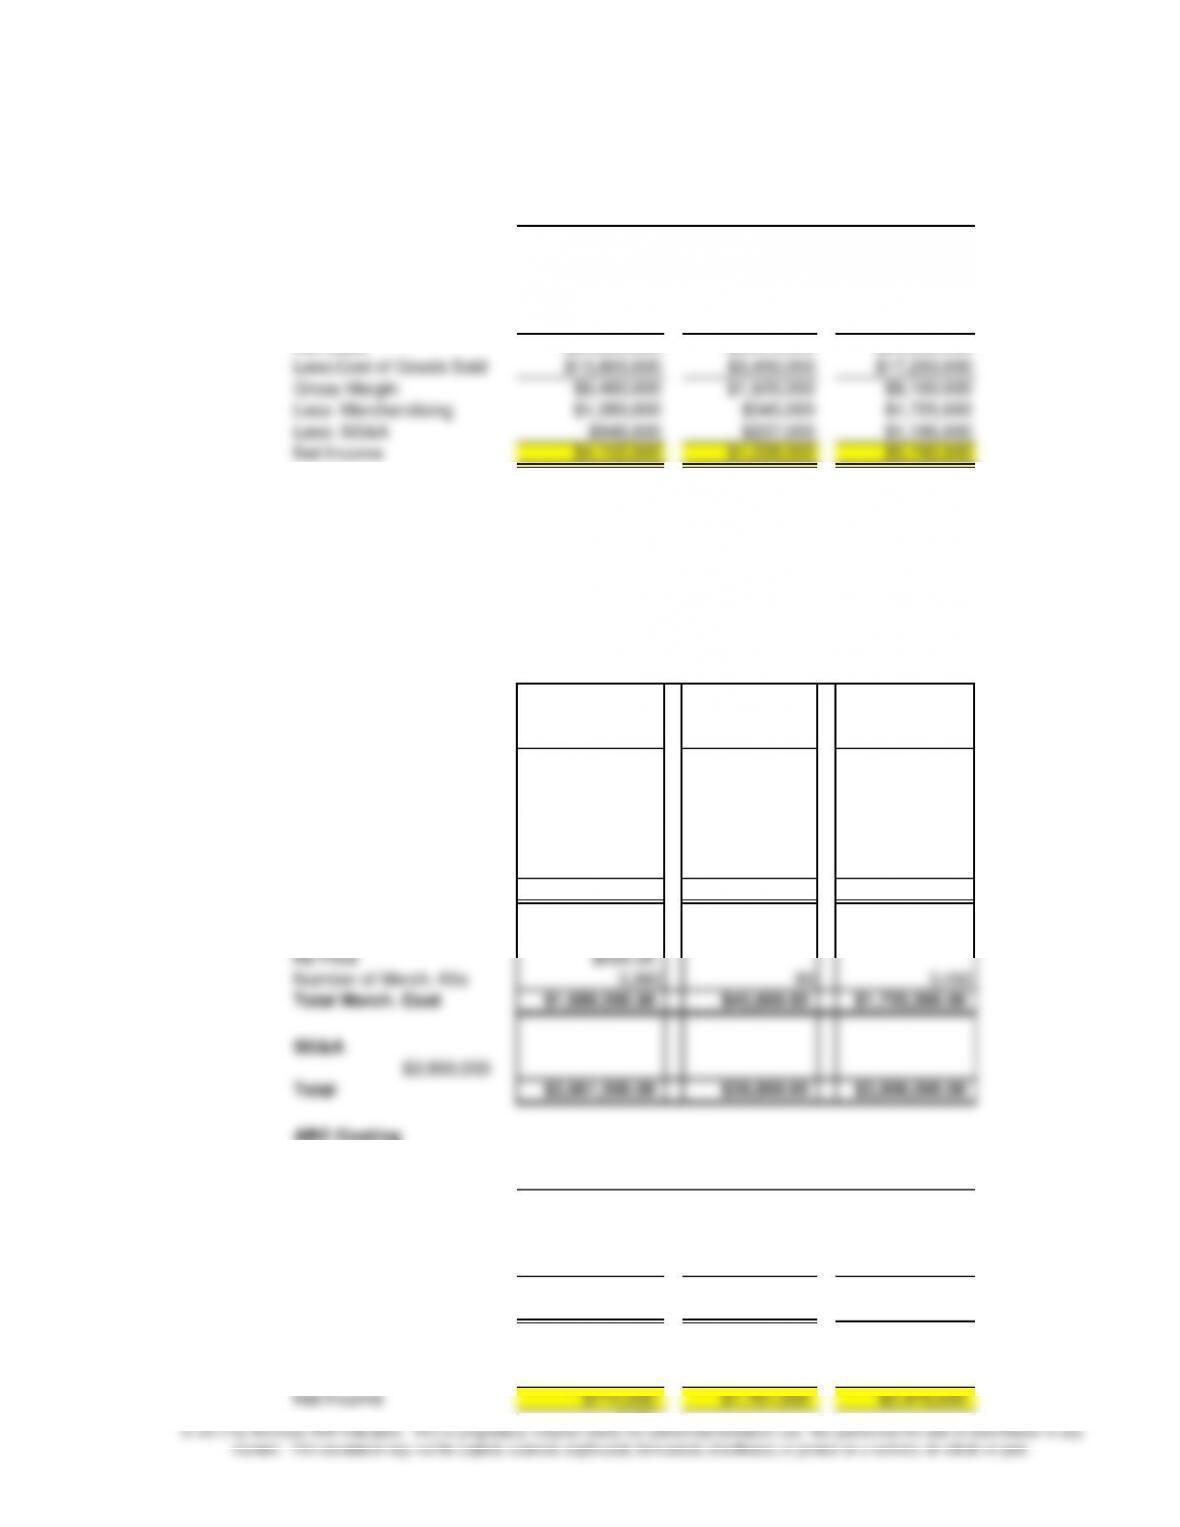
Colombo Frozen Yogurt
Pre-ABC
Impulse Yogurt
Category Segment Shops Total
Sales in Cases $1,200,000 $300,000 $1,500,000
Sales Revenue $23,880,000 $5,970,000 $29,850,000
Less: Price Promotions $3,600,000 $900,000 $4,500,000
Net Sales $20,280,000 $5,070,000 $25,350,000
Less:Cost of Goods Sold $13,800,000 $3,450,000 $17,250,000
Gross Margin $6,480,000 $1,620,000 $8,100,000
Less: Merchandising $1,380,000 $345,000 $1,725,000
Less: SG&A $948,000 $237,000 $1,185,000
Net Income $4,152,000 $1,038,000 $5,190,000
Chapter 5 – Activity-Based Costing and Customer Profitability Analysis
5-11
The following points should come out in the discussion:
▪ Segment Net income declines because SG&A allocation to segment was too low under the Sales
dollar method.
shows how to determine cost drivers for marketing costs.
3. What recommendations do you suggest based on ABC analysis?
Clearly, Shops and Impulse locations are very different in their costs and needs. Students should
recommend different approaches for Shops and Impulse.
The largest cost issue is SG & A. The discussion should cover several questions. How can you reduce
the time spent on Impulse and increase the time spent on Shops? How much time is spent on servicing
Impulse? How can you alter sales force time? Is this allocation fair? The salespeople call on the
Impulse locations for other products. What is the added cost of their time? Can we reduce the extra
Finally, Merchandising œ customers aren‘t happy. Shops want different, more elaborate support
than Impulse. Can support be tailored to shops? Shops are willing to pay for merchandising.
Impulse needs smaller, less costly, merchandising.
Price Promotions are very costly. Do they have to be available to all? Can that be changed now that
they know about them?
Chapter 5 – Activity-Based Costing and Customer Profitability Analysis
5-12
What really happened after the analysis?
The ABC analysis showed that the company was inadvertently harvesting the market in shop sales.
Given the new ABC of the two segments, General Mills went to the market with a significantly
new approach.
In the impulse segment: General Mills had devoted too much sales time and effort to this segment and
that was driven by the fact that the merchandising required too much field support. The sales people
were being turned into technical service people. General Mills simplified the merchandising and
distributed it via direct mail rather than having sales people deliver it. This simplified kit was much less
expensive than the previous kit and the budget for merchandising in this segment dropped from $1.44
started to charge for them again. The kits cost $1,000 and the accounts paid $500. These kits were
refreshed two times a year. General Mills included both recipe variations and consumer/patron
promotion tie-ins. They also eliminated the pricing promotions for this segment of the market. The big
three products were reformulated to include a strongly differentiated offering and the line was
extended to include smoothies. The shop business was removed from the incentive calculations for the
rest of the field sales force and they were told that they were not responsible for the shop business.
While the shop changes would decrease shop profitability in the plan year, General Mills expected to
halt volume declines and possibly increase volume with the new offerings.
Brooks, R. 1999. Unequal treatment: Alienating customers isn’t always a bad idea, many firms discover. Wall Street
Journal (January 7): A1.
Cooper, R. 1987. Does your company need a new cost system? Journal of Cost Management (Spring): 45–49.
———, and R. Kaplan. 1992. Activity-based systems: Measuring the costs of resource usage. Accounting Horizons
6 (3): 1–13.
Horngren, C., G. Foster, and S. Datar. 1999. Cost Accounting: A Managerial Emphasis. Upper Saddle River, NJ:
Prentice Hall.
Kaplan, R., and R. Cooper. 1997. Using Activity-based Costing with Budgeted Expenses and Practical Capacity.
Harvard Business School Case 9-197-083. Boston MA: HBS Press.
Platt, D., and K. Towry. 2001. Pecos products: A project introducing complexity into the study of activity-based
costing. Issues in Accounting Education (February): 99–124.
Tabor, R. H., and S. D. Stanwick. 1996. Instructional case: Griffen textile company. The Accounting Educators’
Journal (Fall): 122–145.
U.S. Bureau of the Census. 1999. Statistical Abstracts of the U.S. 1999. Washington, D.C.: Government Printing
Office.
Wisner, P. S., and H. P. Roth. 1998. Metalworks company. Issues in Accounting Education (November): 1043–
1057.

Chapter 5 – Activity-Based Costing and Customer Profitability Analysis
5-13
5-3 Alternative Costing Methods: Precision Paint Shop’s Dilemma
Synopsis and guidelines for instruction
Precision Paint Shop is a privately held custom painter of automotive components. Raw metal
parts are received on consignment from the customer, finished with the desired application(s) of paint,
and shipped back to the same customer. The product lines consist of a large number of combinations of
various types of coating, paint finishes, and paint colors. The company had recently implemented an
of capacity constraints, and different types of decisions that cost information can support.
The entire case can be covered in one 60-75 minute class session, and can be used in an
undergraduate cost accounting course, in an introductory management accounting course at the MBA
level, or a cost analysis course in an MBA or MSA curriculum. Time constraints during a semester and
the requisite level of background knowledge probably make this case inappropriate for an introductory
managerial accounting course at the undergraduate level.
Objectives:
The value of cost information comes from how management uses it, and the effective use of
costing information is strategically important to an organization. This case is designed to help students:
• Understand strategic cost analysis and the role of costing systems in support of strategic decision
manage the demands on a constraint to help improve the chances of survival and success.
Required Questions (from case competition)
1. Distinguish between traditional cost analysis and strategic cost analysis.
2. Management of PPS used activity-based-costing (ABC) to obtain a better understanding the “true” cost
of the products to help make better pricing decisions. Management now wants to be more proactive in the
use of costing information to help develop and implement organizational strategy in an environment
where the demand exceeds current productive capacity. The company has an ABC system, but
throughput costing based on Theory of Constraints (TOC) and Resource Consumption Accounting (RCA)
have been offered as alternatives. Discuss the potential strategic value of the ABC versus TOC versus
RCA cost information in making strategic decisions in such a capacity constrained environment.
Suggested solution
1. Distinguish between cost analysis and strategic cost analysis.
While traditional cost analysis has been viewed as a process of assessing the financial impact of
alternative managerial decisions, strategic cost analysis (SCA) is a process of developing cost information
that aids managers in making strategic choices. The primary utility of a strategic cost system is that it can
Chapter 5 – Activity-Based Costing and Customer Profitability Analysis
5-14
provide valuable insights of the firm’s operations and be used to help formulate or assess overall business
strategies. The utility of a strategic cost system can be realized by understanding more of how it is
applied.
Conventional management accounting analysis, which is also called “value added analysis”,
primarily focuses on activities within a firm itself in attempting to maximize the difference (value added)
characteristics that relate to strategy and drive the activities of the organization. Identification of cost
drivers that vary with different strategies is important, otherwise the strategic costing process will not
provide information that allows managers to differentiate the cost of alternative strategies. SCA is most
valuable when resource consumption varies with alternatives, and the costs are material in amount. Most
significant is that SCA takes a long term view of the organization and should look beyond
manufacturing/production costs.
SCA looks at two types of cost drivers – structural and executional. Structural components relate
to the scale and scope and technology of the production environment. Such decisions involve capital
equipment investment, hiring of employees of certain skill levels and pay rates, etc. Structural drivers can
• A basic part of SCA is to identify output characteristics that relate to strategy and that drive
the activities of the organization. Identifying cost drivers that vary with different strategies
allows managers to differentiate the cost of alternative strategies. However, managers must
be willing to use this new information in their decision making.
The concepts involved in strategic cost analysis are not new, but the utility of applying this
approach has been furthered by:
1. Increased complexity in manufacturing/production processes (e.g. flexible manufacturing cells, JIT,
TQM) and expanded product lines increase the difficulty of tracing costs to specific product-related
activities. The concentration of efforts and/or costs in some of these activities introduced a significant
competitive arsenal.
Chapter 5 – Activity-Based Costing and Customer Profitability Analysis
5-15
SUMMARY OF KEYS POINTS FOR QUESTION 1
• Traditional cost analysis
o viewed as a process of assessing the financial impact of alternative managerial decisions
o primarily focuses on activities within a firm itself in attempting to maximize the difference
characteristics that relate to strategy and drive the activities of the organization.
o takes a long term view of the organization and should look beyond manufacturing/production
costs.
SCA looks at two types of cost drivers
components.
2. Management of PPS used ABC to obtain a better understanding the “true” cost of the products
to help make better pricing decisions. Management now wants to be more proactive in the use of
costing information to help develop and implement organizational strategy in an environment
where the demand exceeds current productive capacity. The company has an ABC system, but
throughput costing based on Theory of Constraints (TOC) and Resource Consumption Accounting
(RCA) have been offered as alternatives. Discuss the potential strategic value of the ABC versus
TOC versus RCA cost information in making strategic decisions in such a capacity constrained
environment.
In “Finding the Right Mix”, Krumwiede and Charles (Strategic Finance, April 2006) report on the
a survey that matched management practices to firm strategy and concluded that no management practice
is equally suitable to every organizational strategy. The same could be said for TOC, ABC, and RCA.
That being said, one way to address strategic value is to first understand the focus or emphasis of these
possibility is to hire temporary workers, but there is already idle labor, so temporary workers will not help
solve their problem. Outsourcing some of the work is not an option since the physical painting would
have to be outsourced to another paint vendor, which would simply support a competitor.
A key point is that effective capacity utilization requires both a short-term and long-term strategic
focus. In the short run, the goal is to make optimal use of the resources currently available, so
management may take the short-term view of maximizing use of constraints on a continuous basis. TOC
is a way to accomplish this objective by matching the use of the firm’s resources with market
opportunities, but a strictly short-run view of capacity utilization could be a problem.