Chapter 4 – Job Costing
4-42
4-49 (continued –5)
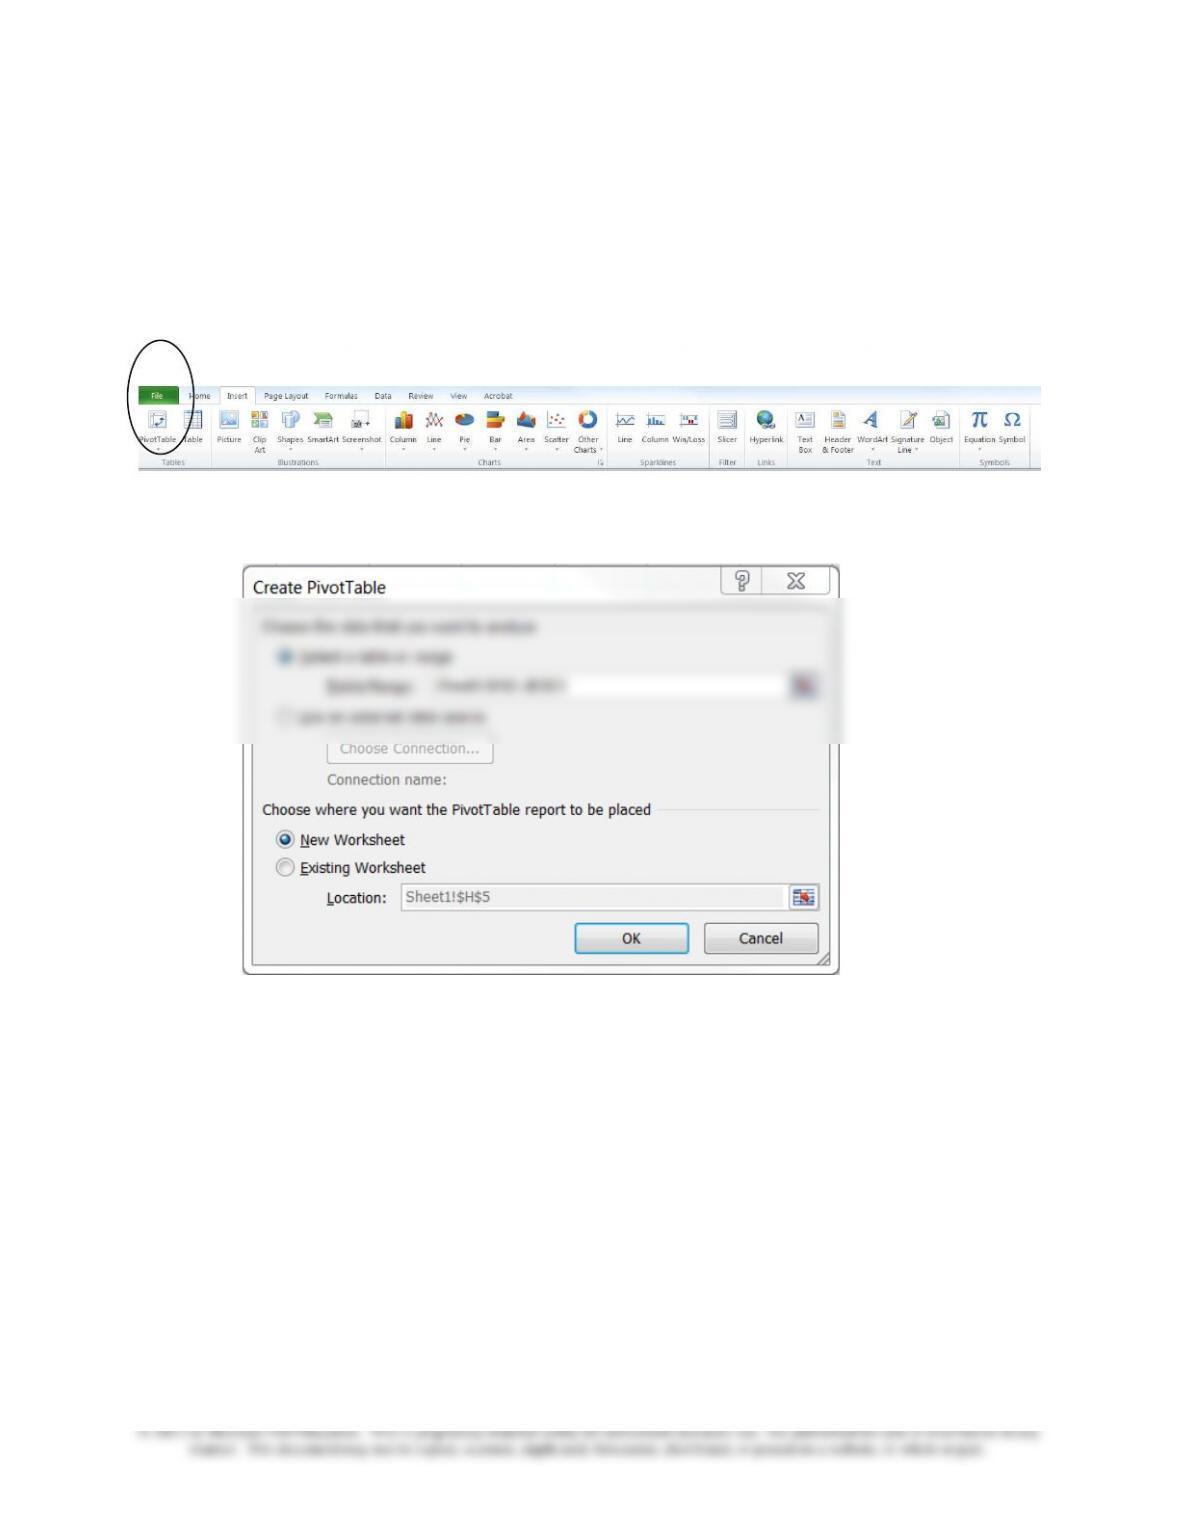
2. Go to the Insert tab on the ribbon, and select the PivotTable
button. You can choose Pivot Table or Pivot Chart; choose Pivot
Table.
3. Once you have selected PivotTable a new screen will pop-up.
Select your data on the sheet, and check that you would like the
pivot table to be created in a new sheet as seen below
4. Now you can click OK.
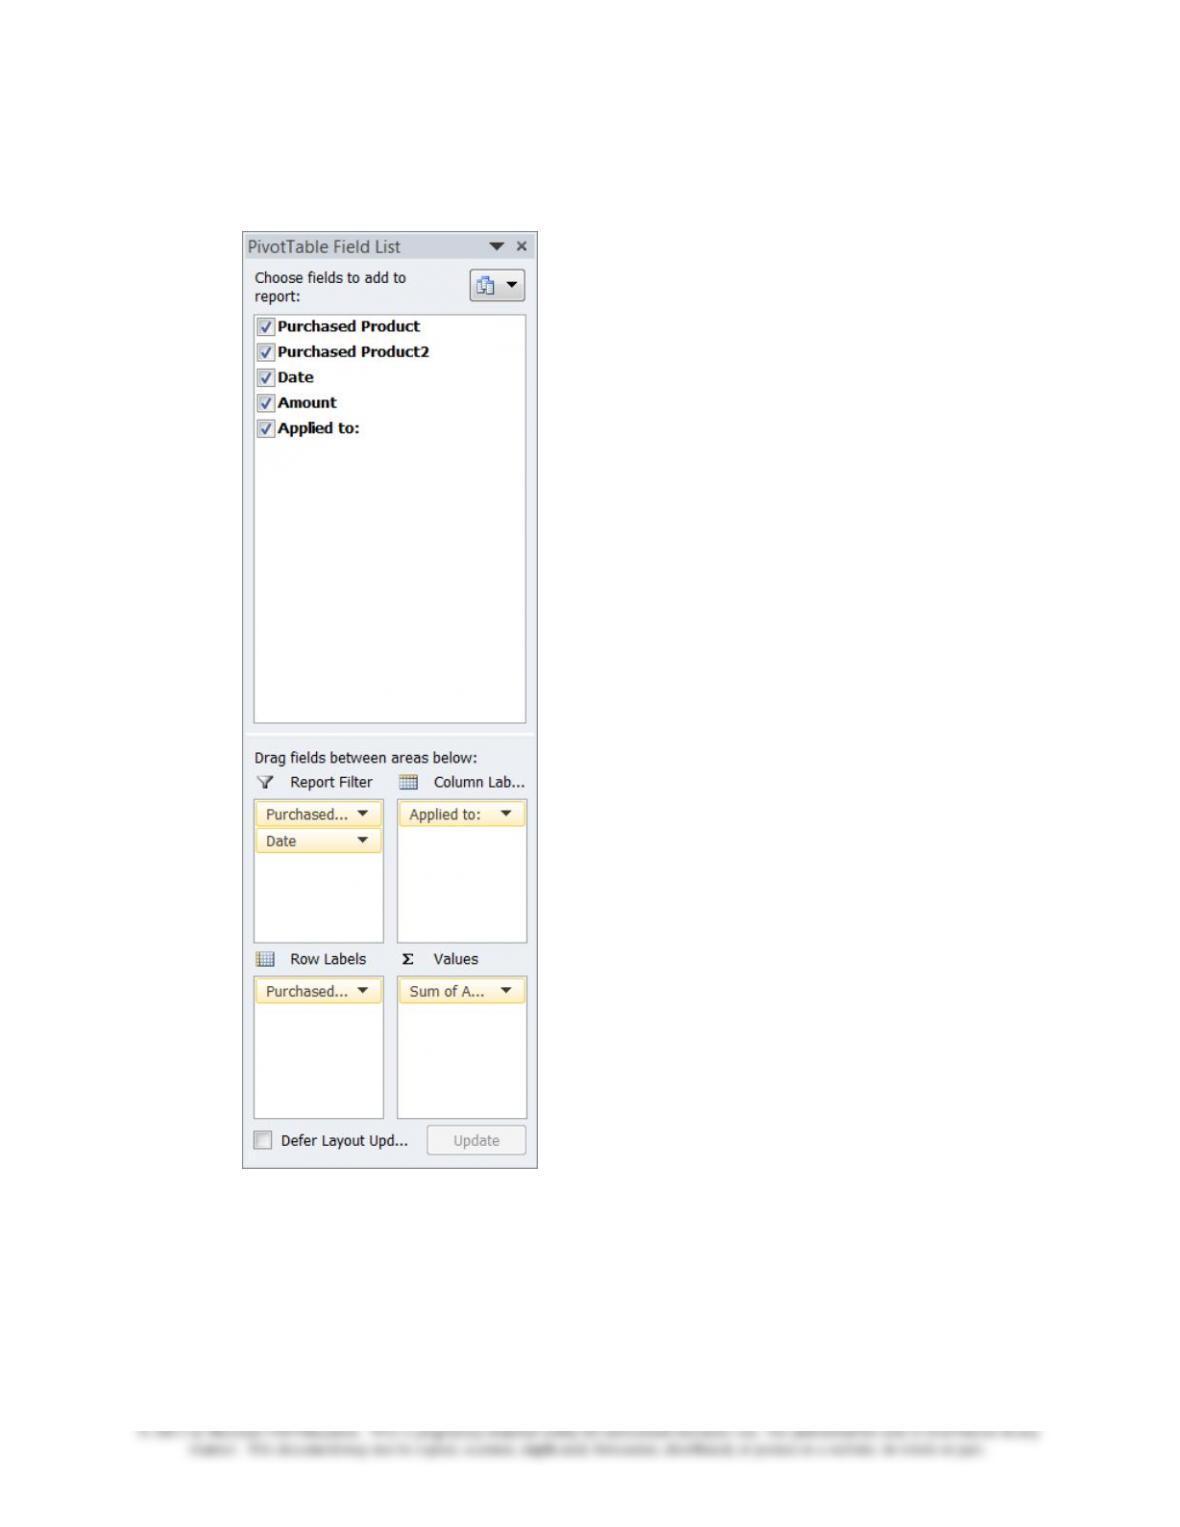
5. As you can see, your pivot table is shown within a new sheet, and
now a new box has opened on the right side of your screen. This
box allows you to modify the data within Excel. The lists shown in
the Fields box are the headers of your data columns in the “Data”
sheet. You should now select the field names, and drag them into
the boxes below. For a detailed example see the screen capture
on the following page:
Chapter 4 – Job Costing
4-43
4-49 (continued –6)
Chapter 4 – Job Costing
4-44
4-49 (continued -7)
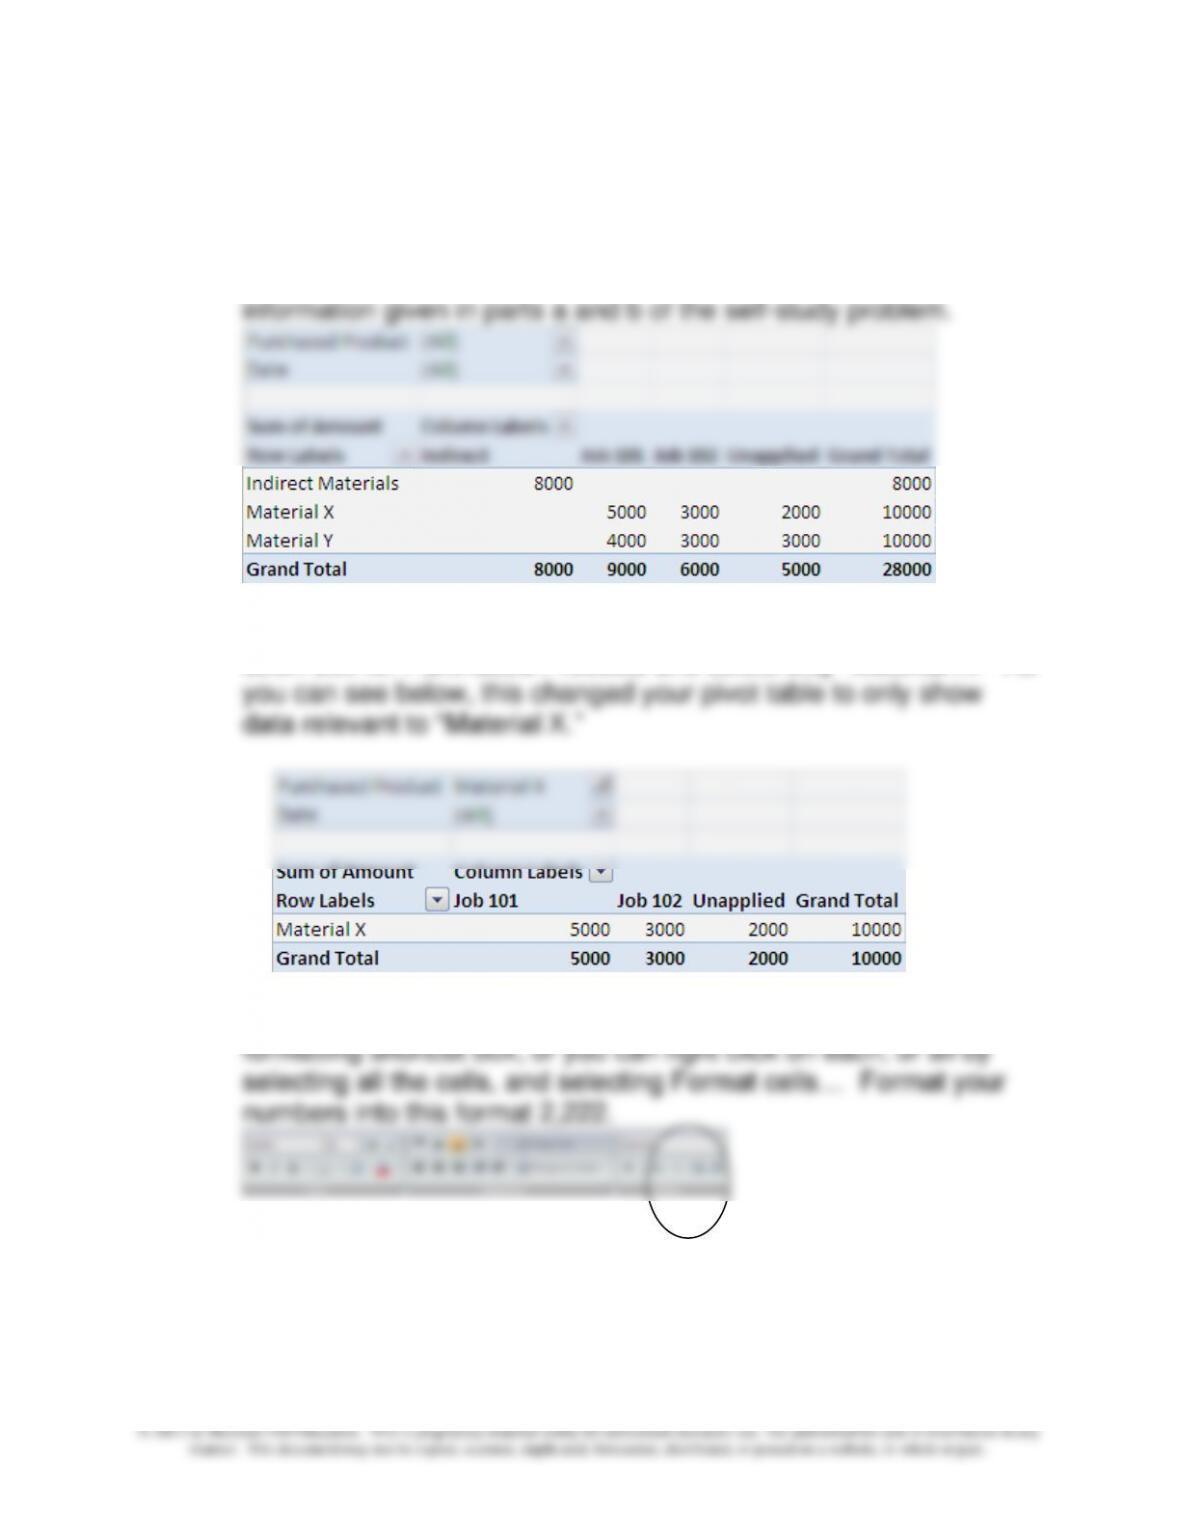
6. When you look at the pivot table you can see that it has summed
up left-to-right, and top-to-bottom. This data is the same as the
7. The drop-down boxes within the pivot table allow you to modify
what data will be shown within the pivot table. Select the drop-
down box for Purchased Products and select only “Material X.” As
8. To change the format of the data within the pivot table is the same
as changing the data of a normal cell. You can select from the
Chapter 4 – Job Costing
4-45
4-49 (continued -8)
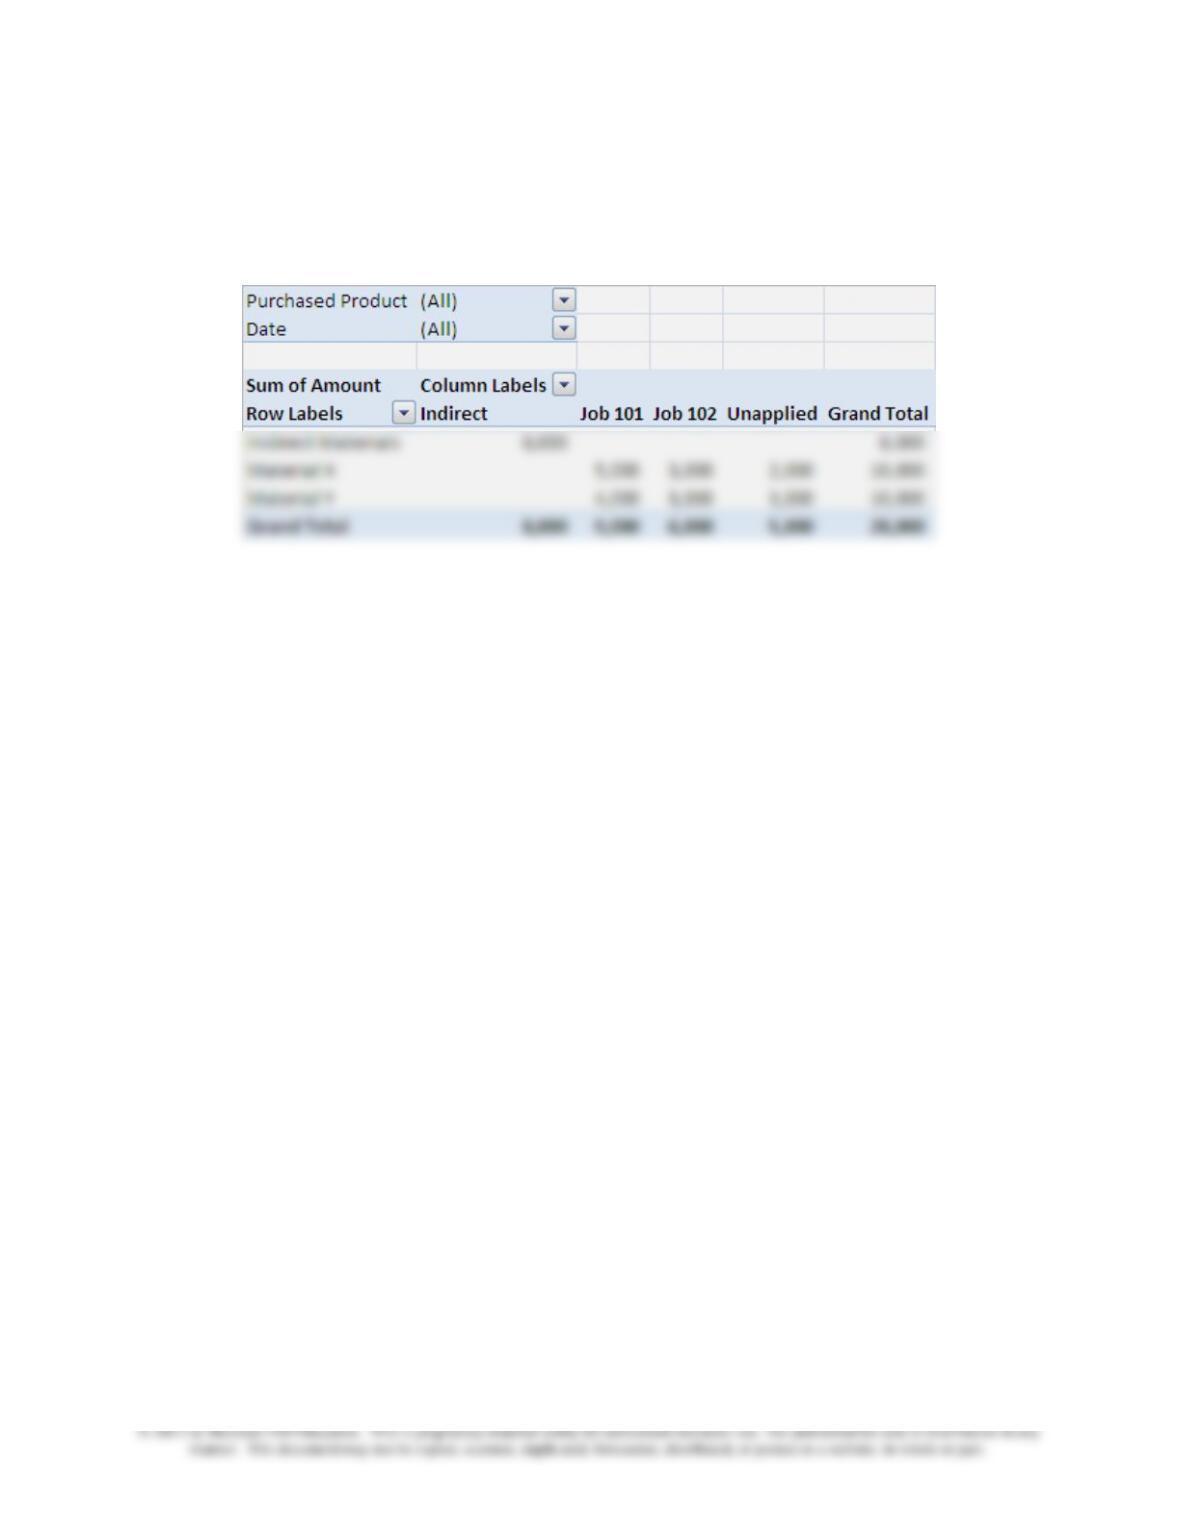
9. Your final result should look like the pivot table below:
For an explanation of a free Microsoft Add-in that enhances the
capabilities of pivot tables, see Jeff Lenning, “Pivotal Advance
Boosts Excel’s Power,” Journal of Accountancy, September 2011, pp
40–44.
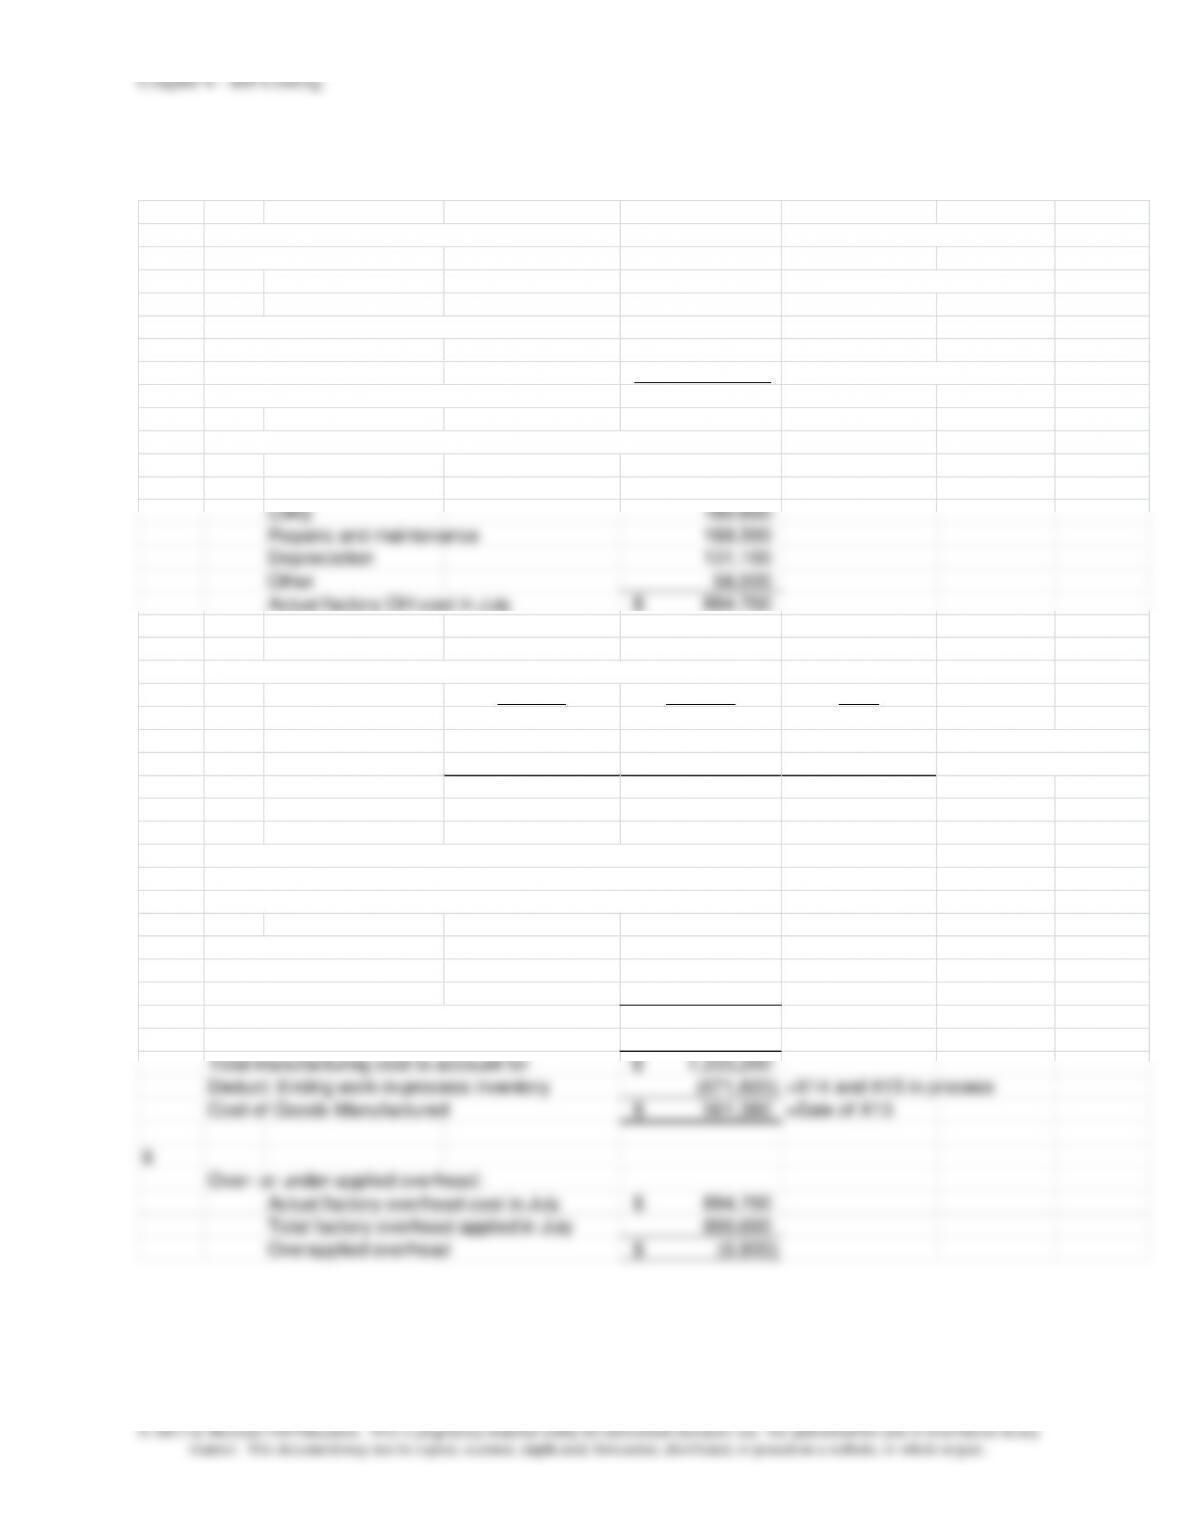
4-50 Overhead Application (40 min)
1
Total Direct Labor cost incurred for for July 237,000$ =(3,500+2,800+1,600) x $30
OH applied in July 900,600$
OH Application Rate 380.00% =$900,600/237,000
2 Beginning Direct Materials Inventory 36,500$
+Purchases in July 55,000
-Materiasl used in July 54,600
=16,380+24,200+14,000
=Ending Balanced in Materials Inventory 36,900$
3
Actual factory overhead cost incurred during the month of July:
Indirect labor 207,000$ =6,900x$30
Rent 131,500
Utility 180,600
Repairs and maintenance 188,500
Depreciation 131,100
Other 56,000
Actual factory OH cost in July 894,700$
4
Ending balance of work in process inventory account
Job X14 Job X15 Total
DM 24,220$ 14,000$ 38,220$
DL 84,000 48,000 132,000 =2,800x$30 + 1,600x$30
Applied overhead 319,200 182,400 501,600 =84,000x3.8 + 48,000x3.8
Direct materials used 54,600$
Direct labor 237,000
Factory overhead applied 900,600
Total current manufacturing costs 1,192,200$
Add: Beginning work-in-process inventory 41,000
Total manufacturing cost to account for 1,233,200$
Deduct: Ending work-in–process inventory (671,820) =X14 and X15 in process
Cost of Goods Manufactured 561,380$ =Sale of X13
6
Over- or under-applied overhead:
Actual factory overhead cost in July 894,700$
Total factory overhead applied in July 900,600
Overapplied overhead (5,900)$
Statement of Cost of Goods Manufactured
For the Month Ended July 31
Chapter 4 – Job Costing
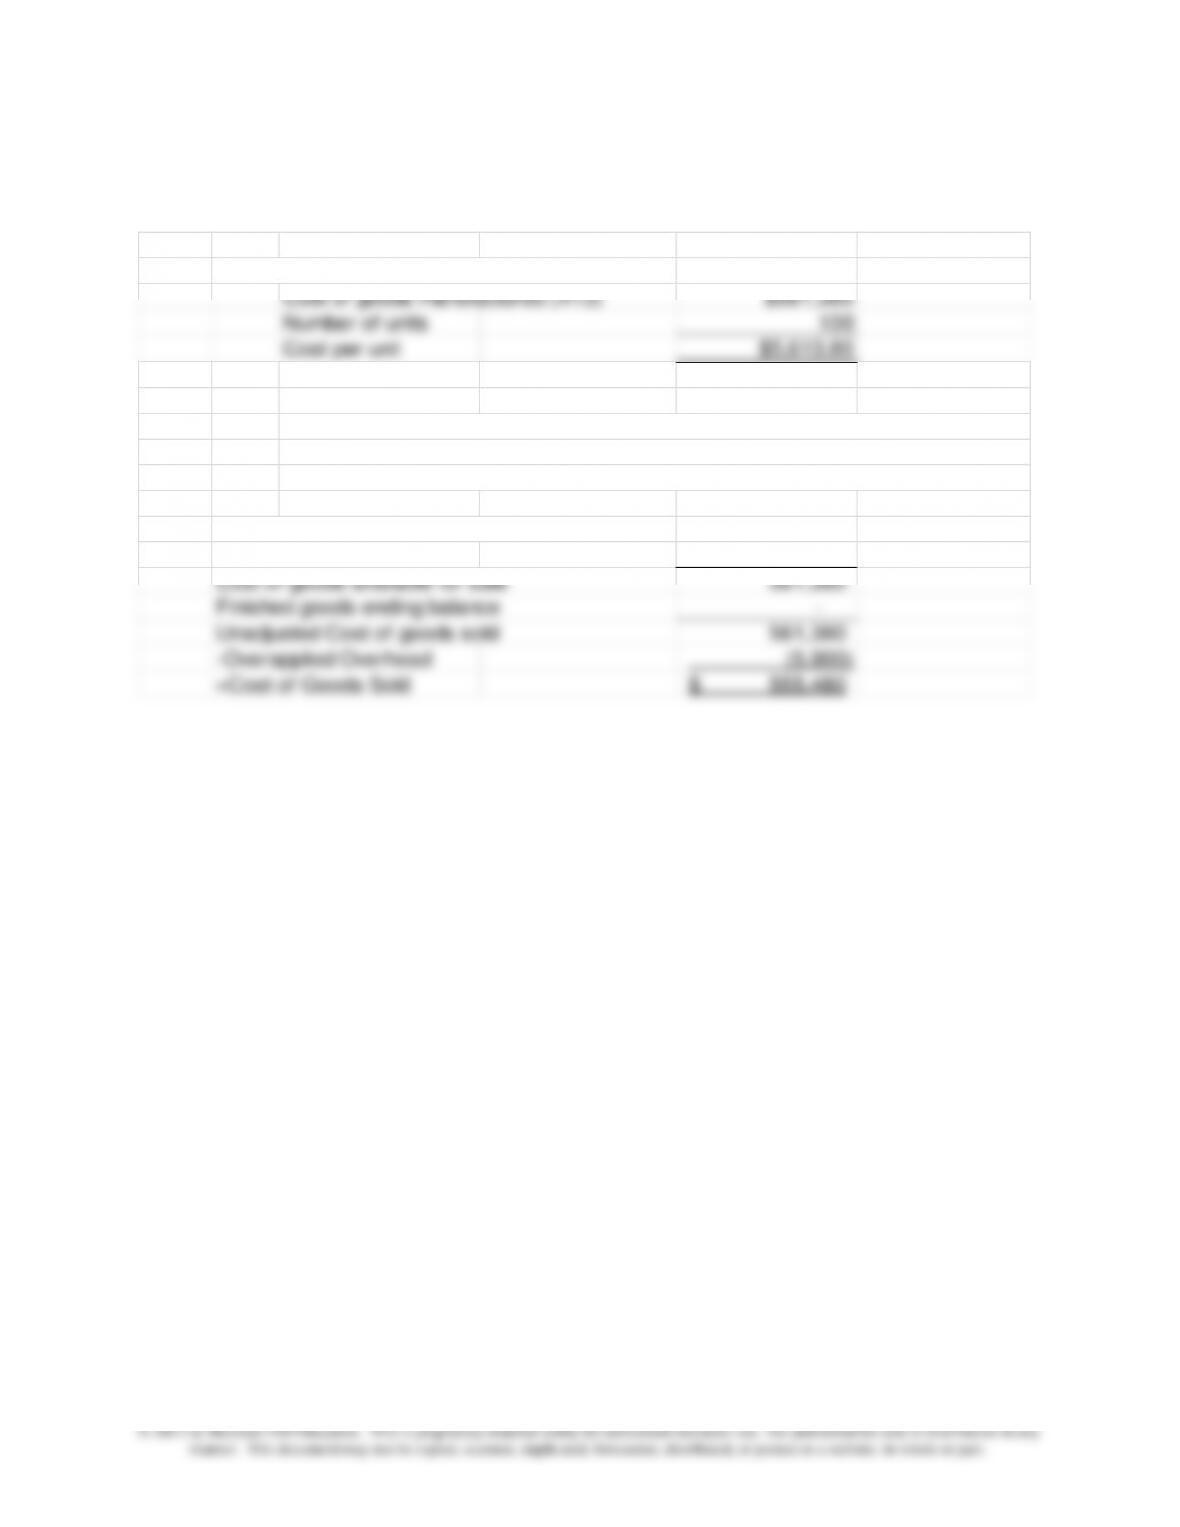
4-50 (continued –1)
7
Cost per unit in Job X13 (100 units):
Cost of goods manufactured (X13) $561,380
Number of units 100
Cost per unit $5,613.80
8
Finished goods beginning balance –$
Cost of goods manufactured
561,380
Cost of goods available for sale 561,380
Finished goods ending balance –
Unadjusted Cost of goods sold 561,380
-Overapplied Overhead (5,900)
=Cost of Goods Sold 555,480$
For the Month Ended July 31
Haughton Company
Statement of Cost of Goods Sold
4-48
© 2013 by McGraw-Hill Education. This is proprietary material solely for authorized instructor use. Not authorized for sale or distribution in any
manner. This document may not be copied, scanned, duplicated, forwarded, distributed, or posted on a website, in whole or part.
4-51 Assigning Overhead to Jobs; Ethics (20 min)
The management accountant should keep the Institute of Management
Accountants’ Statement of Ethical Professional Practice in mind. First, he
or she should try to persuade other pilot project members and the company
controller to strongly recommend that top management adopt the more
accurate departmental overhead rate method. If the company top
management does not comply, the management accountant should report
the situation to the company’s audit committee.
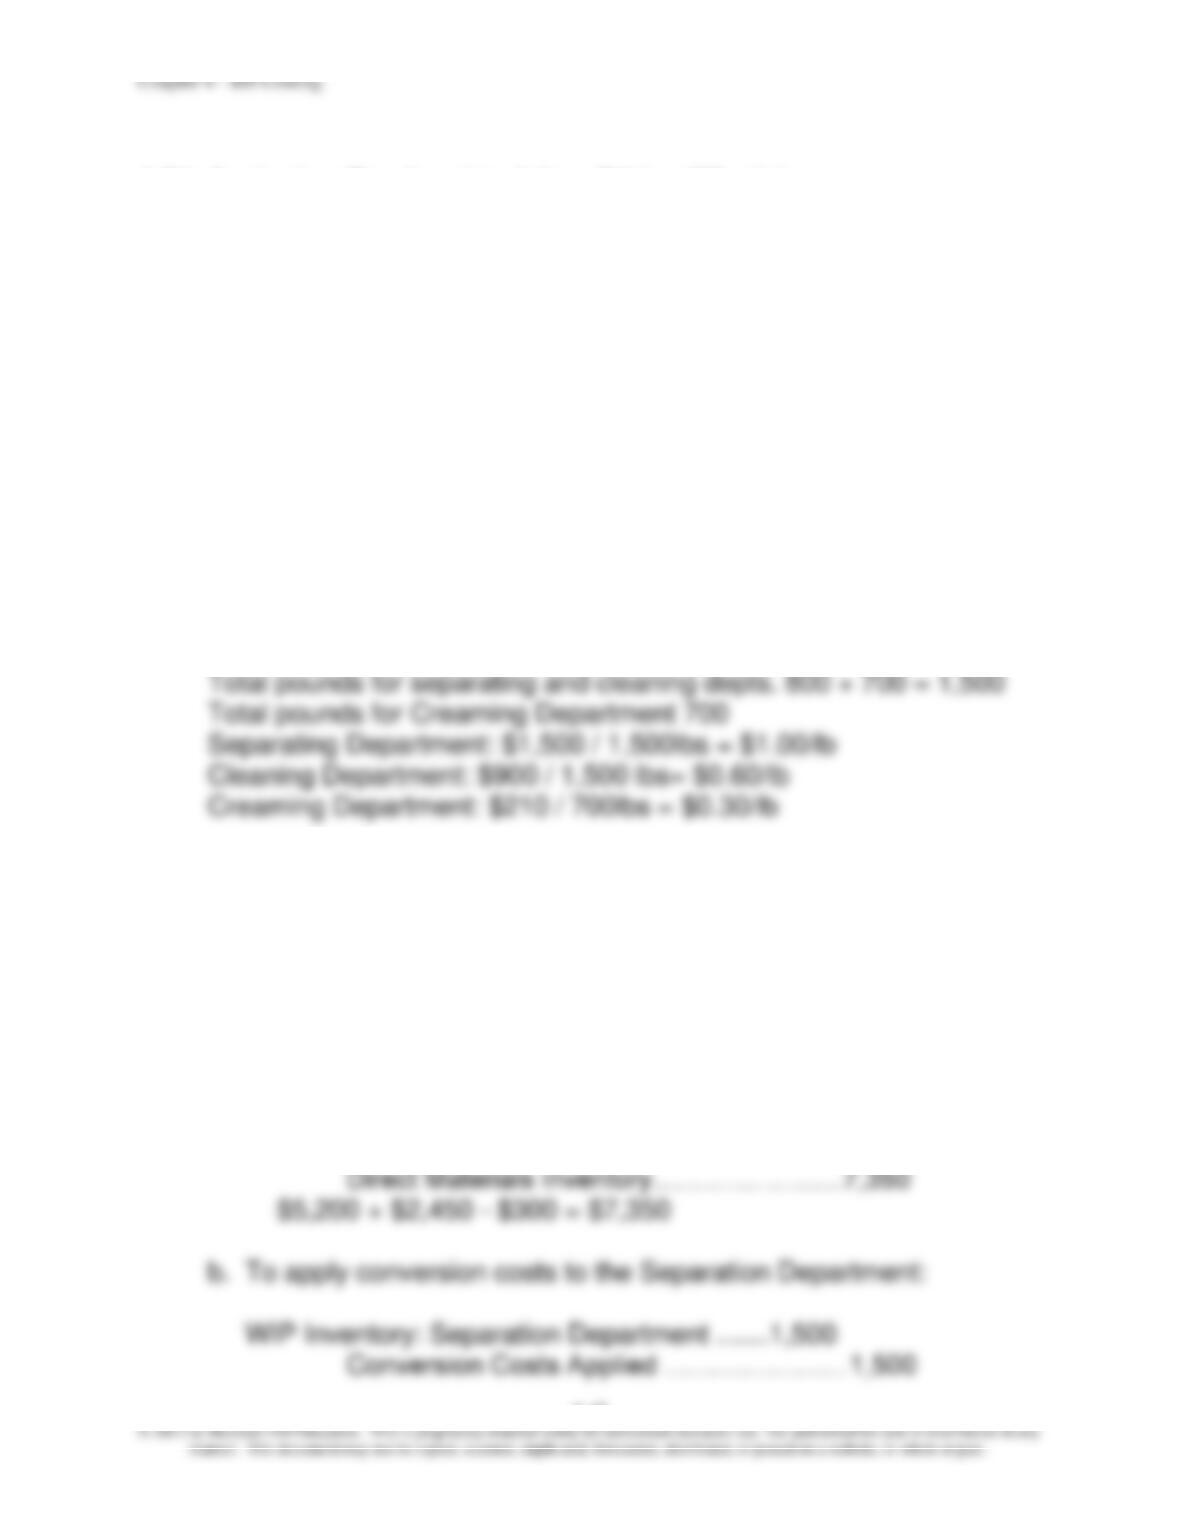
4-52 Operation Costing(30 Min)
1. Cost per pound:
Raw Sweet Corn: $5,200 / 800 lbs= $6.50/lb
Raw Regular Corn: $2,450 / 700 lbs= $3.50/lb
Total product cost per pound:
Sweet Corn = $6.50 + $1.00 + $0.60 = $8.10
Regular Corn = $3.50 + $1.00 + $0.60 + $0.30 = $5.40
2. Journal Entries:
a. To record the requisition of the raw corn for both types less
the cream cost:
WIP Inventory: Separation Department…….7,350
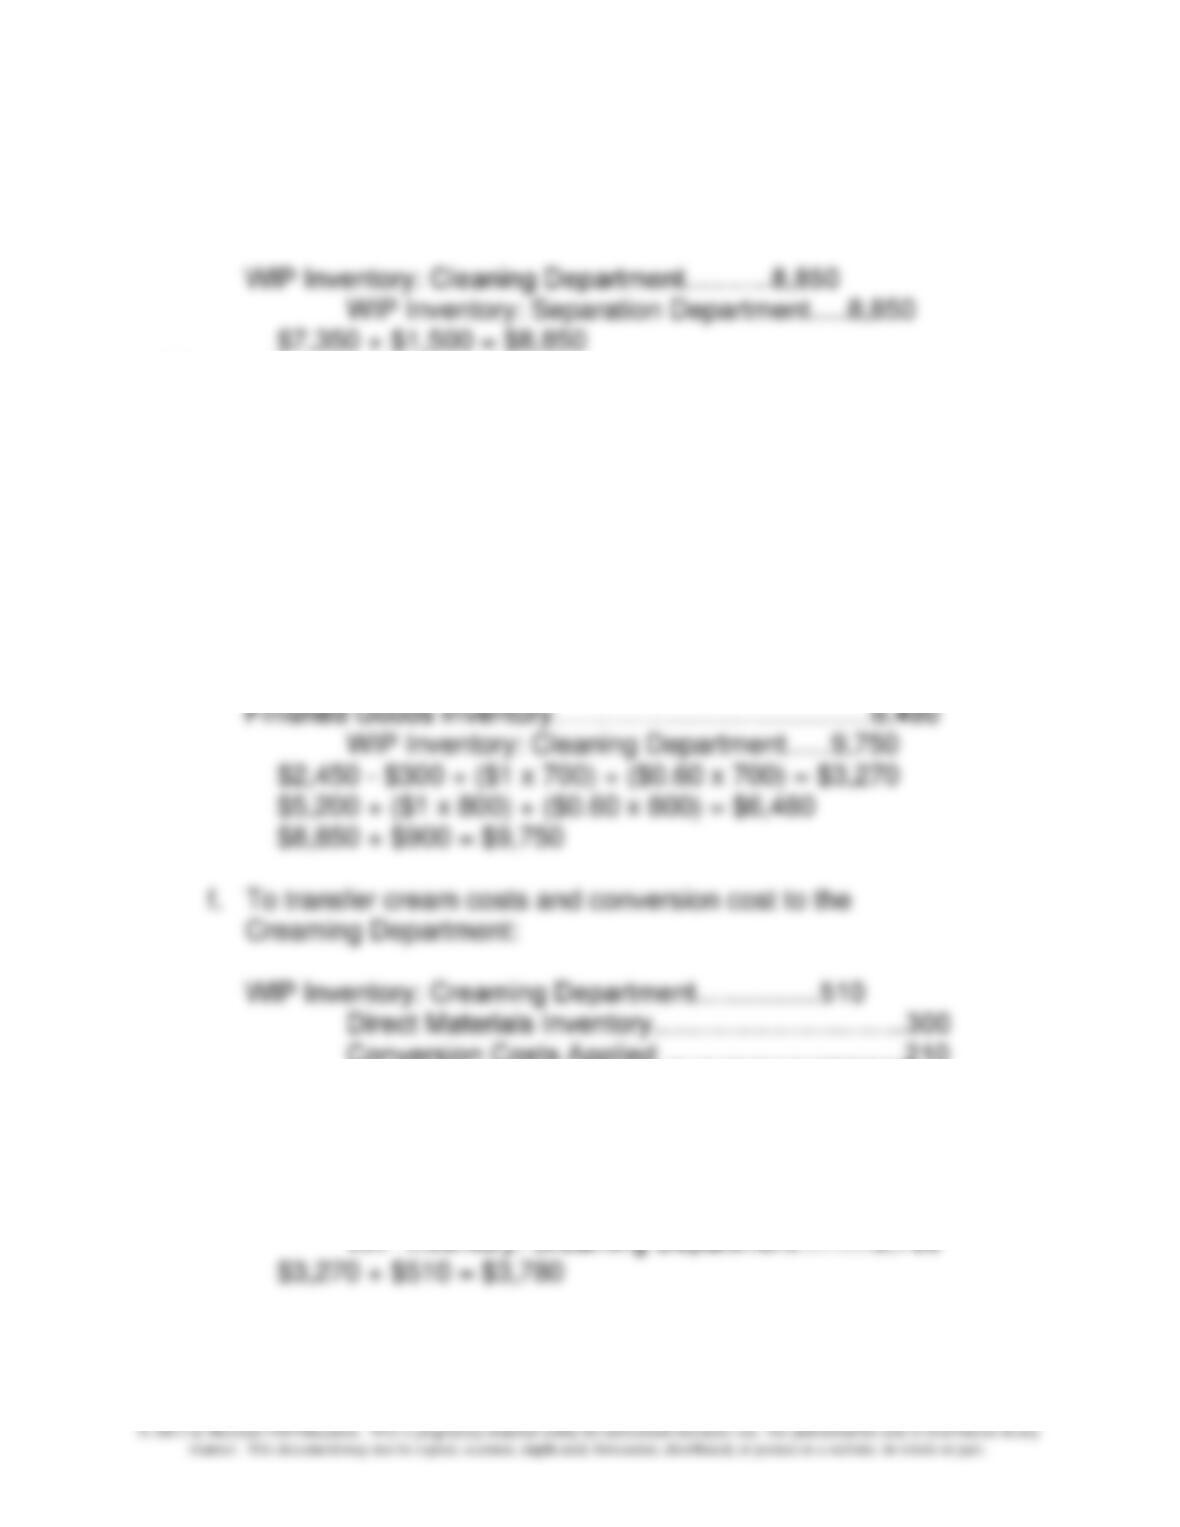
Chapter 4 – Job Costing
4-49
$1/lb x 1,500 lbs = $1,500
c. To transfer both types of corn to the Cleaning Department:
4-52 (continued –1)
d. To apply conversion cost to the Cleaning Department:
WIP Inventory: Cleaning Department………….900
Conversion Costs Applied..………….…..…. 900
$.60/lb x 1,500 lbs = $900
e. To transfer the Regular Corn to the Creaming Department
and the Sweet Corn to Finished Goods Inventory:
WIP Inventory: Creaming Department………..3,270
Conversion Costs Applied ………………..………210
$.30/lb x 700 lbs = $210
g. To transfer the Creamed Corn to Finished Goods:
Finished Goods Inventory………………………..3,780
4-50
4-53 Spoilage, Rework and Scrap (30 Min)
1. Normal spoilage is the occurrence of unacceptable units arising under
efficient operating conditions. Normal spoilage is an inherent result of
the particular process or operation and is uncontrollable in the short run.
The costs associated with normal spoilage are typically viewed as part of
the cost of the good units produced.
Abnormal spoilage is spoilage that is not expected to arise under
efficient operating conditions and is not an inherent part of the
production process. Accordingly, abnormal spoilage is usually
considered controllable and is not included as a portion of the cost of
good units produced but as an expense of the period.
2. a. Spoiled units are unacceptable units of production that are either
discarded or sold for disposal value.
completed product.
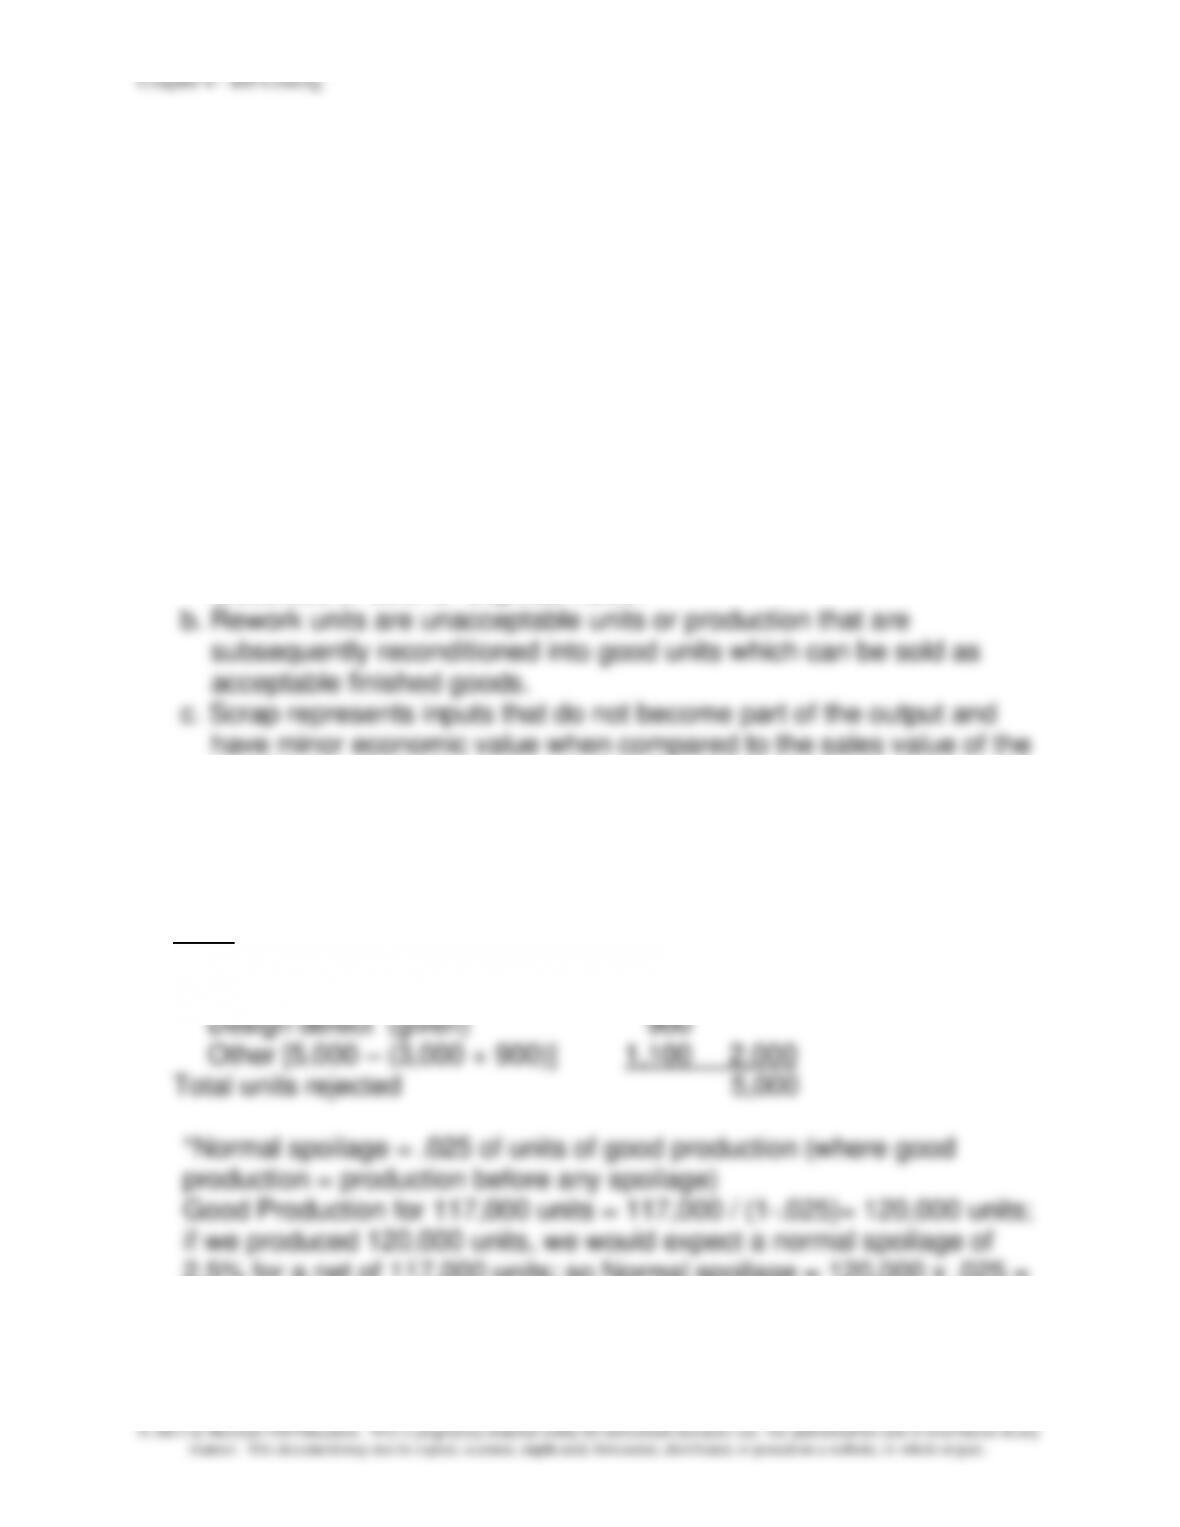
3. a. An analysis of the 5,000 units rejected by Richport Company for Job
No. N1192-122 yields the following breakdown between normal and
abnormal spoilage.
Units
Normal spoilage (see below)* 3,000
Abnormal spoilage:
2.5% for a net of 117,000 units; so Normal spoilage = 120,000 x .025 =
3,000 units, or 120,000 – 117,000 = 3,000
Chapter 4 – Job Costing
4-51
4-53 (continued –1)
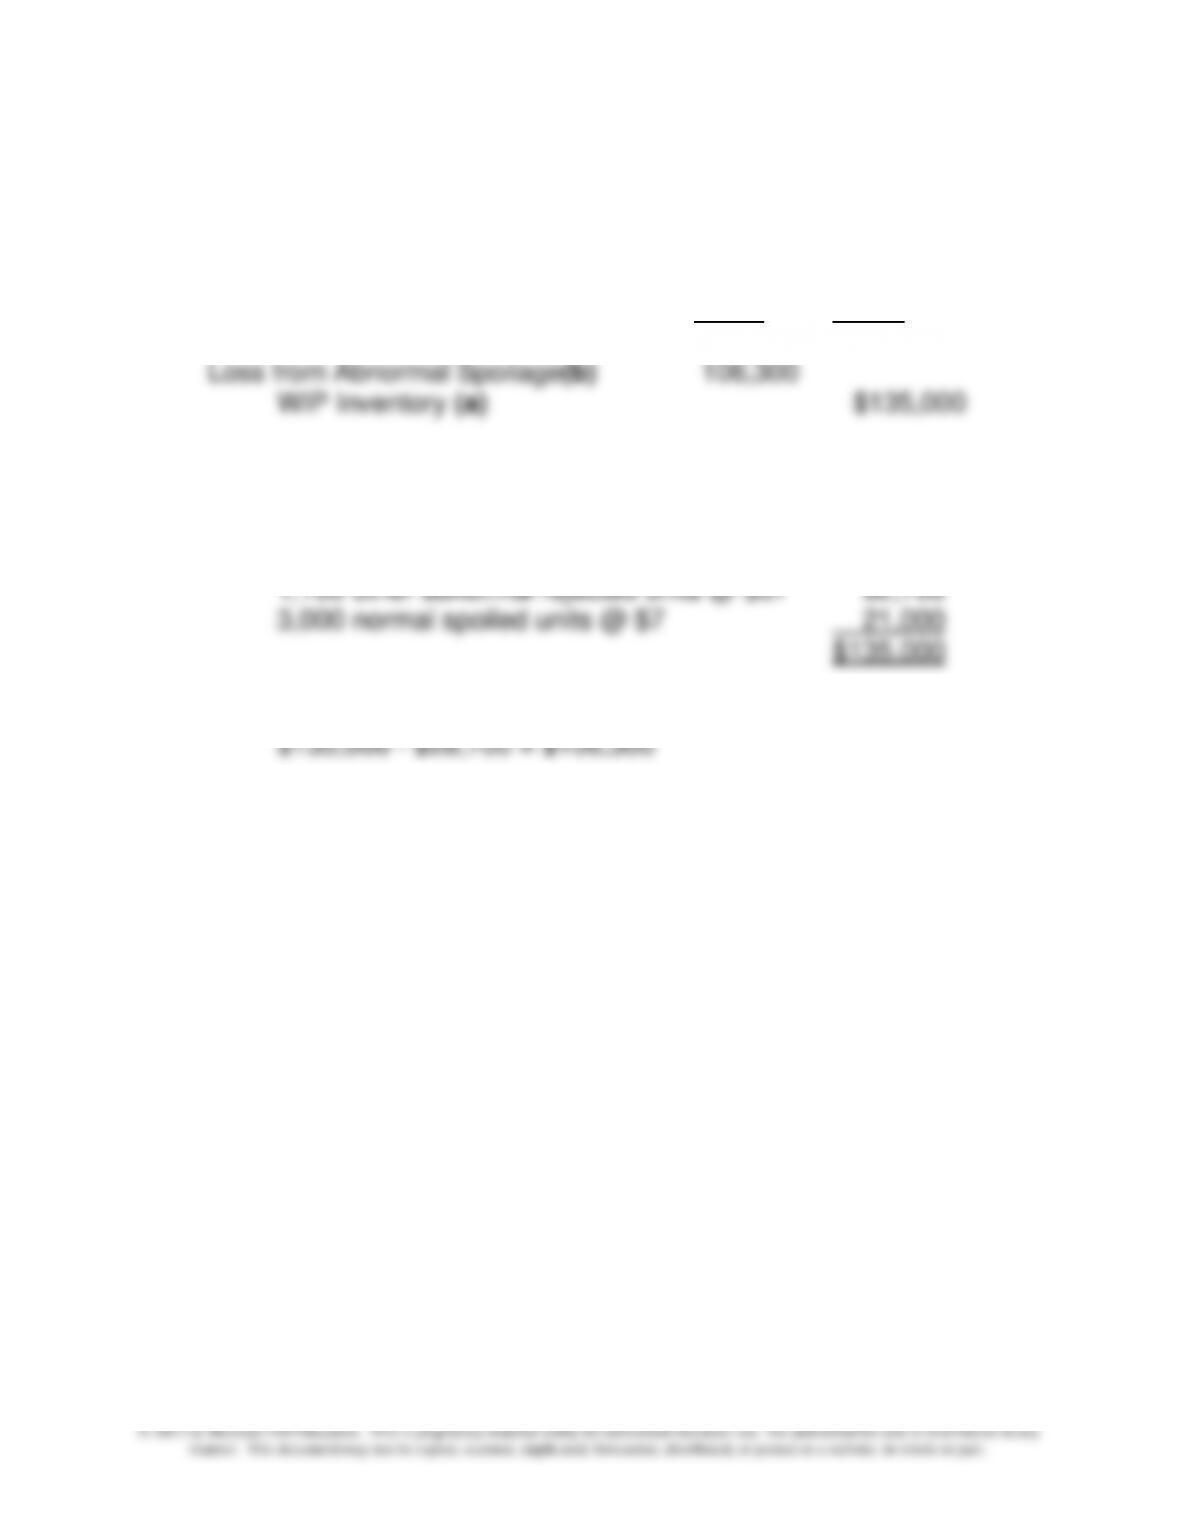
b. The journal entries required to properly account for Job No. N1192-
122 is presented below and uses an average cost per unit of $57
($6,954,000 / 122,000).
Debit Credit
Spoiled Inventory (4,100 x $7) $ 28,700
Supporting Calculations:
a)
900 abnormal spoiled units @ $57 $ 51,300
b)