Chapter 4 – Job Costing
4-31
h. Selling& Administrative Expense 2,400
Accumulated Depreciation 2,400
4-46 (Continued –1)
i. Advertising Expense 5,500
Cash 5,500
n. Accounts Receivable 132,000
Sales Revenue 132,000
Cost of Goods Sold 112,000
Finished Goods Inventory 112,000
3. Actual Overhead = $1,098 + $46,000 + $15,230 + $3,500 + $8,200
+ $13,500 = $87,528
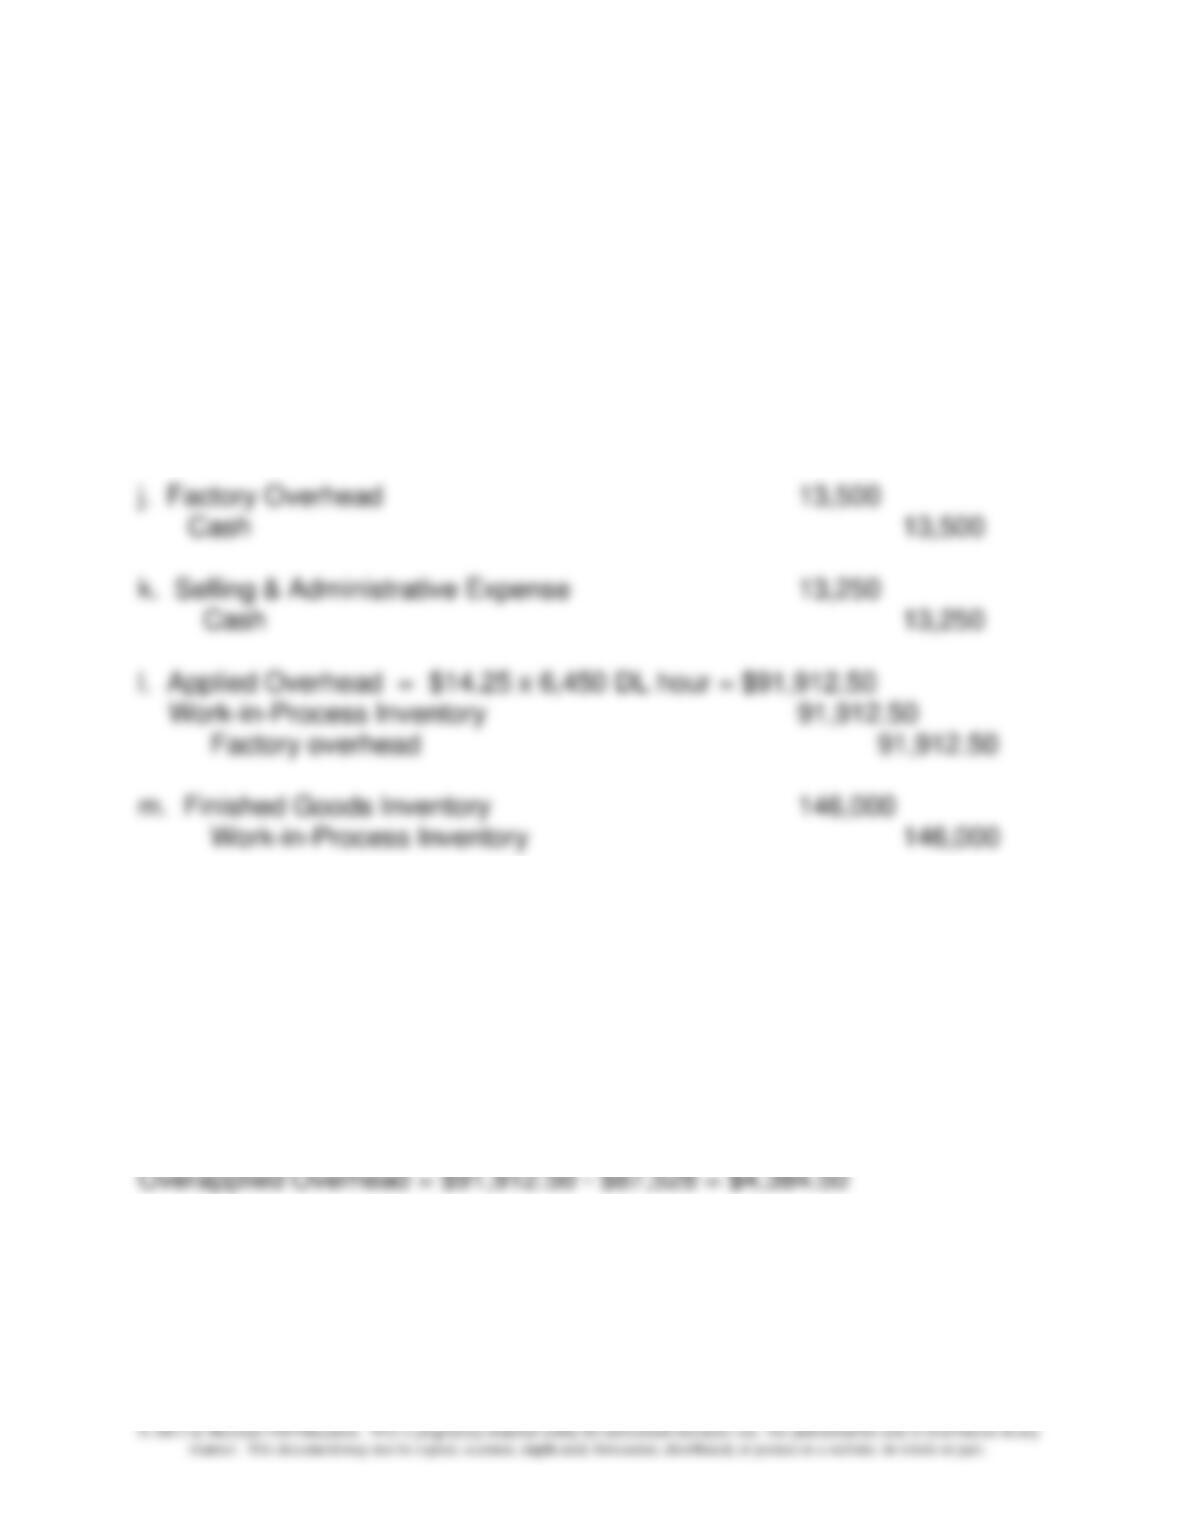
Overapplied Overhead = $91,912.50 – $87,528 = $4,384.50
Chapter 4 – Job Costing
4-32
4-46(Continued –2)
4.,5.
Data
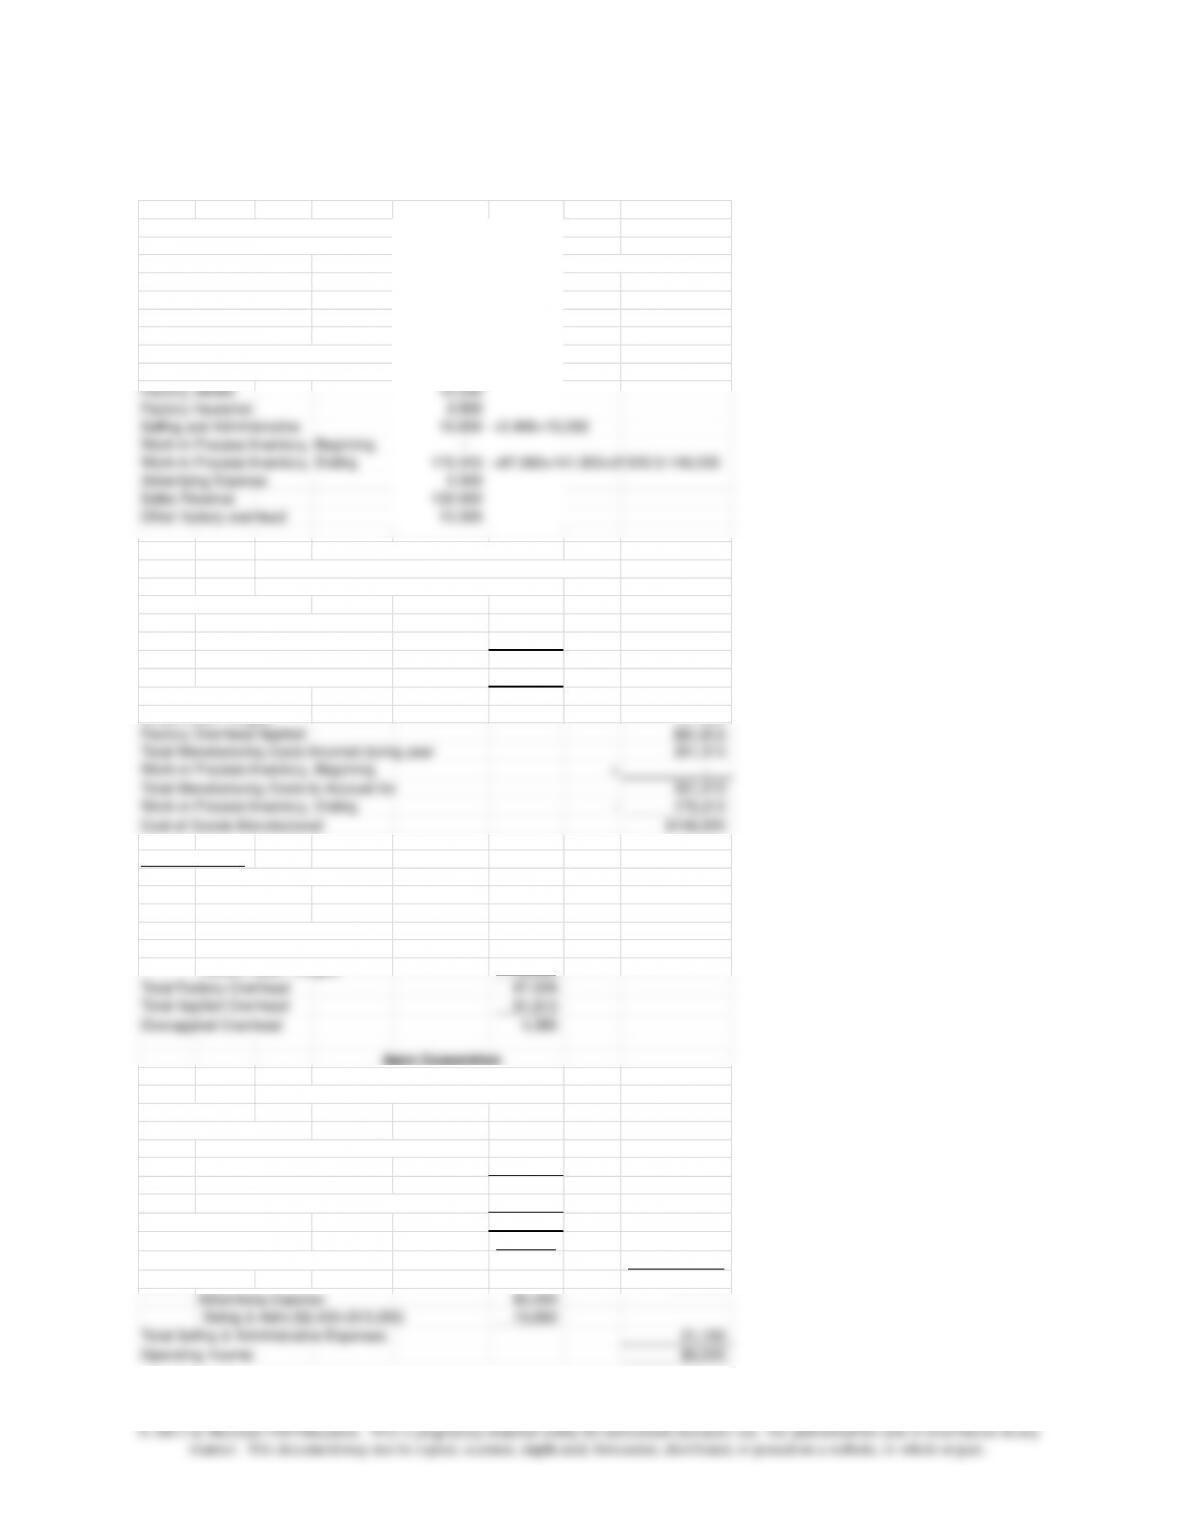
Depreciation Expense–Plant 8,200$
Materials Inventory, Beginning –
Materials Inventory, Ending
39,300 =125,000+1,800-87,500
Materials Purchases 126,800 =125,000+1,800
Indirect Materials Used 1,098
Direct Labor–Wages 141,900
Indirect Labor--Wages 46,000
Finished Goods Inventory, Beginning –
Finished Goods Inventory, Ending 34,000 =146,000-112,000
Factory utilities 15,230
Factory insurance 3,500
Selling and Administrative 15,650 =2,400+13,250
Work-in–Process Inventory, Beginning –
Work-in–Process Inventory, Ending 175,313 =87,500+141,900+91912.5-146,000
Advertising Expense 5,500
Sales Revenue 132,000
Other factory overhead 13,500
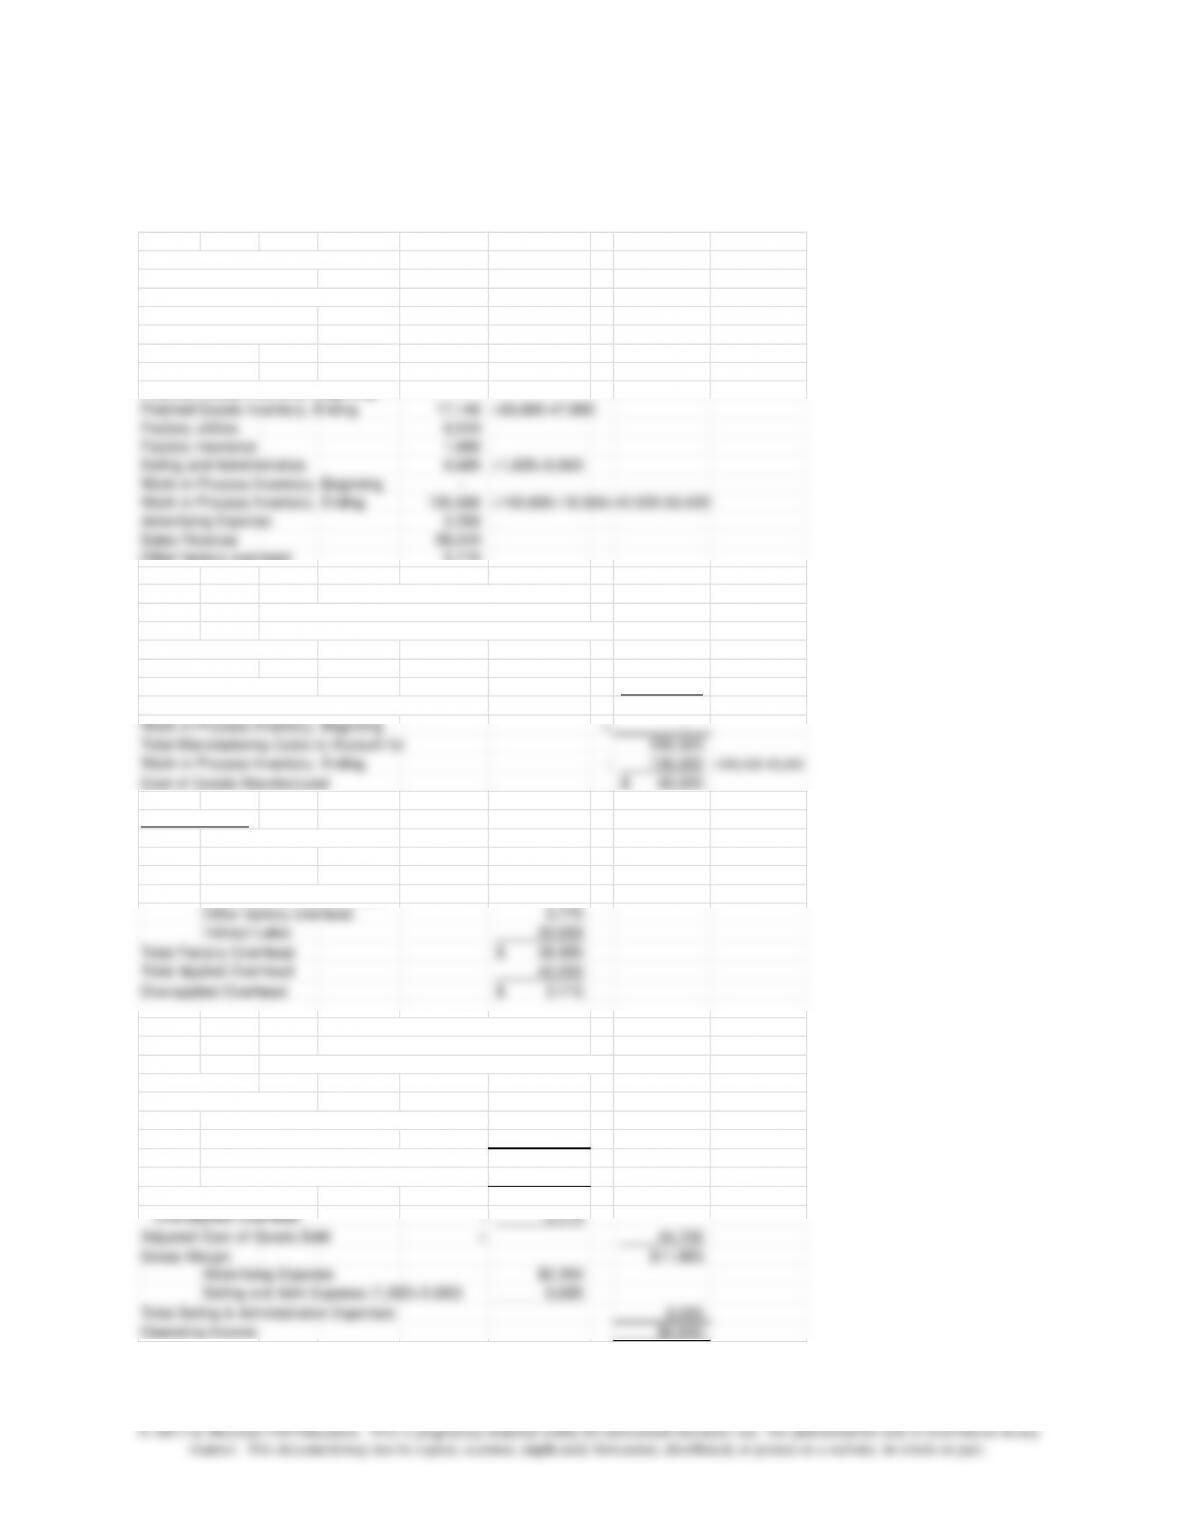
Direct Materials Used $87,500
Direct Labor–Wages 141,900
Factory Overhead Applied $91,913
Total Manufacturing Costs Incurred during year 321,313
Work-in–Process Inventory, Beginning + –
Total Manufacturing Costs to Account for 321,313
Work-in–Process Inventory, Ending – 175,313
Cost of Goods Manufactured $146,000
Actual Overhead
Indirect Materials Used 1,098
Total Applied Overhead 91,913
Overapplied Overhead 4,385
Apex Corporation
Income Statement
Sales Revenue $132,000
Cost of Goods Sold
Overapplied Overhead –4,385
Adjusted Cost of Goods Manufactured =107,616
Gross Margin $24,385
Advertising Expense $5,500
Seling & Adm ($2,400+$13,250) 15,650
Total Selling & Administrative Expenses 21,150
Operating Income $3,235
For the Year Ended December 31, 2013
Chapter 4 – Job Costing
4-33
4-47 Cost Flows, Application of Overhead (40 min)
1. Predetermined Overhead Rate
2. a. Factory Overhead 1,600
Prepaid Insurance 1,600
b. Selling& Administrative Expense 1,025
Accumulated Depreciation 1,025
Cash 160,000
f. Factory Overhead 5,770
Cash 5,770
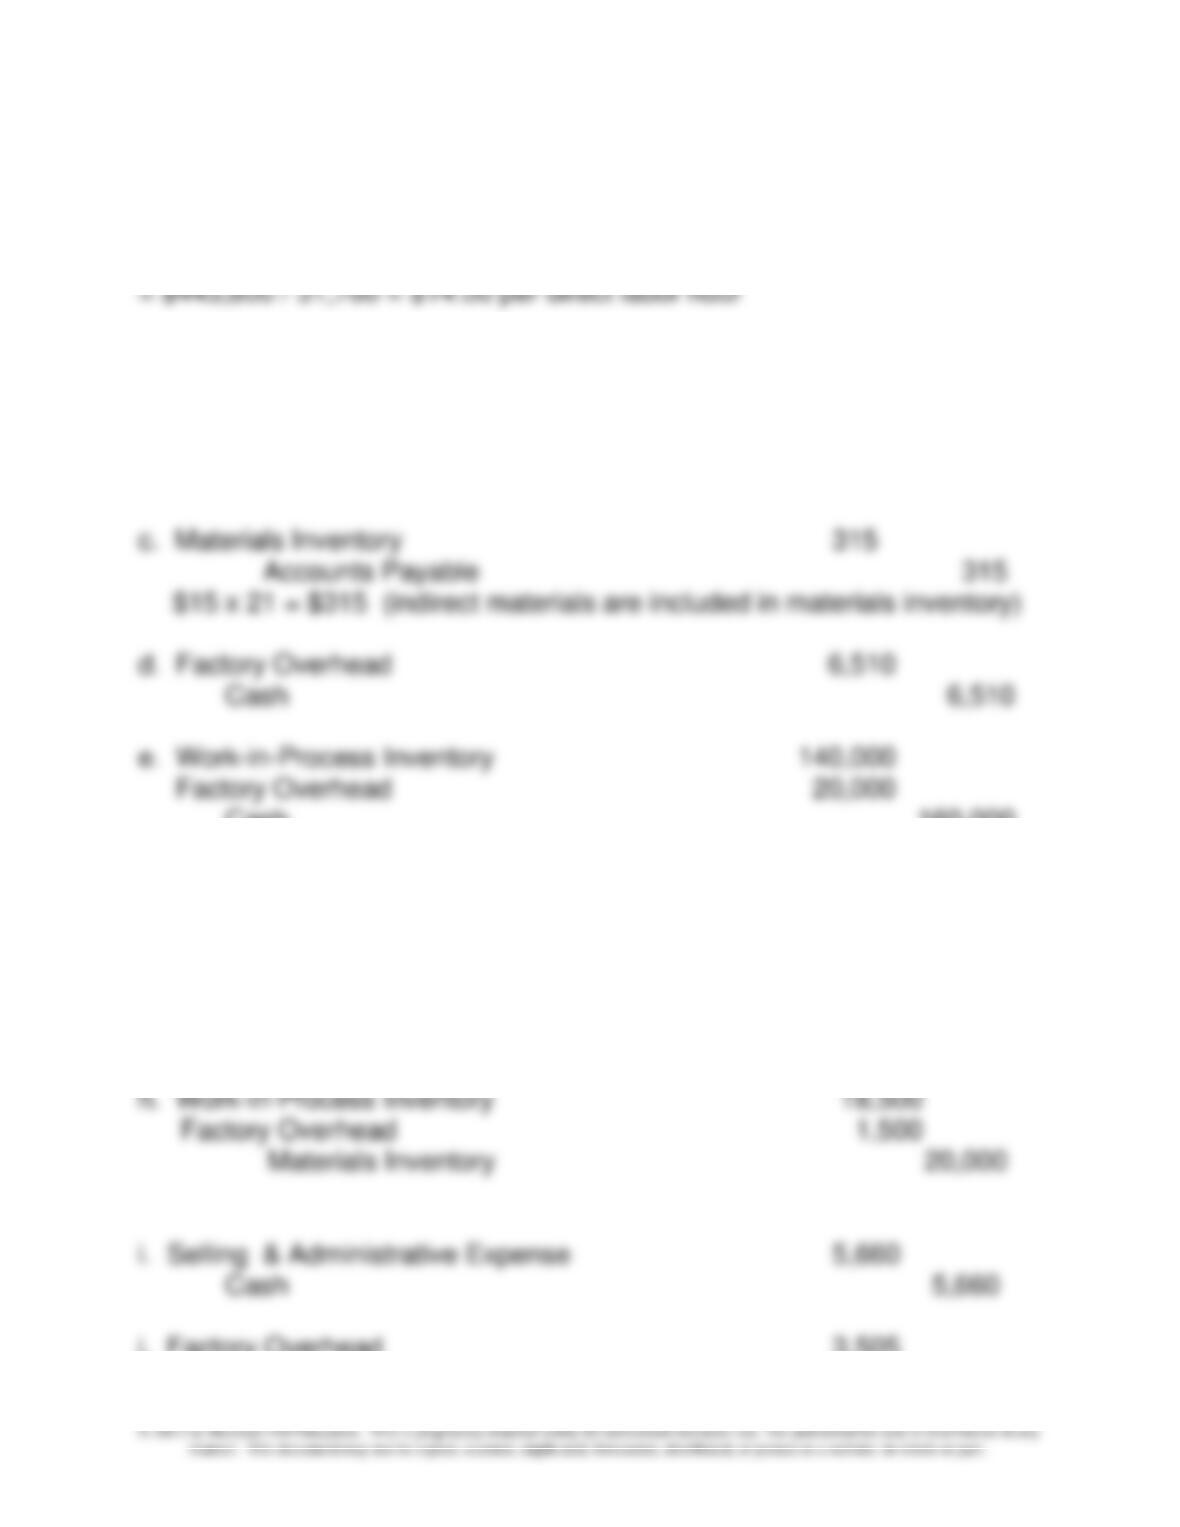
g. Materials Inventory 24,500
Accounts Payable 24,500
j. Factory Overhead 3,505
Chapter 4 – Job Costing
4-34
Accumulated Depreciation 3,505
4-47 (continued –1)
k. Advertising Expense 2,350
Cash 2,350
l. – Direct labor hours = 4,000 total hours – 1,000 indirect labor hours
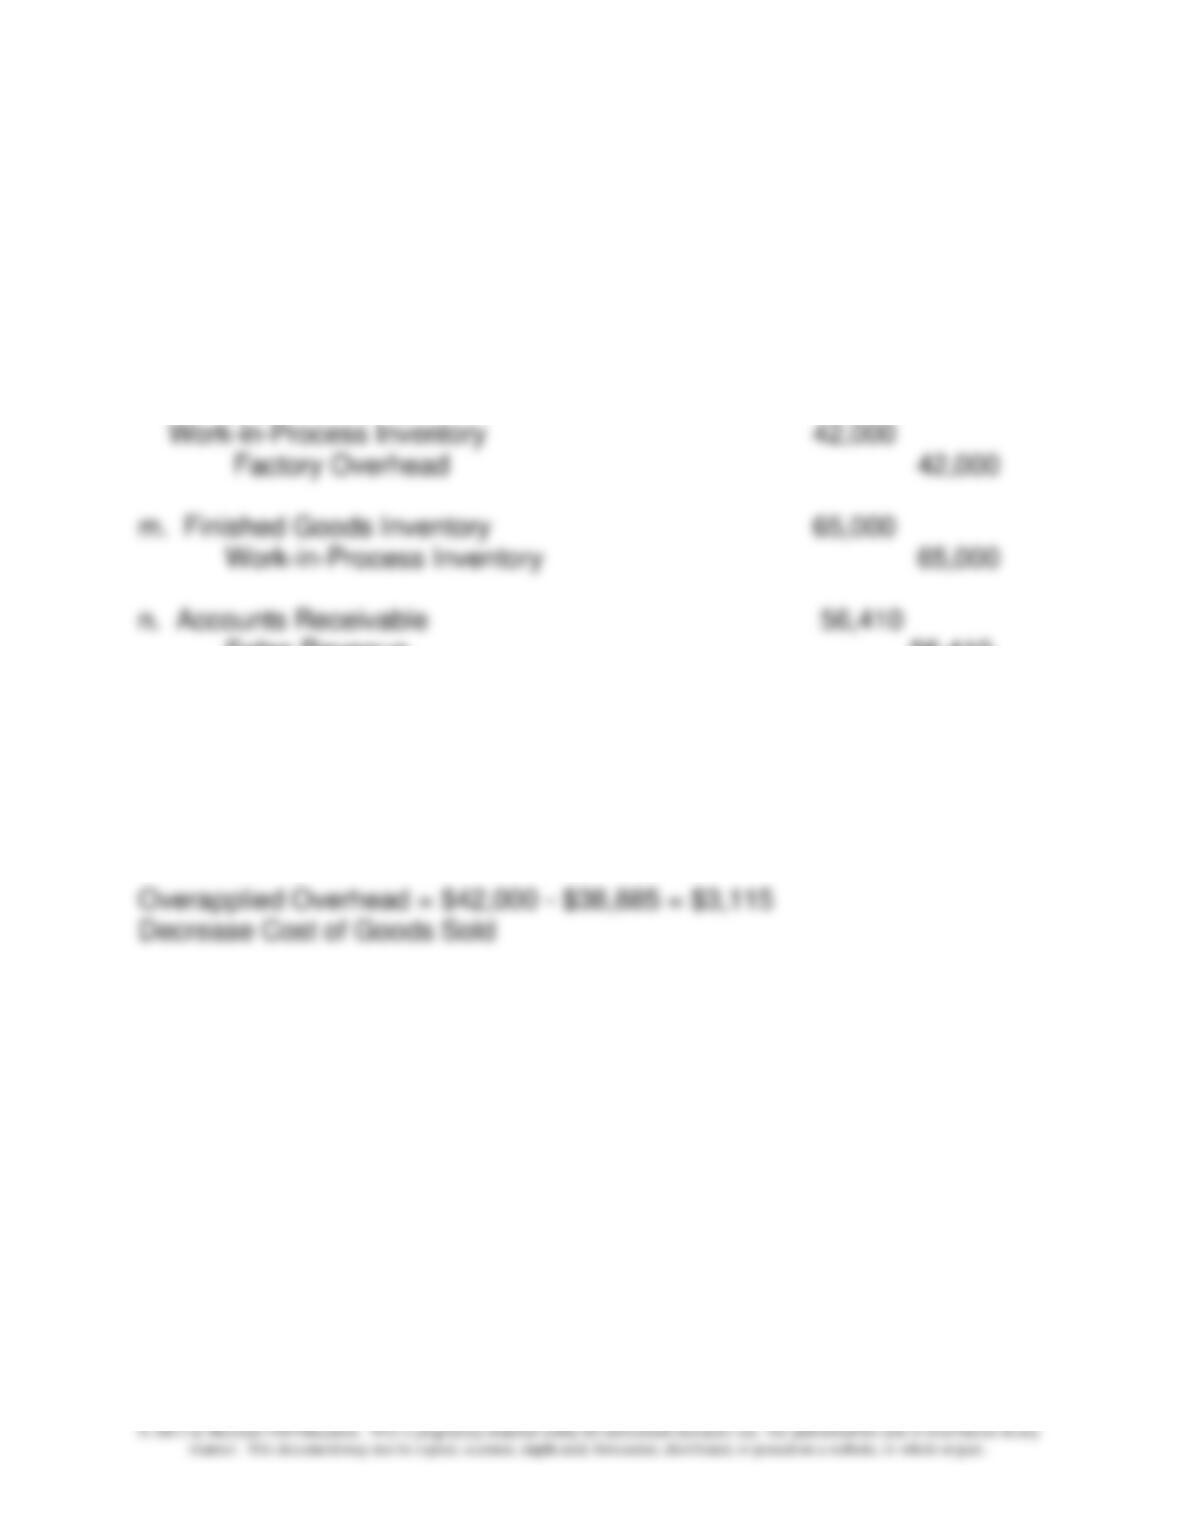
– Applied Overhead = $14.00 x 3,000 direct labor hours = $42,000
Sales Revenue 56,410
Cost of Goods Sold 47,860
Finished Goods Inventory 47,860
3. Actual Overhead = $1,600(a) + $6,510(d) + $20,000(e) + $5,770(f) +
$1,500(h) + $3,505(j) = $38,885
Chapter 4 – Job Costing
4-47 (continued –2)
4.,5.
Data
Cost of Goods Manufactured 65,000$
Cost of Goods Sold 47,860
Depreciation Expense--Plant 3,505
Direct Materials Used 18,500
Indirect Materials Used 1,500
Direct Labor 140,000
Indirect Labor 20,000
Finished Goods Inventory, Beginning –
Finished Goods Inventory, Ending 17,140 =65,000-47,860
Factory utilities 6,510
Factory insurance 1,600
Selling and Administrative 6,685 =1,025+5,660
Work-in–Process Inventory, Beginning –
Work-in–Process Inventory, Ending 135,500
=140,000+18,500+42,000-65,000
Advertising Expense 2,350
Sales Revenue 56,410
Other factory overhead 5,770
Total Manufacturing Costs to Account for 200,500
Work-in–Process Inventory, Ending – 135,500 =200,500-65,000
Cost of Goods Manufactured 65,000$
Actual Overhead
Indirect Materials Used 1,500$
Factory utilities 6,510
Factory insurance
1,600
Depreciation Expense--Plant 3,505
Overapplied Overhead 3,115$
Platinum Wish
Income Statement
Sales Revenue $56,410
Cost of Goods Sold 47,860
Overapplied Overhead –3,115
Adjusted Cost of Goods Sold =44,745
Gross Margin $11,665
Advertising Expense $2,350
Selling and Adm Expense (1,025+5,660) 6,685
Total Selling & Administrative Expenses 9,035
Operating Income $2,630
For the Year Ended December 31, 2013
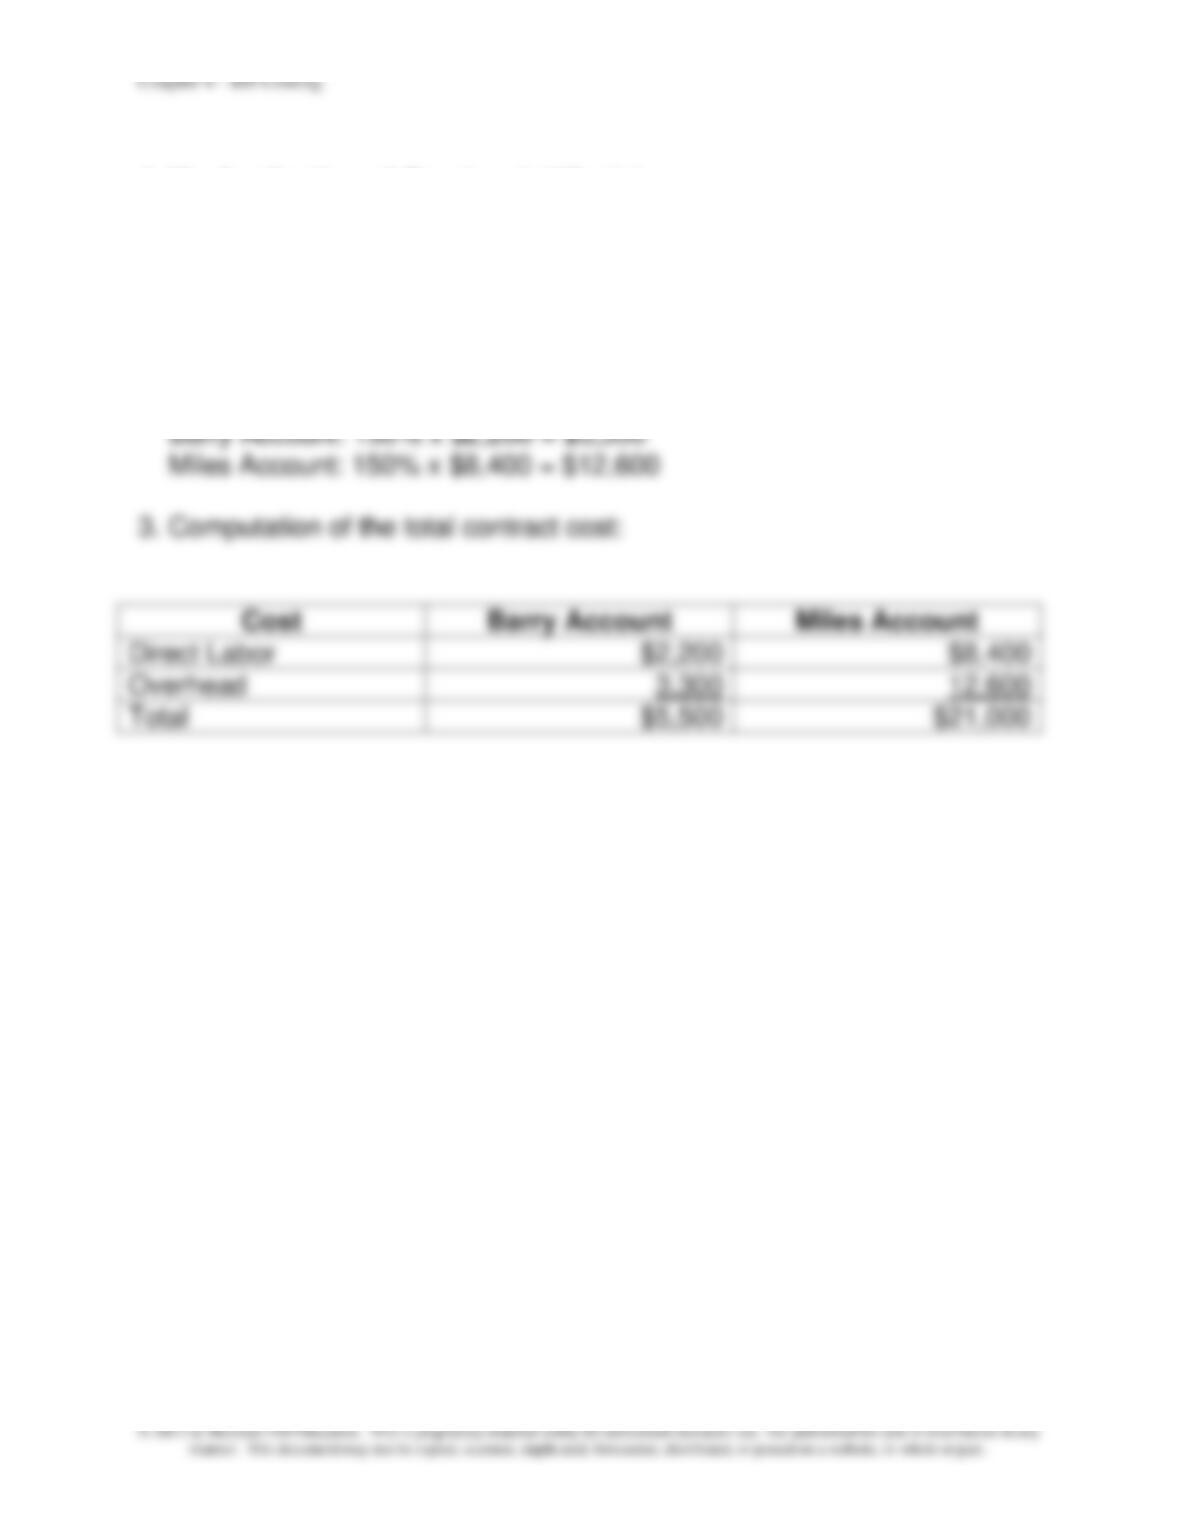
4-48 Application of Overhead (15 min)
1. $2,400,000/$1,600,000 = 150% of professional labor cost
This is used to allocate the budgeted overhead for the period to each
specific account based on the direct professional labor that has occurred
for each account.
2. Amount of overhead charged to:
4-49 Job Cost; Spreadsheet Application; Pivot Tables (50 min)
1.
DATA:
Requistions for materials or time tickets
Department Number Job No. Mat. Quant. Mat. Price Mat. Cost Labor Hours
12906 4,550 1.34$ 6,097$
12906 4,430 1.35$ 5,981$
12906 1,102
12906 810
22907 110 22.18$ 2,440$ 136
12908 1,000 9.00$ 9,000$
12908 151
22908 23 48.00$ 1,104$ 32
Labor Overhead
Department 1 6.50$ 3.00$ per labor hour
Department 2 8.88$ 150% per labor dollar
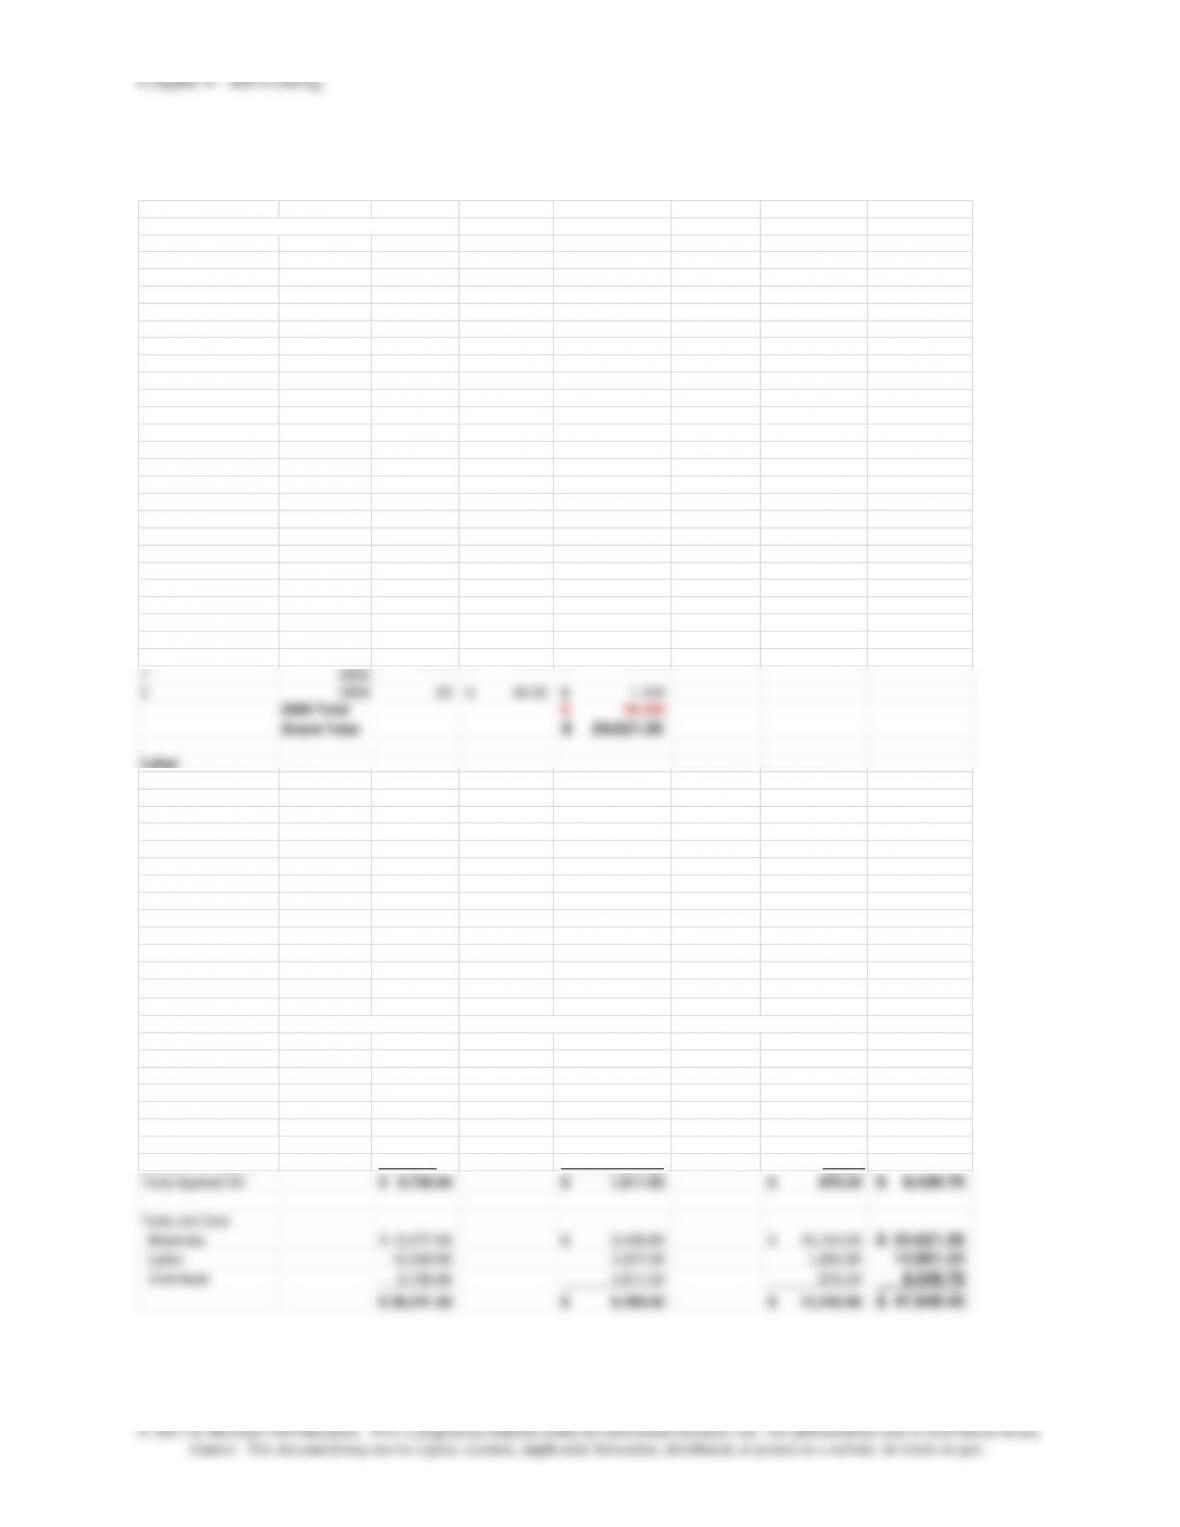
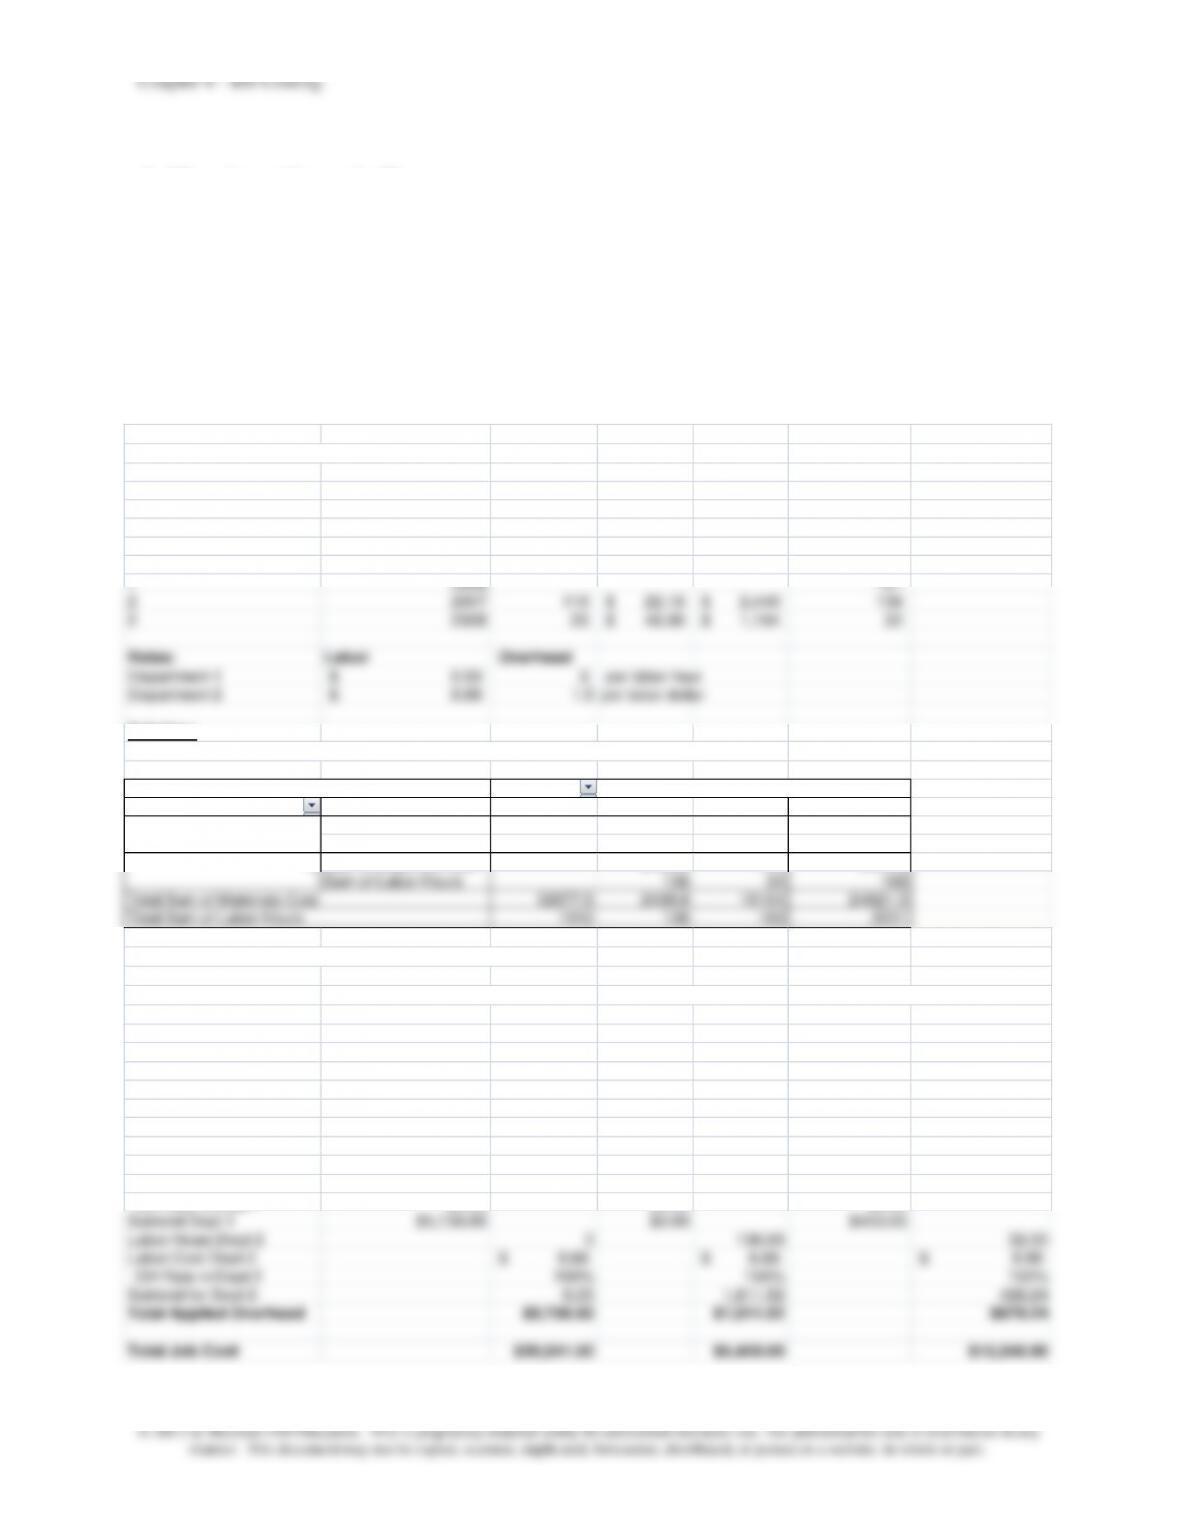
SOLUTION
Materials
Department Number Job No. Mat. Quant. Mat. Price Mat. Cost
12906 4,550 1.34$ 6,097$
12906 4,430 1.35$ 5,981$
12906
12906
2906 Total 12,078$
22907 110 22.18$ 2,440$
2907 Total 2,440$
12908 1,000 9.00$ 9,000$
12908
22908 23 48.00$ 1,104$
2908 Total 10,104$
Grand Total 24,621.30$
Labor
Department Number Job No. Labor Hours Labor Cost
12906
12906
12906 1,102
12906 810
2906 Total 1,912 12,428
22907 136
22908 32 284
2908 Total 183 1,266
Grand Total 2,231 14,901.34$
Applied Overhead
Labor hours Dept 1 1,912 0 151
OH Rate in Dept 1 $3.00 $3.00 $3.00
Subtotal Dept 1 $5,736.00 $0.00 $453.00
Labor Hours Dept 2 0 136.00 32.00
Labor Rate Dept 2 8.88$ 8.88$ 8.88$
OH Rate in Dept 2 150% 150% 150%
Subtotal for Dept 2 –
1,811.52
426.24
Total Applied OH 5,736.00$ 1,811.52$ 879.24$ 8,426.76$
Total Job Cost
Materials 12,077.50$ 2,439.80$ 10,104.00$ 24,621.30$
Labor 12,428.00 1,207.68 1,265.66 14,901.34
Overhead 5,736.00 1,811.52 879.24 8,426.76
Job 2906
Job 2907
Job 2908
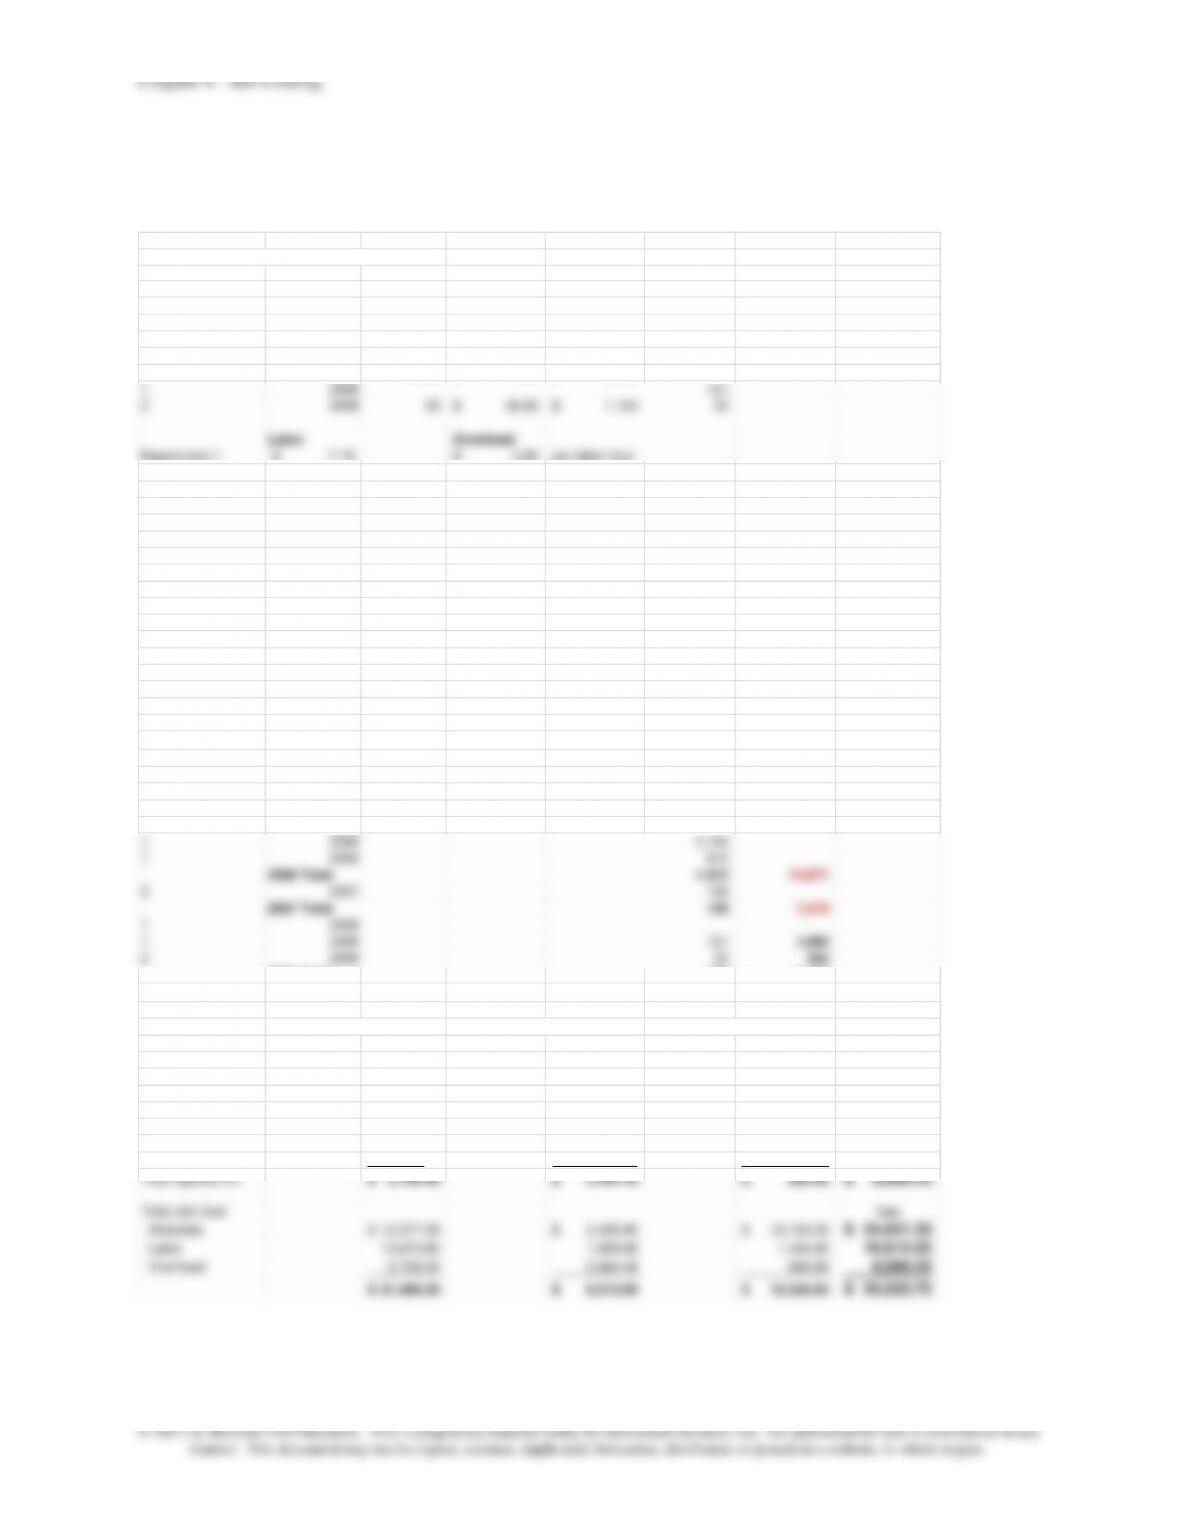
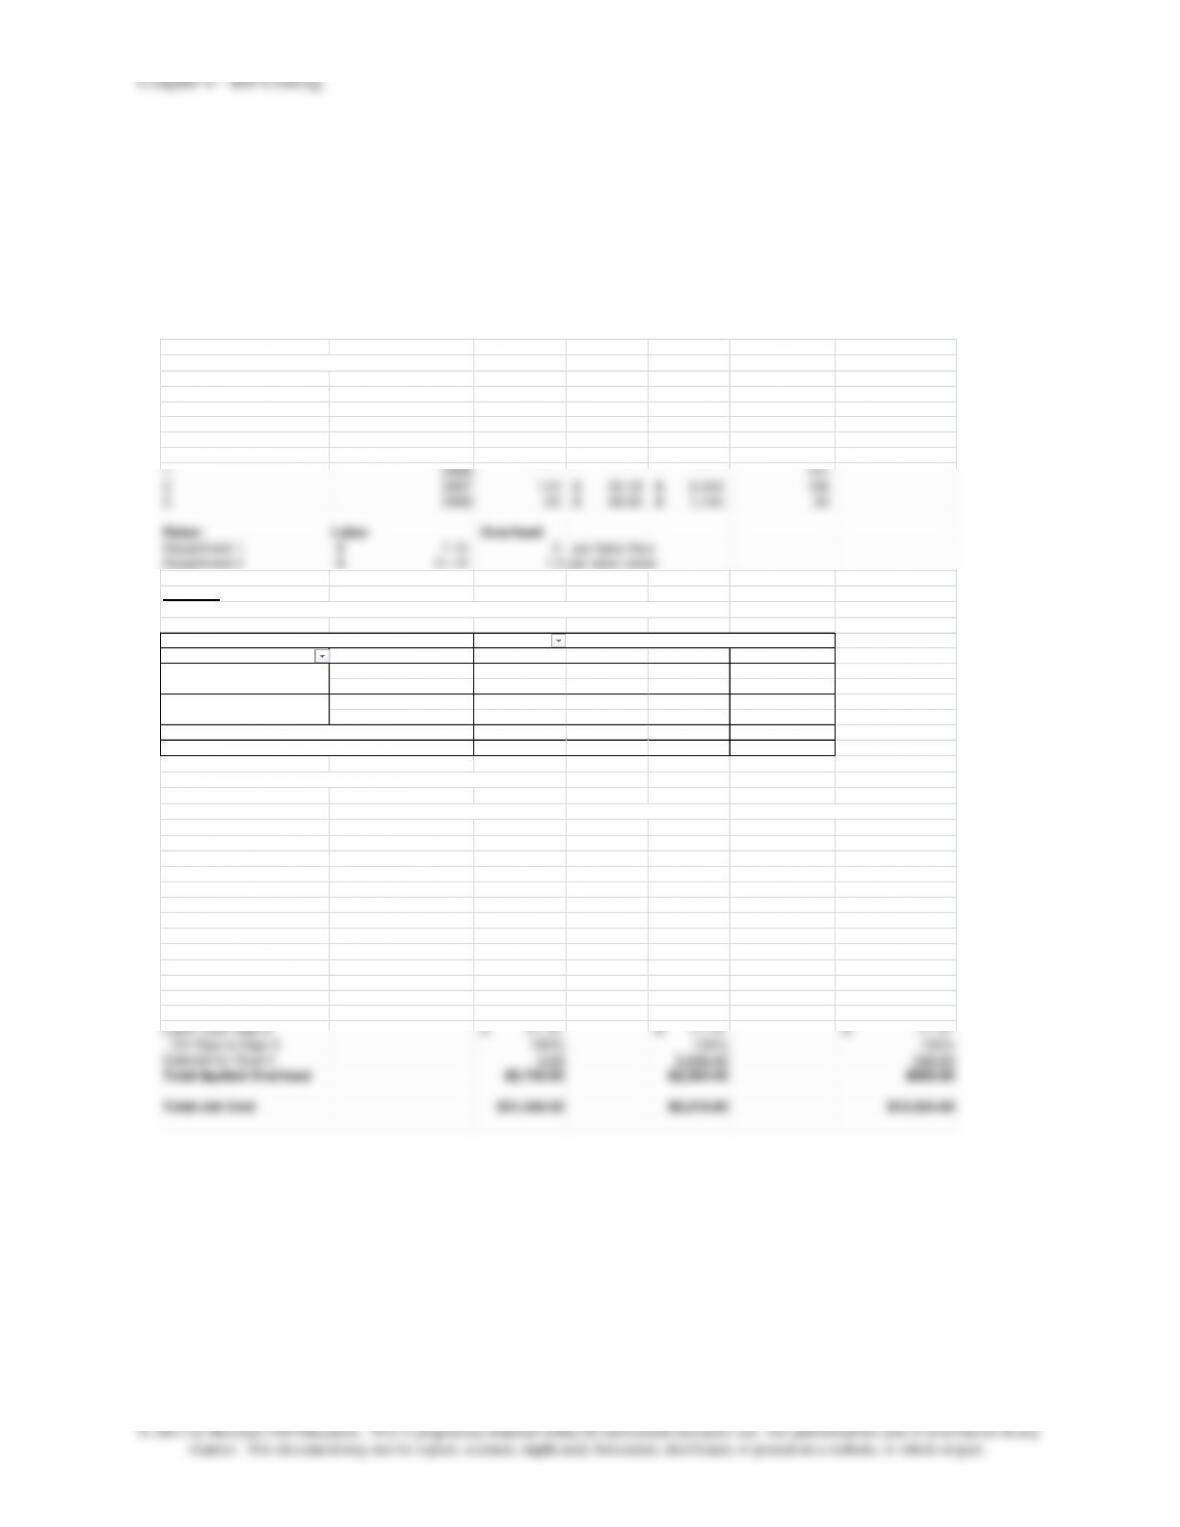
4-49 (Continued -1)
2. The solution for requirement two is shown below
DATA:
Requistions for materials or time tickets
Department Number Job No. Mat. Quant. Mat. Price Mat. Cost Labor Hours
12906 4,550 1.34$ 6,097$
12906 4,430 1.35$ 5,981$
12906 1,102
12906 810
22907 110 22.18$ 2,440$ 136
12908 1,000 9.00$ 9,000$
12908 151
22908 23 48.00$ 1,104$ 32
Labor Overhead
Department 1 7.15$ 3.00$ per labor hour
Department 2 11.10$ 150% per labor dollar
SOLUTION
Materials
Department Number Job No. Mat. Quant. Mat. Price Mat. Cost
12906 4,550 1.34$ 6,097$
12906 4,430 1.35$ 5,981$
12906
12906
22908 23 48.00$ 1,104$
2908 Total 10,104$
Grand Total 24,621.30$
Labor
Department Number Job No. Labor Hours Labor Cost
12906
12906
12906 1,102
12906 810
2906 Total 1,912 13,671
22907 136
2907 Total 136 1,510
12908
12908 151 1,080
22908 32 355
2908 Total 183 1,435
Grand Total 2,231 16,615.25$
Applied Overhead
Labor hours Dept 1 1,912 – 151
Total Job Cost Total
Materials 12,077.50$ 2,439.80$ 10,104.00$ 24,621.30$
Labor 13,670.80 1,509.60 1,434.85 16,615.25
Overhead 5,736.00 2,264.40 985.80 8,986.20
Job 2906
Job 2907
Job 2908
4-49 (continued –2)
3. Using Pivot Tables in Excel provides the flexibility to easily manipulate
the data to find summary information from the data. The solution for Part
3, identical to that in Part 1, but using Pivot Tables (see tutorial for Pivot
Tables at the end of the solution for 4-49 and in the Excel Tutorials on
the text Web site):
DATA:
Requistions for materials or time tickets
Department Number Job No. Mat. Quant. Mat. Price Mat. Cost Labor Hours
12906 4,550 1.34$ 6,097$
12906 4,430 1.35$ 5,981$
12906 1,102
12906 810
12908 1,000 9.00$ 9,000$
12908 151
22907 110 22.18$ 2,440$ 136
22908 23 48.00$ 1,104$ 32
Rates: Labor Overhead
Department 1 6.50$ 3 per labor hour
Department 2 8.88$ 1.5 per labor dollar
Solution:
Sum of Labor Hours 136 32 168
Total Sum of Materials Cost 12077.5 2439.8 10104 24621.3
Total Sum of Labor Hours 1912 136 183 2231
Then, complete the cost report below to obtain cost for each job:
Total Materials Cost $12,077.50 $2,439.80 $10,104.00
Labor Rate 6.50 8.88 6.50$ 8.88 6.50 8.88
Subtotal 12428.00 0.00 0 1207.68 981.50 284.16
Total Direct Labor Cost $12,428.00 $1,207.68 $1,265.66
Applied Overhead
Labor hours Dept 1 1912 0151
OH Rate in Dept 1 $3.00 $3.00 $3.00
Subtotal Dept 1 $5,736.00 $0.00 $453.00
Labor Hours Dept 2 0 136.00 32.00
Labor Cost Dept 2 8.88$ 8.88$ 8.88$
OH Rate in Dept 2 150% 150% 150%
Subtotal for Dept 2 0.00 1,811.52 426.24
Total Applied Overhead $5,736.00 $1,811.52 $879.24
Total Job Cost $30,241.50 $5,459.00 $12,248.90
Job 2906
Job 2907
Job 2908
4-40
4-49 (continued –3)
4. Using Pivot Tables in Excel provides the flexibility to easily manipulate
the data to find summary information from the data. The solution for Part
4, identical to that in Part 2, but using Pivot Tables:
DATA:
Requistions for materials or time tickets
Department Number Job No. Mat. Quant Mat. Price Mat. Cost Labor Hours
12906 4,550 1.34$ 6,097$
12906 4,430 1.35$ 5,981$
12906 1,102
12906 810
12908 1,000 9.00$ 9,000$
12908 151
22907 110 22.18$ 2,440$ 136
22908 23 48.00$ 1,104$ 32
Rates: Labor Overhead
Department 1 7.15$ 3 per labor hour
Department 2 11.10$ 1.5 per labor dollar
Solution:
First, do a Pivot Table on Jobs and Departments for labor hours and materials cost:
Job No.
Department Number Data 2906 2907 2908 Grand Total
1 Sum of Materials Cost 12077.5 9000 21077.5
Sum of Labor Hours 1912 151 2063
2 Sum of Materials Cost 2439.8 1104 3543.8
Sum of Labor Hours 136 32 168
Total Sum of Materials Cost 12077.5 2439.8 10104 24621.3
Total Sum of Labor Hours 1912 136 183 2231
Then, complete the cost report below to obtain cost for each job:
Total Materials Cost $12,077.50 $2,439.80 $10,104.00
Direct Labor Dept 1 Dept 2 Dept 1 Dept 2 Dept 1 Dept 2
Labor hours Dept 1 1,912 – 151
OH Rate in Dept 1 3.00$ 3.00$ 3.00$
Subtotal Dept 1 5,736.00$ –$ 453.00$
Labor Hours Dept 2 0 136.00 32.00
Labor Cost Dept 2 11.10$ 11.10$ 11.10$
OH Rate in Dept 2 150% 150% 150%
Subtotal for Dept 2 0.00 2,264.40 532.80
Total Applied Overhead $5,736.00 $2,264.40 $985.80
Total Job Cost $31,484.30 $6,213.80 $12,524.65
Job 2906
Job 2907
Job 2908
Chapter 4 – Job Costing
4-41
4-49 (continued –4)
Tutorial and Illustration:
Creating and Using Pivot Tables—the following steps can be used to
create a pivot table that in turn, can be used to evaluate various data sets
with ease. By exploring the pivot tables within Excel you can use this
feature to perform many different summations and calculations. This
tutorial will only show you a simple version of a pivot table. The data for
the tutorial is taken from the self study problem at the end of the chapter,
the Watkins Machinery Company broken down into further information for
hypothetical separate dates and amounts.
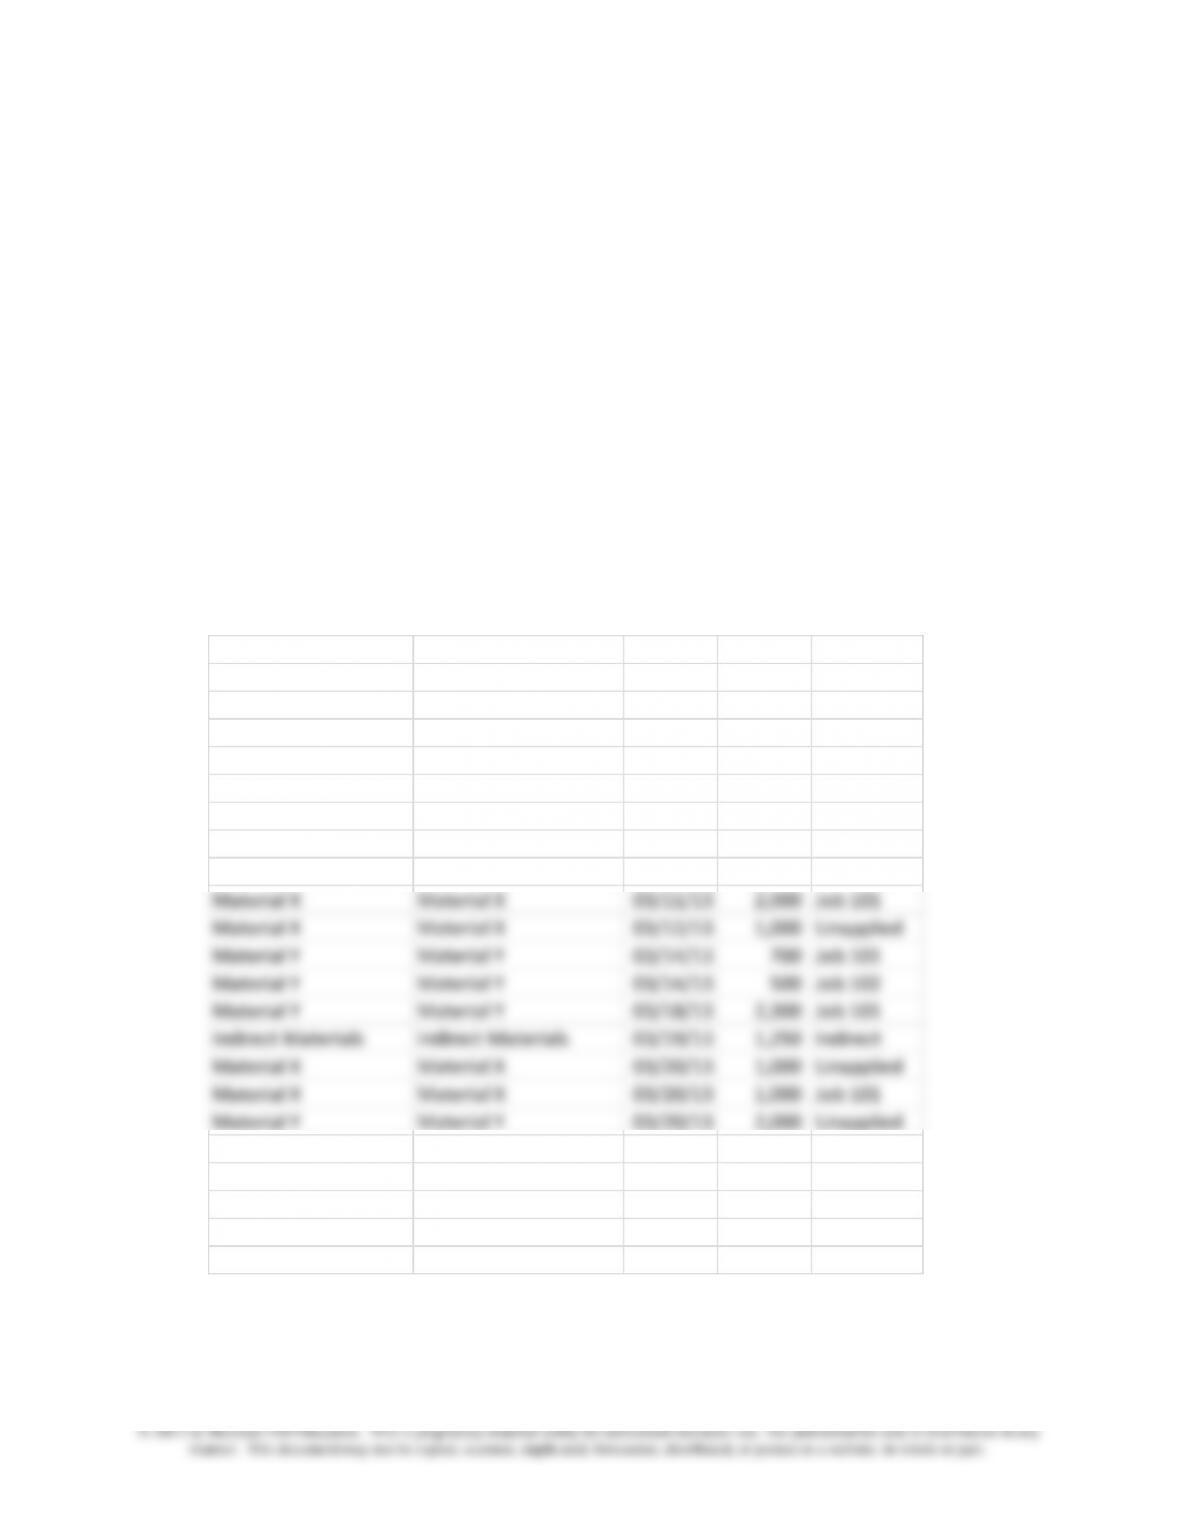
1. Enter the data for the problem into a spreadsheet, as follows (the
first two columns are the same, the reason for which will be clear
in the solution to follow):
Purchased Product Purchased Product Date Amount Applied to:
Indirect Materials Indirect Materials 02/26/13 3,000$ Indirect
Indirect Materials Indirect Materials 03/01/13 1,250 Indirect
Material Y Material Y 03/03/13 800 Job 101
Material Y Material Y 03/04/13 1,600 Job 102
Material X Material X 03/06/13 1,200 Job 101
Material X Material X 03/08/13 1,600 Job 102
Indirect Materials Indirect Materials 03/10/13 1,250 Indirect
Material X Material X 03/11/13 800 Job 101
Material X Material X 03/11/13 2,000 Job 101
Material X Material X 03/12/13 1,000 Unapplied
Material Y Material Y 03/14/13 700 Job 101
Material Y Material Y 03/14/13 500 Job 102
Material Y Material Y 03/18/13 2,300 Job 101
Indirect Materials Indirect Materials 03/19/13 1,250 Indirect
Material X Material X 03/20/13 1,000 Unapplied
Material X Material X 03/20/13 1,000 Job 101
Material Y Material Y 03/20/13 2,000 Unapplied