Chapter 4 – Job Costing
4-16
4-37 Application of Overhead (15 min)
1.
Budgeted total overhead $360,125
Budgeted direct labor hours
33,500
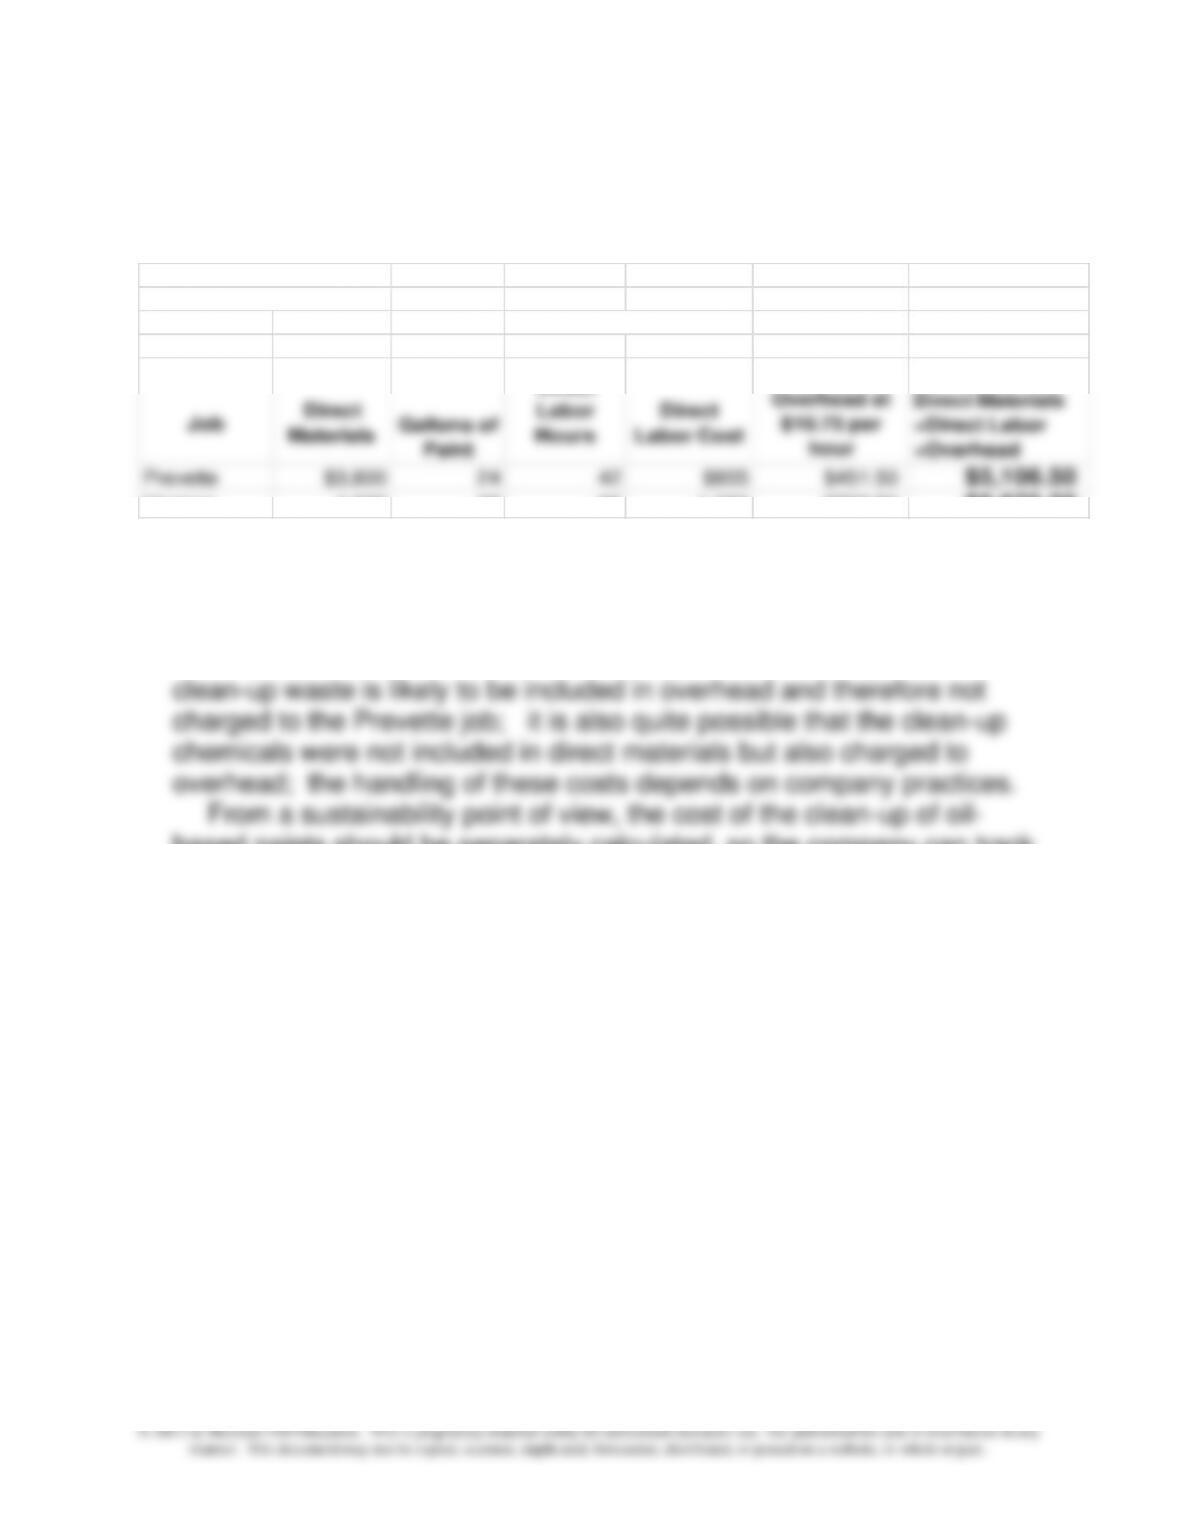
Overhead rate $10.75 =$360,125/33,500
Job
Direct
Materials
Gallons of
Paint
Direct
Labor
Hours
Direct
Labor Cost
Applied
Overhead at
$10.75 per
hour
Total Job Cost =
Direct Materials
+Direct Labor
+Overhead
Prevette $3,800 24 42 $855 $451.50 $5,106.50
Harmon 4,600 38 66 1,366 $709.50 $6,675.50
2. The oil-based paint, because it required more clean-up time and
materials (harmful chemicals), increased direct labor hours and
increased materials costs (due to the purchase of the clean–up
chemicals), both of which are included in job cost. The disposal of the
based paints should be separately calculated, so the company can track
the “full” cost of using oil–based paints. The company’s practice of
disposing of the waste clean-up materials in an environmentally
appropriate manner is commendable.
Chapter 4 – Job Costing
4-17
4-38 Spoilage and Scrap (20 Min)
Background Information:
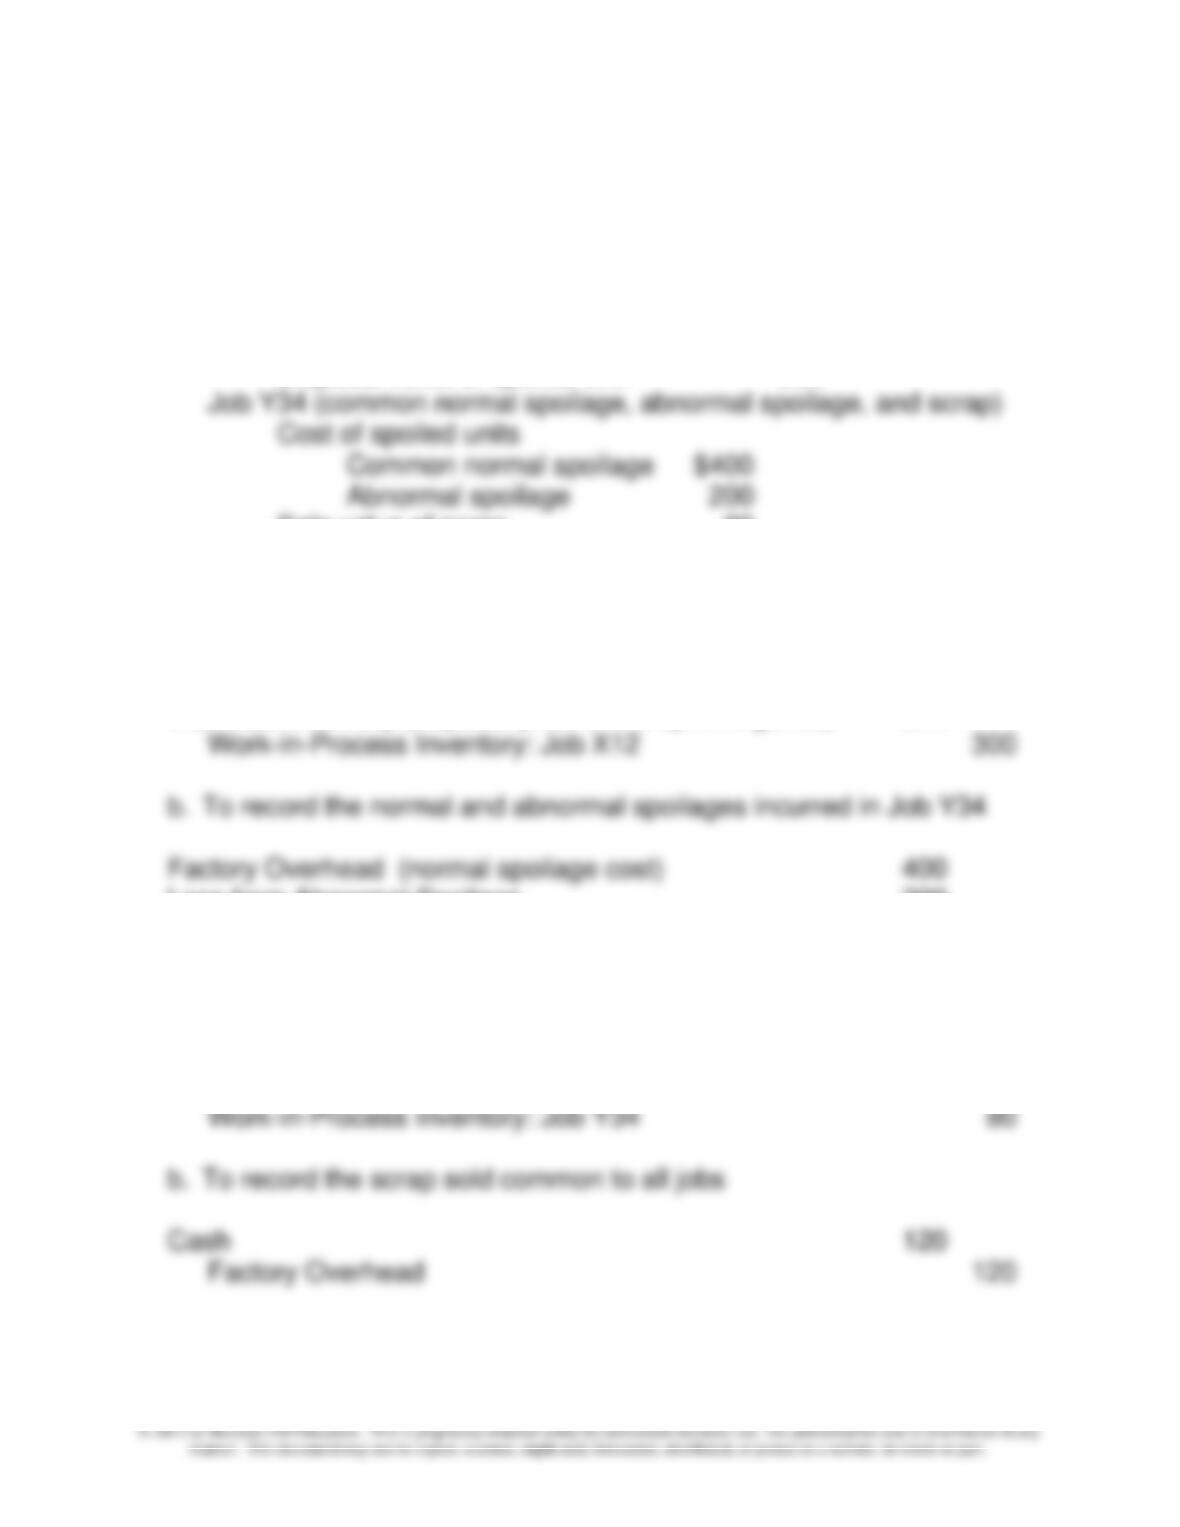
Job X12 (specific normal spoilage for a particular job)
Cost of spoiled units $600
Disposal value of spoiled unit 300
Sale value of scrap 80
Sale of scrap common to all jobs 120
1. Journal entries to record spoilage costs:
a. To record the normal spoilage attributable to Job X12
Materials Inventory (disposal price of the spoiled goods) 300
Loss from Abnormal Spoilage 200
Work-in-Process Inventory: Job Y34 600
2. Journal entries to record scrap sold:
a. To record the scrap sold attributable to a specific job
Cash 80

Chapter 4 – Job Costing
4-18
PROBLEMS
4-39 Overhead Rates Used for Each Machine in a Printing Plant
(Note: See also the Comments on Cost Management in Action at the end
of the chapter regarding a similar costing situation)
This short case is intended as a basis for class discussion that could initiate
the following topics and questions: application of job costing in the printing
industry; what are the factors driving the accuracy of product costing; how
does the choice of job costing method affect pricing; what is the effect of
cost allocation methods on management behavior, performance evaluation,
and how does a chosen cost method advance or hinder the firm’s progress
to its strategic goals? Some observations that I would bring out in this
discussion include:
EFS uses a job costing system in which materials and direct labor are
traced to the job, and overhead is traced to each machine and then applied
to the jobs based on machine usage
A strength would be that EFS has put a lot of effort into tracing the printing
costs accurately and using an overhead allocation approach that attempts
to trace the costs of the machinery to the jobs that used that machinery
I would begin a discussion of the EFS approach to allocating other
overhead costs – insurance, supervision, and office salaries – to the jobs
based on the capacity of the machines. That is, machines with more
printing capacity (where capacity is the number of feet of forms produced
per minute of machine time) will receive a larger portion of this portion of
overhead. This is very much like a volume based rate, which is OK, but
does not reflect the actual behavior of these costs. Suppose the total of
other overhead is significant. Then small jobs on high capacity (fast)
machines will be charged a relatively high rate. Conversely, large jobs on
low-capacity machines will be charged a relatively low rate. How this
would affect pricing and the allocation of jobs to machines is not easy to
predict.
Chapter 4 – Job Costing
4-19
4-39 (continued –1)
The strategic issue is the unknown impact of cost calculations on
competitive pricing, and therefore on the company’s competitiveness. The
business) in some periods of the year.
Source: Lisa Cross, “Benefiting from Costing and Pricing Tools,” Graphic
Arts Monthly, July 2004, pp 32-34.
4-40 Plantwide vs. Departmental Overhead Rate (30 Min)
1. Empco Inc. is currently using a plantwide overhead rate that is
applied on the basis of direct labor dollars. In general, a
plantwide factory overhead rate is acceptable only if a similar
relationship between overhead and direct labor exists in all
departments, or the company manufactures products, which
receive proportional services from each department.
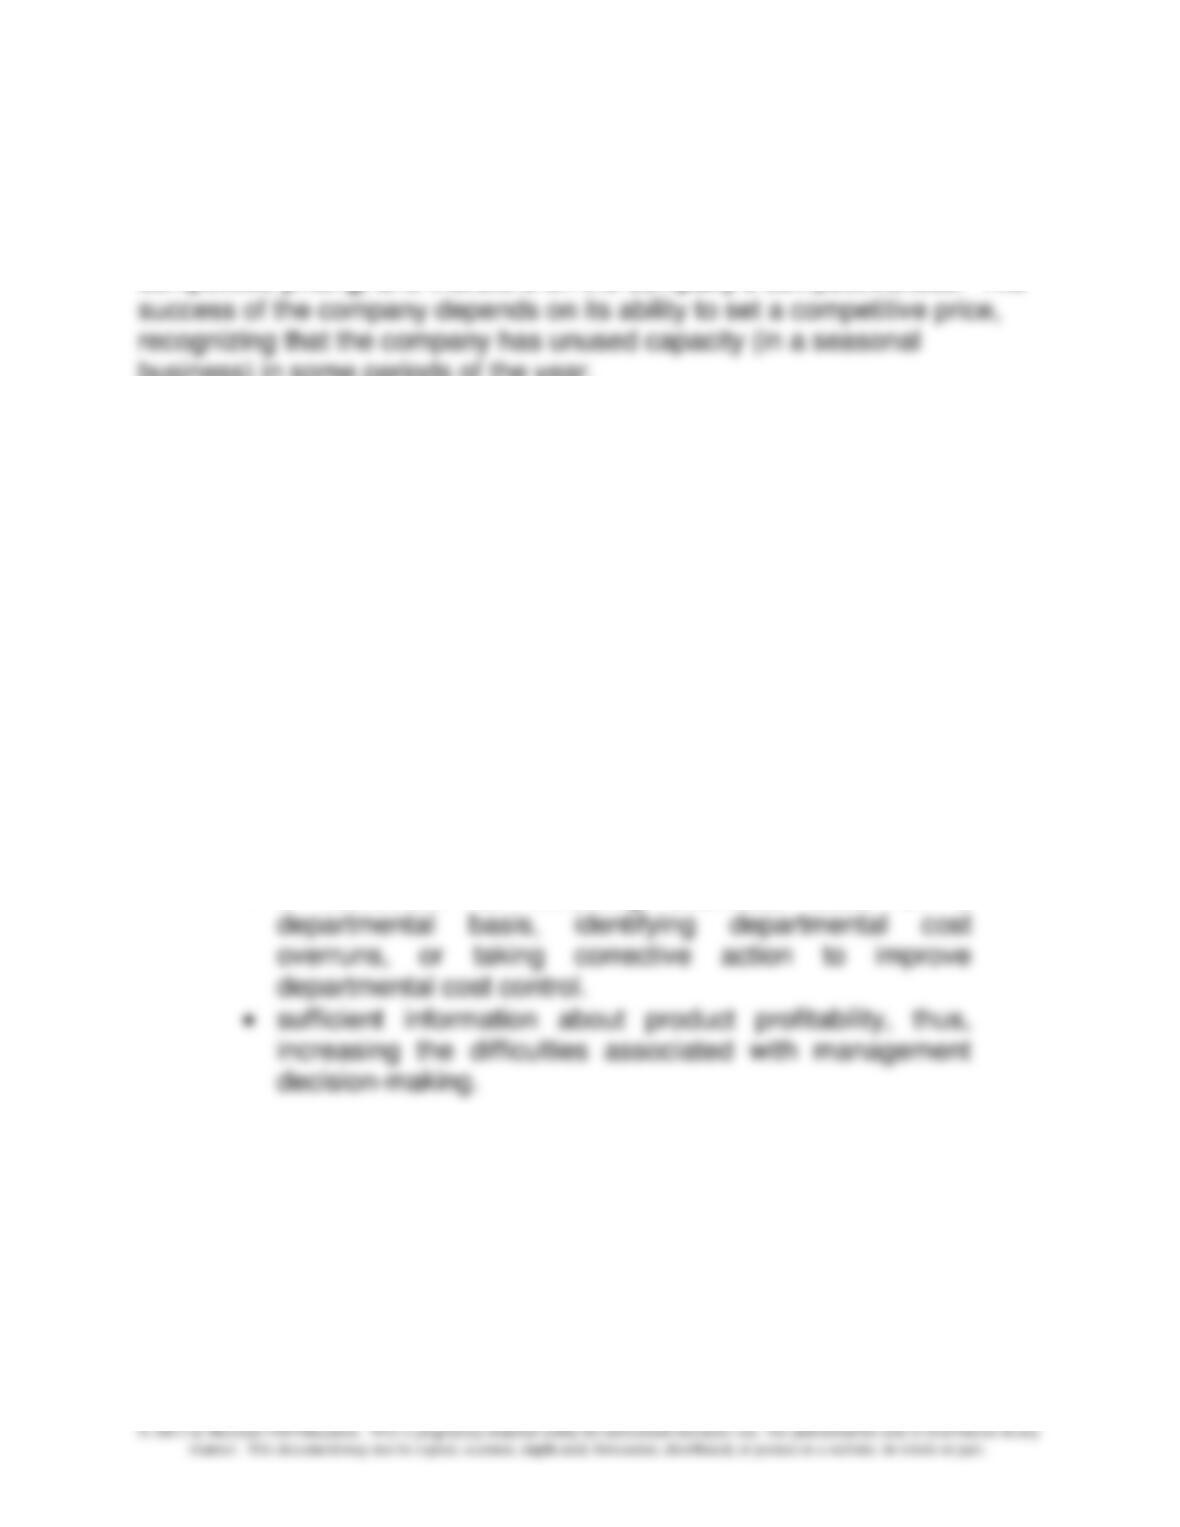
In most cases, departmental overhead rates are
preferable to plantwide overhead rates because plantwide
overhead rates do not provide:
• a framework for reviewing overhead costs on a
Chapter 4 – Job Costing
4-20
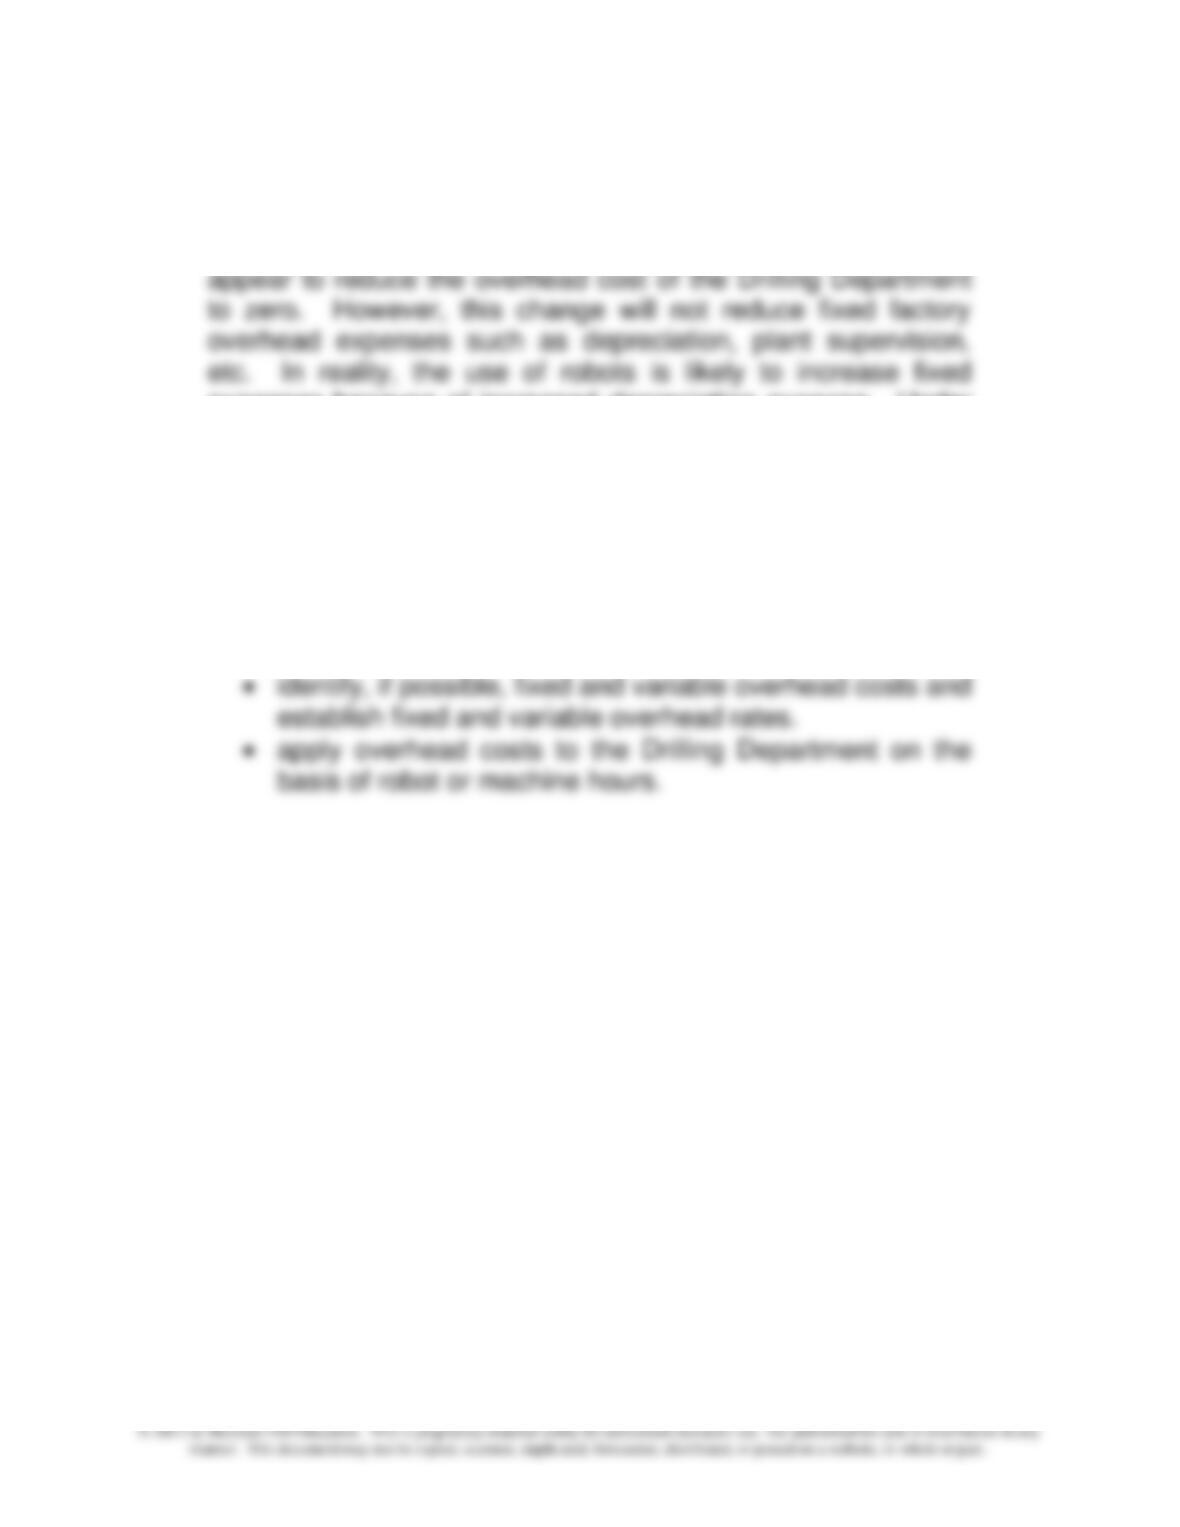
2. Because Empco uses a plantwide overhead rate applied on the
basis of direct labor dollars, the elimination of direct labor in the
Drilling Department through the introduction of robots may
expenses because of increased depreciation expense. Under
Empco’s current method of allocating overhead costs, the
remaining departments will merely absorb these costs.
4-40 (continued –1)
3. In order to improve the allocation of overhead costs ,Empco should:
• establish separate overhead accounts (pools) and rates
for the Drilling Department.
4-21
4-41 Plantwide vs. Departmental Overhead Rate (30 min)
1. Budgeted Overhead = ($146,000 + $94,000) + ($77,000 + $163,000)
= $480,000
= $24 per direct labor-hour
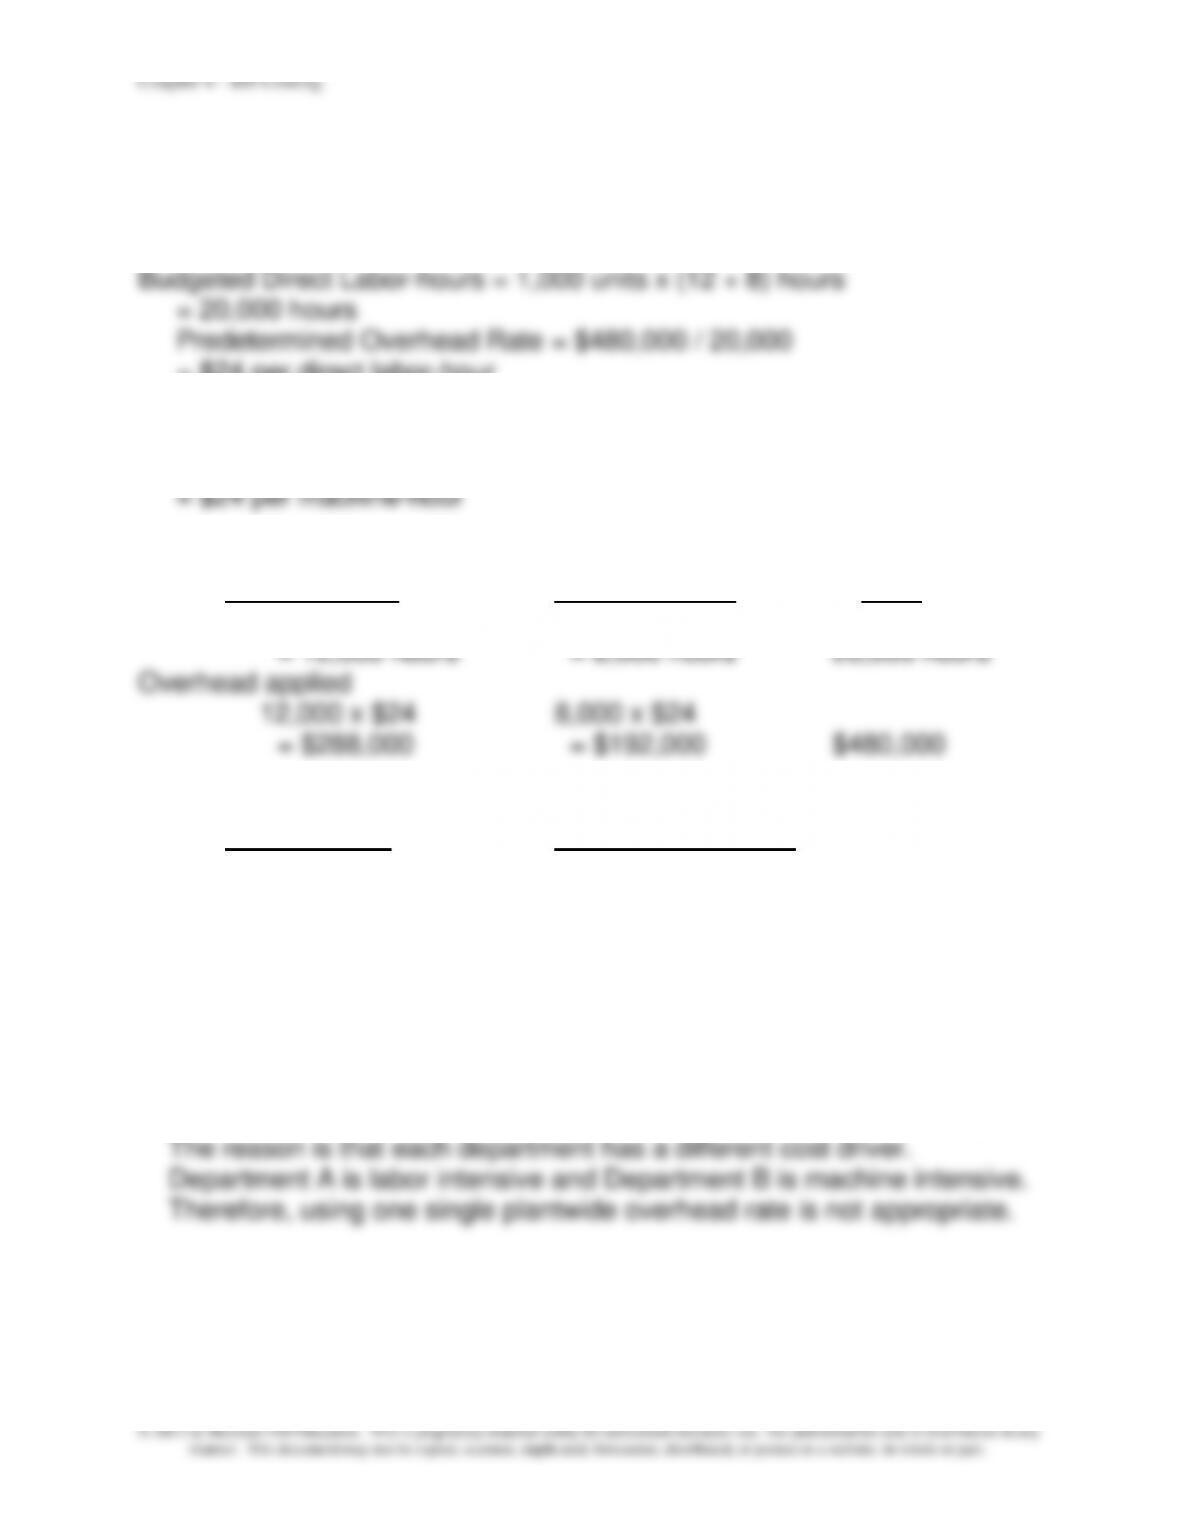
2. Budgeted Machine-hours = 1,000 units x (5 + 15) hours = 20,000 hours
Predetermined Overhead Rate = $480,000 / 20,000
3. Using Direct Labor-hours:
Department A Department B Total
DL-hours 1,000 x 12 1,000 x 8
Using Machine-hours:
Department A Department B Total
Machine-hours 1,000 x 5 1,000 x 15
= 5,000 hours = 15,000 hours 20,000 hours
Overhead applied
5,000 x $24 15,000 x $24
= $120,000 = $360,000 $480,000
4. If direct labor-hours are used to apply factory overhead, Department A
is overcharged and Department B is undercharged. If machine hours are
used, Department A is undercharged and Department B is overcharged.
Chapter 4 – Job Costing
4-22
4-41 (continued –1)
5. Using direct labor-hours for Department A:
Predetermined Overhead Rate = $240,000 / 12,000
= $20 per direct labor-hour
Applied Overhead = 1,000 units x 12 hours x $20 = $240,000
4-23
© 2013 by McGraw-Hill Education. This is proprietary material solely for authorized instructor use. Not authorized for sale or distribution in any
manner. This document may not be copied, scanned, duplicated, forwarded, distributed, or posted on a website, in whole or part.
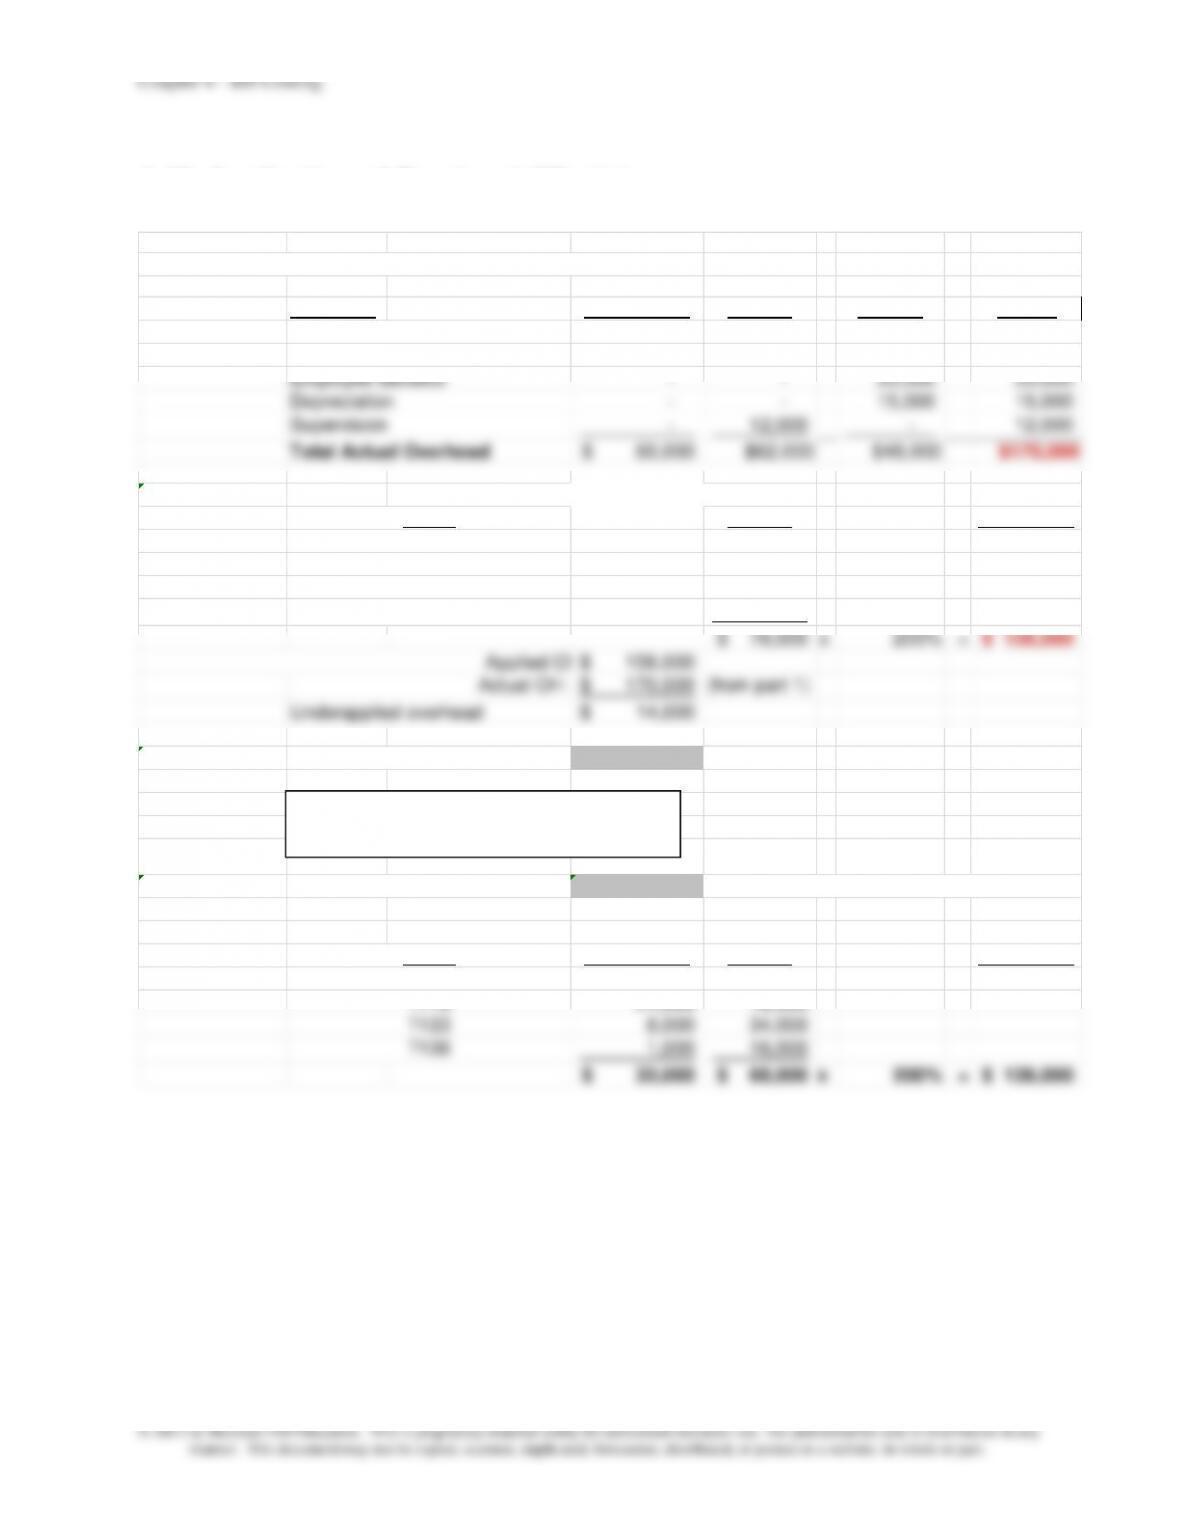
4-42 Application of Overhead (25 min)
1. Total actual overhead: $170,000; see calculations below
Overhead MATERIALS LABOR OTHER TOTAL
60,000$ –$ –$ 60,000$
– 50,000 – 50,000
– – 33,000 33,000
– – 15,000 15,000
– 12,000 – 12,000
Total Actual Overhead 60,000$ $62,000 $48,000 $170,000
2.
LABOR Applied OH
10,000$
18,000
34,000
16,000
78,000$
x
200% =156,000$
Applied OH
156,000$
Actual OH =
170,000$ (from part 1)
Underapplied overhead 14,000$
3. Cost of Goods Sold for Job T114: $108,500
MATERIALS LABOR Applied OH
–$ –$
24,000 18,000
8,000 34,000
1,000 16,000
T119
Indirect Materials and Supplies
Indirect Labor
Employee Benefits
Depreciation
Supervision
JOB #
T114
T136
T133
T136
JOB #
T114
T119
T133
Cost of Goods Sold for Job No. T114:
Chapter 4 – Job Costing
4-24
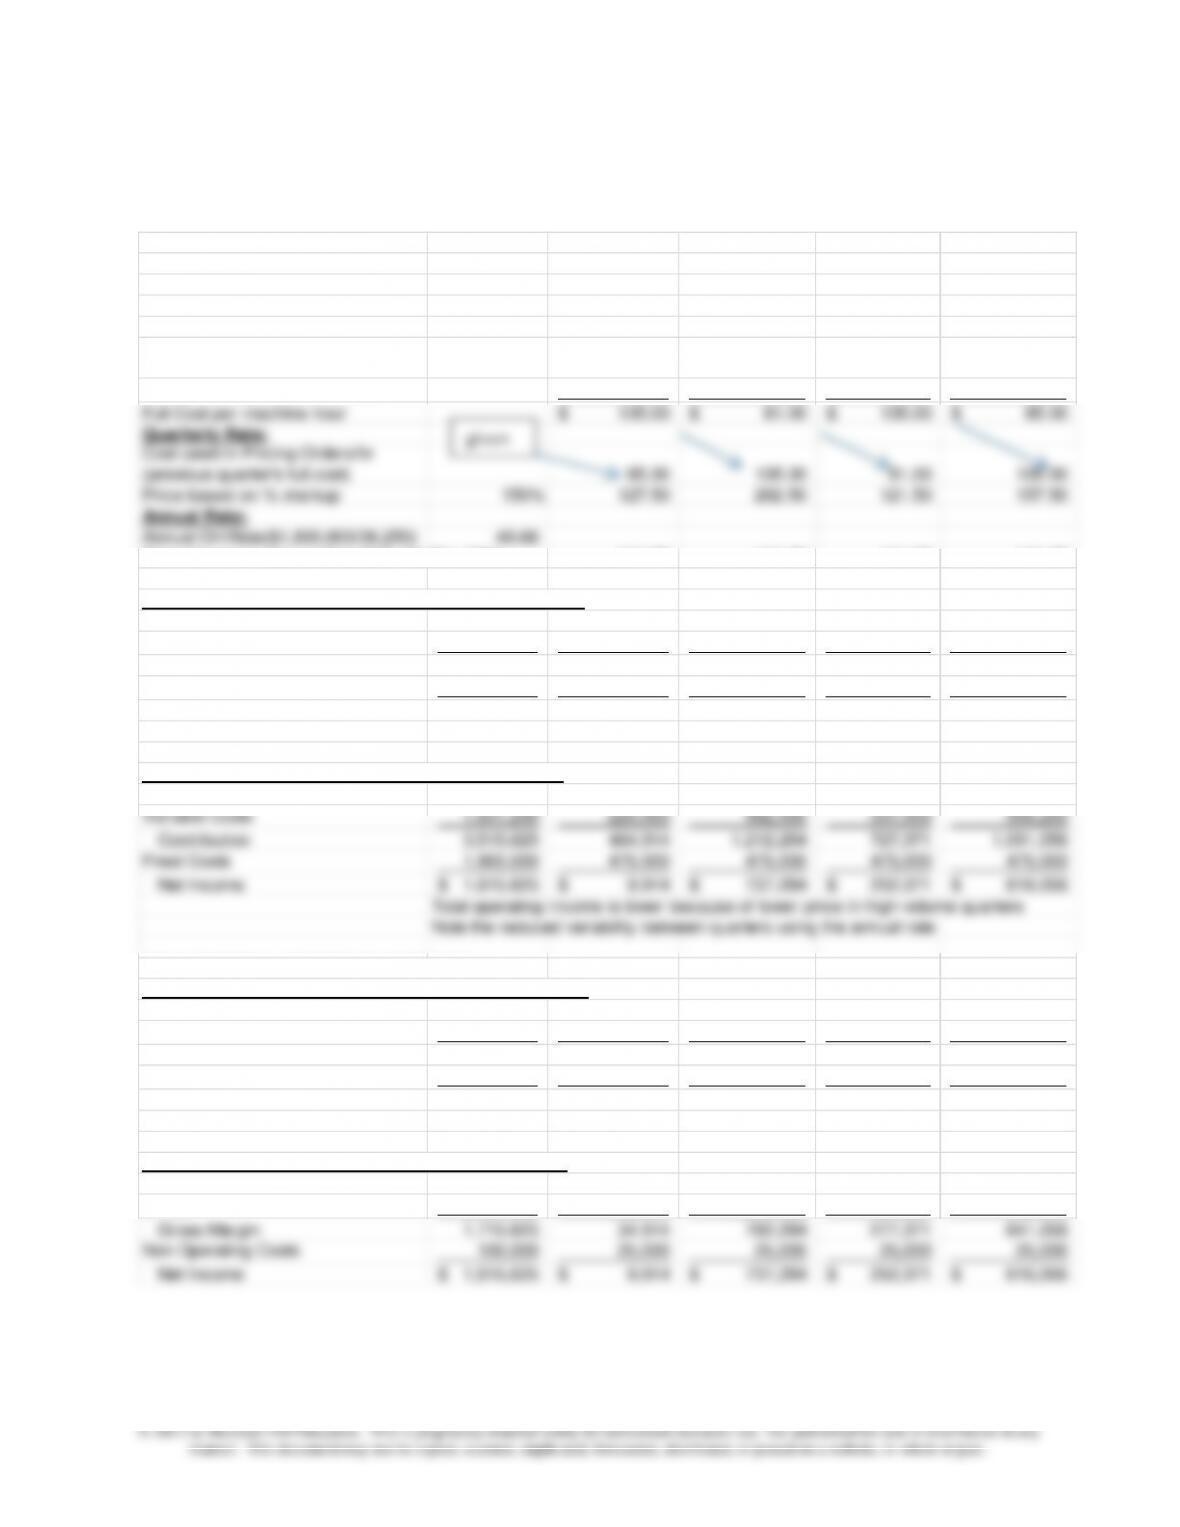
4-43 Quarterly and Annual Overhead Application
1,2,3
Mansfields Machine Shop
Annual First Quarter Second Quarter Third Quarter Fourth Quarter
Number of machine hours/quarter 36,250 5,000 12,500 7,500 11,250
Fixed Administrative Costs/qtr 100,000$ 25,000$ 25,000$ 25,000$ 25,000$
Overhead per quarter 1,800,000 450,000 450,000 450,000 450,000
Overhead per machine hour, for
each quarter
90.00 36.00 60.00 40.00
Variable cost per machine hour 45.00 45.00 45.00 45.00
Full Cost per machine hour 135.00$ 81.00$ 105.00$ 85.00$
Quarterly Rate:
Cost used in Pricing Orders/hr
(previous quarter’s full cost)
85.00 135.00 81.00 105.00
Price based on % markup 150% 127.50 202.50 121.50 157.50
Annual Rate:
Annual OH Rate($1,800,000/36,250) 49.66
Price Based on Annual Rate($45+49.66)x 150% 141.98 141.98 141.98 141.98
Using Quarterly Rate: Contribution Income Statement
Revenue 5,851,875$ 637,500$ 2,531,250$ 911,250$ 1,771,875$
Variable Costs 1,631,250 225,000 562,500 337,500 506,250
Revenue 5,146,875$ 709,914$ 1,774,784$ 1,064,871$ 1,597,306$
Variable Costs 1,631,250 225,000 562,500 337,500 506,250
Contribution 3,515,625 484,914 1,212,284 727,371 1,091,056
Fixed Costs 1,900,000 475,000 475,000 475,000 475,000
Net Income 1,615,625$ 9,914$ 737,284$ 252,371$ 616,056$
Total operating income is lower because of lower price in high–volume quarters
Note the reduced variability between quarters using the annual rate
CONVENTIONAL INCOME STATEMENTS
Using Quarterly Rate: Conventional Income Statement
Revenue 5,851,875$ 637,500$ 2,531,250$ 911,250$ 1,771,875$
COGS 3,431,250 675,000 1,012,500 787,500 956,250
Revenue 5,146,875$ 709,914$ 1,774,784$ 1,064,871$ 1,597,306$
COGS 3,431,250 675,000 1,012,500 787,500 956,250
Gross Margin 1,715,625 34,914 762,284 277,371 641,056
Non Operating Costs 100,000 25,000 25,000 25,000 25,000
Net Income 1,615,625$ 9,914$ 737,284$ 252,371$ 616,056$
given
Chapter 4 – Job Costing
4-25
Problem 4-43 (continued –1)
4. The analyses in parts 1-3 show:
a) An annual pricing rate under the annual approach would be $141.98,
based on the actual results of the prior quarter.
b) The result of the quarterly policy as implemented is to have overhead
rates and pricing rates relatively high in the high volume quarters, the
quarters in which per-hour overhead rates are the lowest. This arises
because the high and low quarters alternate, and the rates are
calculated for one quarter to apply to the next. It appears that
George and Steve may be unaware of the fact that volume
the conventional full cost income statement. The higher variability of
revenues and profits could cause strategic problems, such as
creating problems in cash flow management, as cash flows fluctuate
significantly from season to season.
Total annual profit is greater under the quarterly rate approach
($2,320,625 relative to $1,615,625 for the annual rates) because the
quarterly approach has higher rates in the high volume quarters.
Total costs are the same in both approaches but revenues are higher
for the quarterly approach. The fact that Mansfield is charging
somewhat higher rates during the high volume months is probably
Chapter 4 – Job Costing
4-26
4-43 (continued -2)
variability in profits among quarters. Of course, it also appears that
going to the annual rate could also reduce profits. The demand
figures used in the analysis are the actual figures for the prior year,
so using an annual rate would have produced lower profits in the prior
year if demand were the same.
d) If the use of annual rates would significantly increase demand, then
George and Steve should consider the change, as it would increase
profits and reduce variability in pricing and profits across quarters.
However, there is a significant difference in annual profit figures for
approximately 27 machines x 150 hours x 3 months = 12,150
machine hours. Right now the busiest quarter has 12,500
machine hours of demand, indicating that these machines are
already used beyond planned capacity levels in this quarter, and
thus, any increase in capacity means a need for more machines,
an investment that should be carefully considered.
e) Given the seasonality of the business, George and Steve may want
to consider monthly profit reports, irrespective of the overhead rate
and pricing method chosen.
f) A good additional question for class discussion would be the
following: What would be the effect of the choice of a quarterly or
annual rate on the quarterly income statements if Mansfield were to
close the overhead account quarterly and close the underapplied or
overapplied overhead to cost of goods sold? The solution shown for
Chapter 4 – Job Costing
4-27
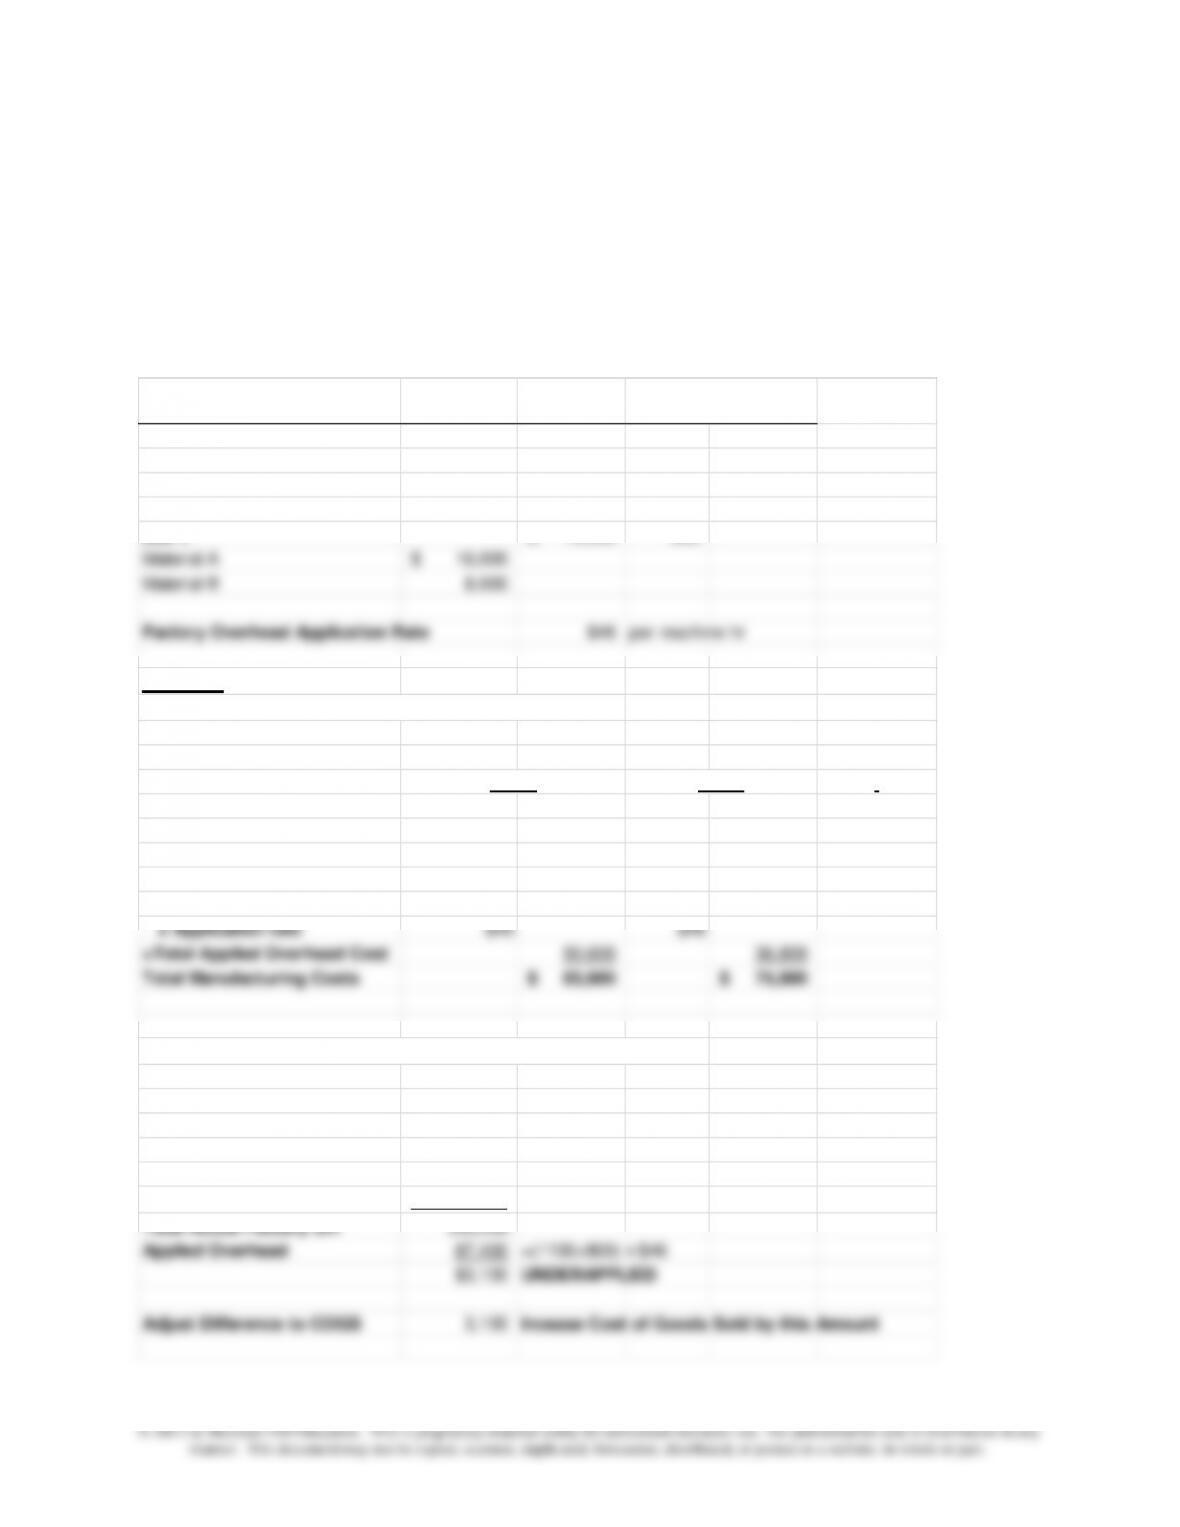
4-44 Overhead Application (30 min)
Note: the information in part (a) is not needed for the solution.
1. Total manufacturing cost: Job X = $83,600; Job Y = $75,800
2. Underapplied overhead: $3,100; increase Cost of Goods Sold
See calculations below:
Problem Information
Direct
Materials
Direct
Labor Machine Hours
Job X 22,000$ 1,100
Material A 8,000$
Material B 3,000
Job Y 15,000$ 800
Material A 16,000$
Material B 8,000
Factory Overhead Application Rate $46 per machine hr
Solution
1. Total Manufacturing Costs for each job
11,000$ 24,000$
Total Direct Labor Cost
22,000 15,000
Applied Overhead
Machine Hours 1,100 800
x Application rate $46 $46
=Total Applied Overhead Cost 50,600 36,800
Total Manufacturing Costs 83,600$ 75,800$
2. Calculate Factory Overhead Under or Overapplied
Actual Factory OH:
Utilities 3,000
Depreciation 18,000
Insurance 2,500
Total Actual Factory OH $90,500
Applied Overhead 87,400 =(1100+800) x $46
$3,100 UNDERAPPLIED
Adjust Difference to COGS 3,100 Incease Cost of Goods Sold by this Amount
Chapter 4 – Job Costing
4-28
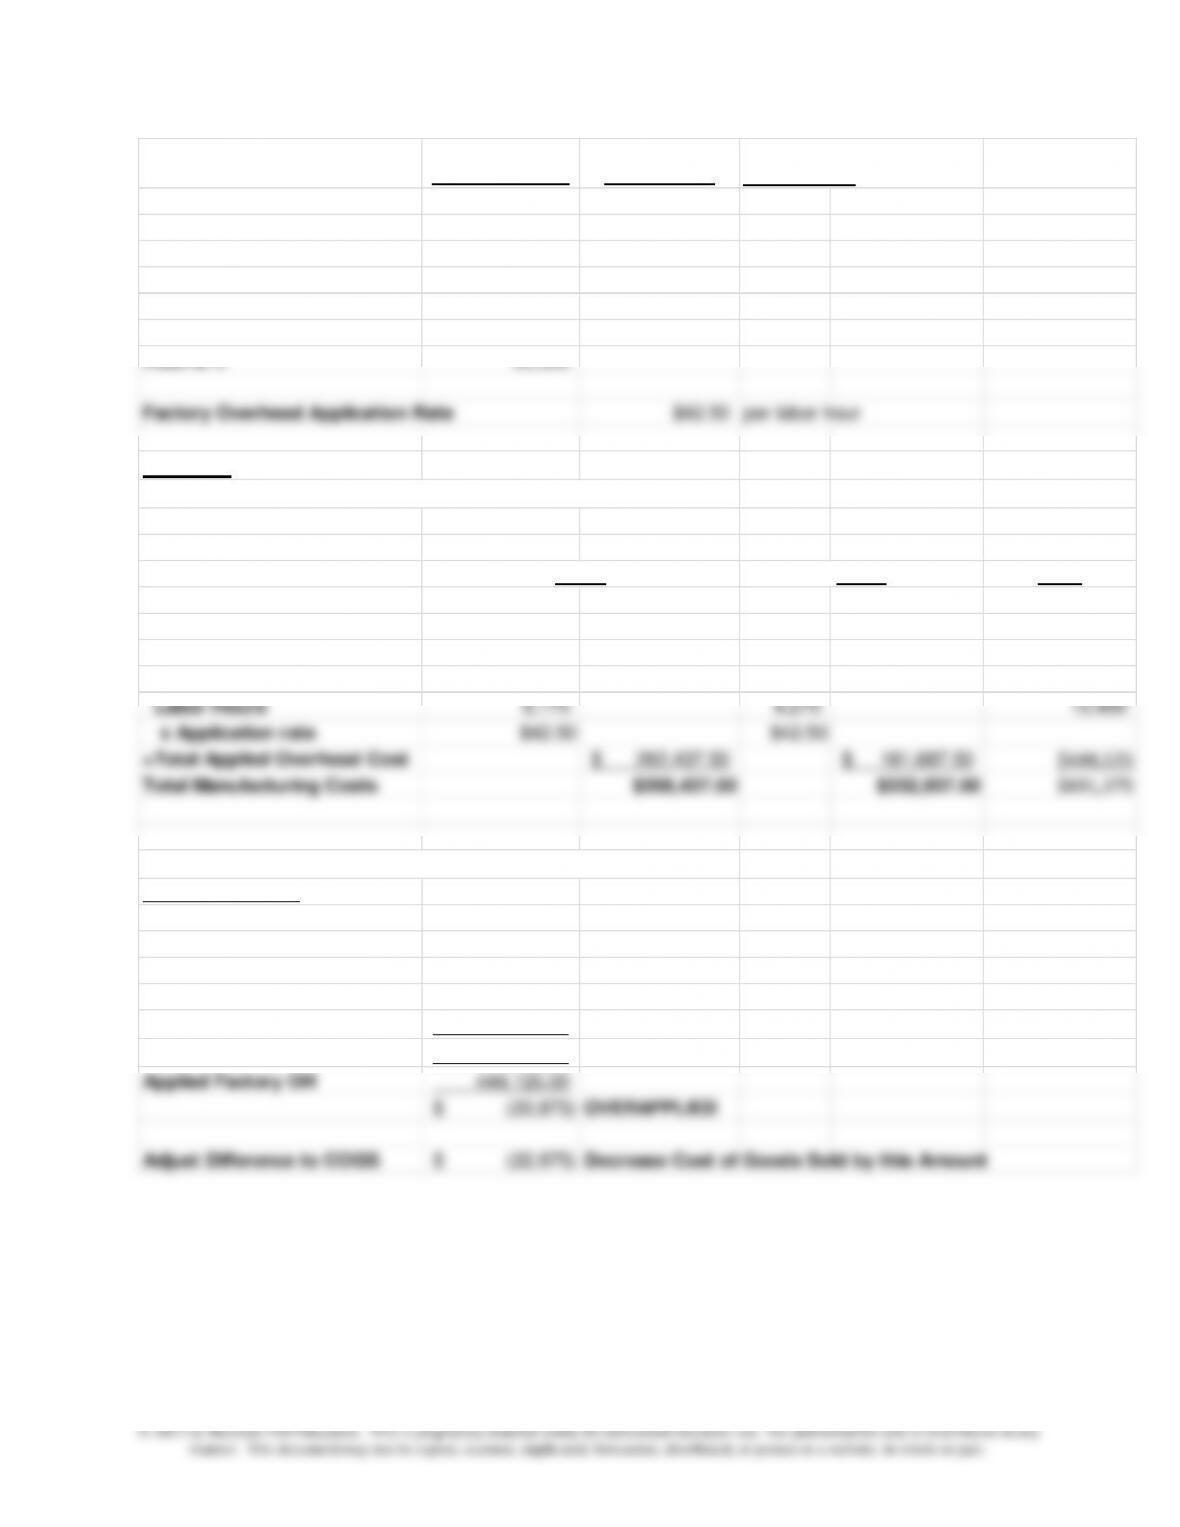
4-45 Application of Overhead (20 min)
1. Total manufacturing cost: Job S = $358,437.50; Job T=
Chapter 4 – Job Costing
4-29
Problem Information
Direct Materials Direct Labor Labor Hours
Job S 55,500$ 6,175
Material A 28,500$
Material B 12,000
Job T 45,000$ 4,275
Material A 71,250$
Material B 35,000
Factory Overhead Application Rate $42.50 per labor hour
Solution
1. Total Manufacturing Costs for each job
Total Direct Materials Cost Job S Job T Total
40,500.00$ 106,250.00$
Total Direct Labor Cost
55,500.00$ 45,000.00$
Applied Overhead
Labor Hours 6,175 4,275 10,450
x Application rate $42.50 $42.50
Total Manufacturing Costs $358,437.50 $332,937.50 $691,375
2. Calculate Factory Overhead Under or Overapplied
Actual Factory OH:
Indirect Materials 211,000$
Indirect Labor 133,000
Utilities 14,250
Depreciation 45,000
Insurance 18,000
Total Actual Factory OH 421,250$
Adjust Difference to COGS (22,875)$ Decrease Cost of Goods Sold by this Amount
Chapter 4 – Job Costing
4-30
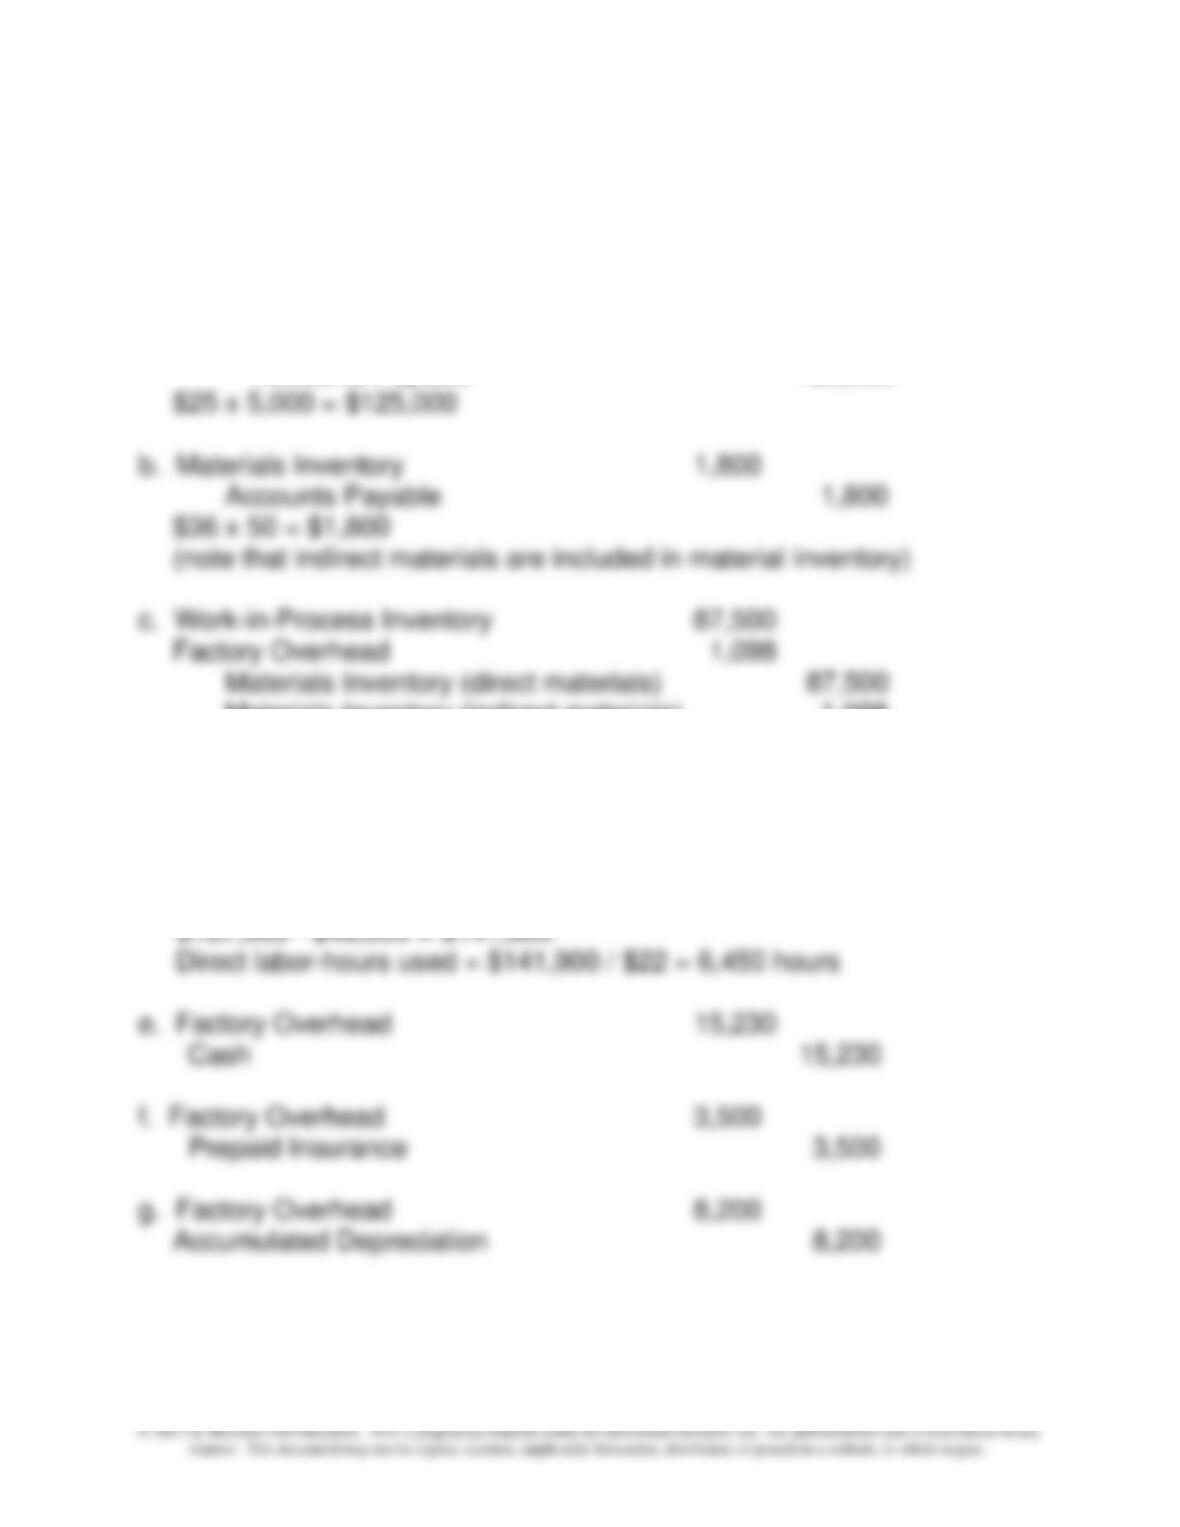
4-46 Cost Flows, Application of Overhead (50-60 min)
1. Predetermined Overhead Rate
= $1,235,475 / 86,700 = $14.25 per direct labor-hour
2. a. Materials Inventory 125,000
Accounts Payable 125,000
Materials Inventory (indirect materials) 1,098
$25 x 3,500 = $87,500
$36 x 30.5 = $1,098
d. Work-in-Process Inventory 141,900
Factory Overhead 46,000
Cash 187,900