Chapter 20 – Management Compensation, Business Analysis, and Business Valuation
20–43
20-45 (continued -1)
Liquidity looks OK overall, except for the recent buildup in inventory. The current ratio has fallen
below the bank restriction years ago, but has been safely above it in recent years. On the plus side,
cash flow from operations continues to improve, except for a decline in the prior year. Liquidity looks
good, but it would also be useful to compare these results to an industry average to validate the
findings.
b. Profitability
Ratios
Relevance
2008
2009
2010
2011
2012
2013
Return on
Total Assets
A measure of management’s efficiency
and effectiveness in using available
assets.
6.7%
12.1%
13.5%
2.6%
12.7%
Return on
Equity
A measure of management’s
effectiveness in providing returns to
shareholders
53.9%
71.8%
61.5%
10.5%
50.0%
Gross Margin
%
An important measure of profitability.
Should be compared to prior years and to
relevant industry data. Reflects control
over costs and pricing policies.
35.0%
36.0%
37.9%
38.2%
38.0%
40.5%
Profitability is excellent in 2013, rebounding from a poor year in 2012. Will the improvement
continue? Some concern for variability in sales and profit over the last few years.

Chapter 20 – Management Compensation, Business Analysis, and Business Valuation
20-44
20-45 (continued –2)
The spreadsheet for the solution is shown below.
Blue Water Yachts Company
Comparative Balance Sheet
For the Year Ended December 31,
2008 2009 2010 2011 2012 2013
Cash 23,260$ 21,966$ 18,735$ 28,426$ 43,692$ 31,264$
Accounts Receivable 99,465 102,834 112,903 125,663 104,388 142,009
Allowance for Bad Debts (9,304) (8,786) (8,824) (11,266) (7,282) (12,506)
Inventory 35,009 56,784 61,792 67,884 58,994 95,774
Other Current Assets 11,894 12,894 9,024 11,006 18,923 22,903
Total Current Assets 160,324$ 185,692$ 193,630$ 221,713$ 218,715$ 279,444$
Property and Equipment 262,195 282,008 299,380 368,565 405,269 498,626
Accumulated Depreciation (65,984) (93,442) (122,892) (158,099) (187,227) (226,307)
Total Assets 356,535$ 374,258$ 370,118$ 432,179$ 436,757$ 551,763$
Accounts Payable 82,635 78,127 63,346 56,256 40,189 49,544
Taxes Payable 11,630 10,983 11,780 14,083 3,738 15,632
Short Term Loans 59,876 56,980 37,583 41,093 49,594 76,962
Accrued Payroll Payable 5,227 4,598 3,649 4,224 4,774 4,779
Total Current Liabilities 159,368$ 150,688$ 116,358$ 115,656$ 98,295$ 146,917$
Long Term Debt 158,173 172,388 179,490 214,997 229,471 262,258
Partners’ Equity 38,994 51,182 74,270 101,526 108,991 142,588
356,535$ 374,258$ 370,118$ 432,179$ 436,757$ 551,763$
Blue Water Yachts Company
Comparative Statement of Income and Cash Flow
For the Year Ended December 31,
Cost of Sales 473,908 441,298 458,015 545,778 453,669 530,597
Gross Margin 255,293 247,935 279,131 337,702 278,054 361,880
Depreciation Expense 29,075 27,458 29,450 35,207 29,128 39,080
Interest Expense 18,597 19,557 20,998 21,475 24,889 28,993
Salaries and Wages 81,923 73,664 77,846 95,764 92,903 99,447
Total Expense 231,195 223,626 234,073 283,652 266,957 299,003
Net Income 24,098 24,309 45,058 54,050 11,097 62,877
Cash Flow from Operations
Net Income 24,309 45,058 54,050 11,097 62,877
Depreciation 27,458 29,450 35,207 29,128 39,080
Decrease (increase) in Receivables (3,887) (10,031) (10,318) 17,291 (32,397)
Liquidity Ratios
Accounts Receivable Turnover 7.48 7.44 8.09 6.92 7.88
Inventory Turnover 9.62 7.73 8.42 7.15 6.86
Current Ratio 1.01 1.23 1.66 1.92 2.23 1.90
Quick Ratio 0.71 0.77 1.06 1.23 1.43 1.09
Cash Flow Ratio 0.11 0.25 0.61 0.42 0.53
Chapter 20 – Management Compensation, Business Analysis, and Business Valuation
20–45
20–46 Business Valuation (20 min)
Using most recent figures, the net book value for Blue Water Sailboats’
equity is $142,588, taken from the balance sheet.
The earnings multiple method would take a projected value for earnings, as
for example the median value for the three recent years ($54,050) times
additional judgment; a median figure for the multiples valuations would be
approximately $425,000.
Summary of Valuations:
Valuation Method
Valuation
Net Book Value of Equity
$142,588
Earnings Multiple
$432,400 = 8 x $54,050
Operating Cash Flow Multiple
$420,978 = 6 x $70,163
20-47 Business Analysis (50 min)
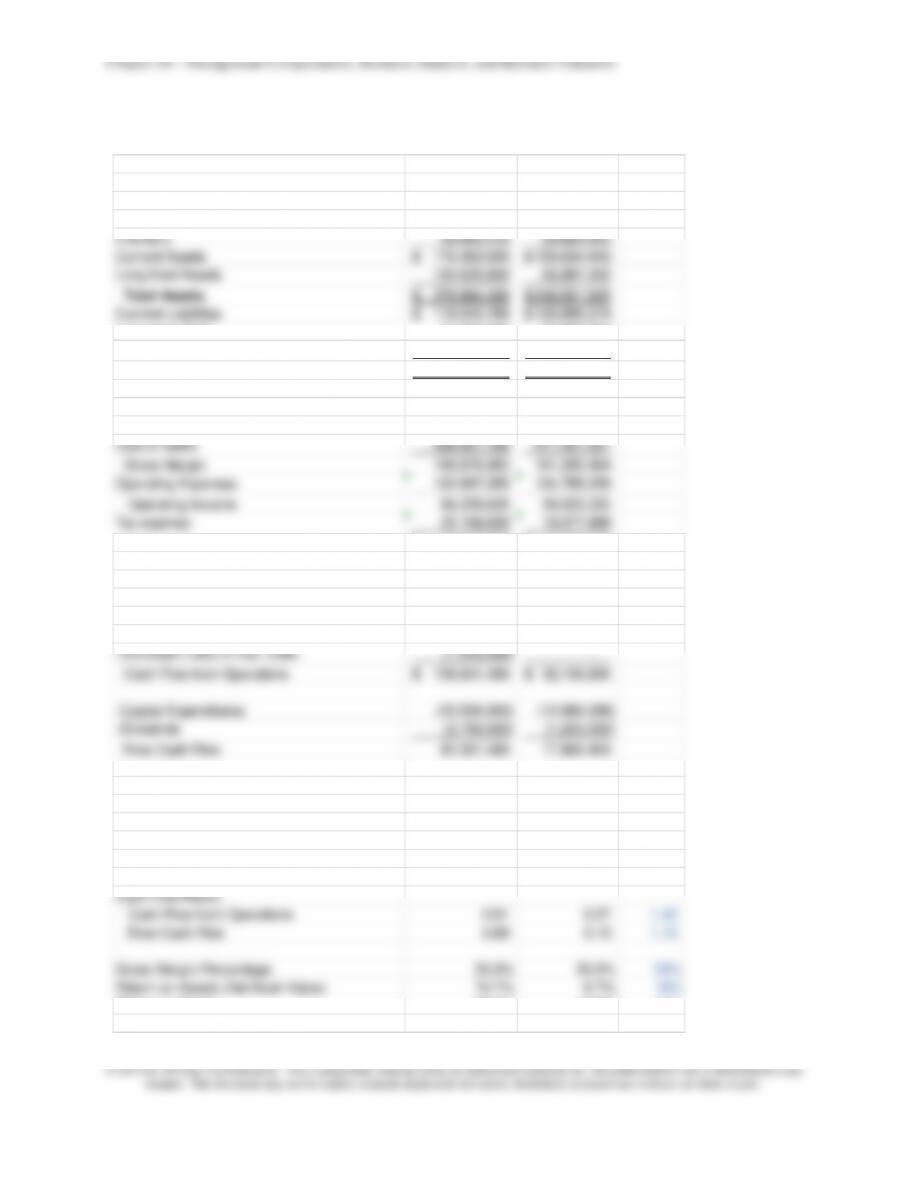
Calculations for financial ratios:
Balance Sheet 2013 2012
Cash 79,919,778$ 3,456,227$
Accounts Receivable 56,778,465 87,294,771
Inventory 39,665,416
59,883,645
Current Assets 176,363,659$ 150,634,643$
Long-lived Assets 100,620,809 95,887,302
Total Assets 276,984,468
$ 246,521,945$
Current Liabilities 119,045,766$ 120,995,274$
Long-term Debt 31,997,364 37,885,302
Shareholder Equity 125,941,338 87,641,369
Total Debt and Equity 276,984,468
$ 246,521,945$
Gross Margin 168,876,983 161,285,464
Operating Expenses 102,667,355 134,765,229
Operating Income 66,209,628 26,520,235
Tax expense 25,159,659 10,077,689
Net Income 41,049,969$ 16,442,546$
Cash Flow From Operations
Cash Flow from Operations 108,601,489$ 32,106,800$
-Capital Expenditures (23,500,000) (12,990,336)
-Dividends (2,750,000) (1,250,000)
Free Cash Flow 82,351,489 17,866,464
Cash Flow from Operations 0.91 0.27 1.40
Free Cash Flow 0.69 0.15 1.10
Gross Margin Percentage 25.3% 25.2% 33%
Return on Assets (Net Book Value) 15.7% 6.7% 19%
Return on Equity 38.4% 18.8% 28%
Earnings per Share 1.694$ 0.679$ 2.33$
20–47
20-47 (continued –1)
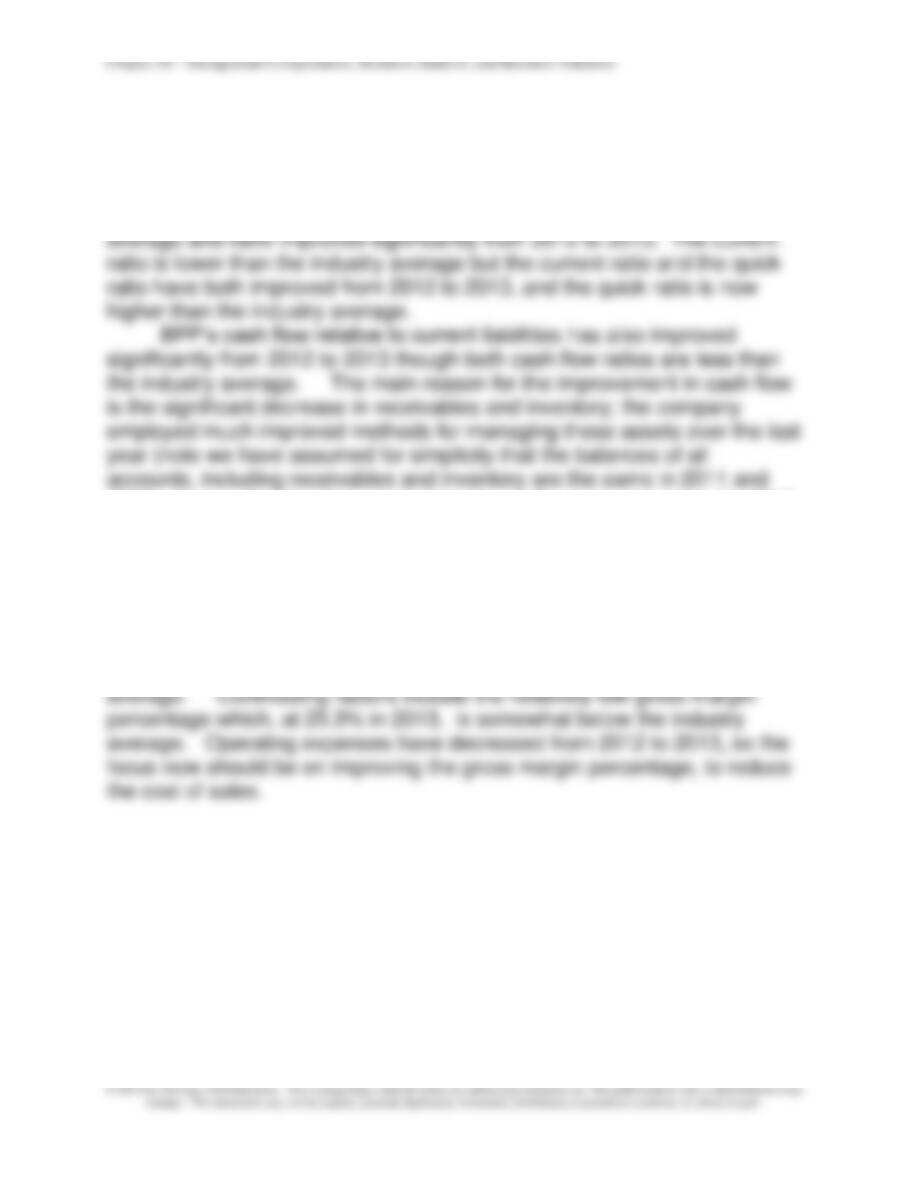
A financial ratio analysis of BPP’s liquidity shows a company that is
improving quite well on all measures. The receivables turnover and
inventory turnover ratios are both significantly better than the industry
2012; the result is that the calculation of cash flow from operation for 2012
has no change for these two current asset accounts). Note also that BPP
increased dividends significantly in 2013, with a negative impact on cash
flow and liquidity. Overall, this shows a mixed but improving picture for
BPP relative to liquidity.
As to profitability, BPP’s ratios have improved significantly from 2012
to 2013. However, return on assets is still lower than the industry
average, while return on equity is now substantially higher than the industry
Chapter 20 – Management Compensation, Business Analysis, and Business Valuation
20-48
20-48 Business Valuation (30 min)
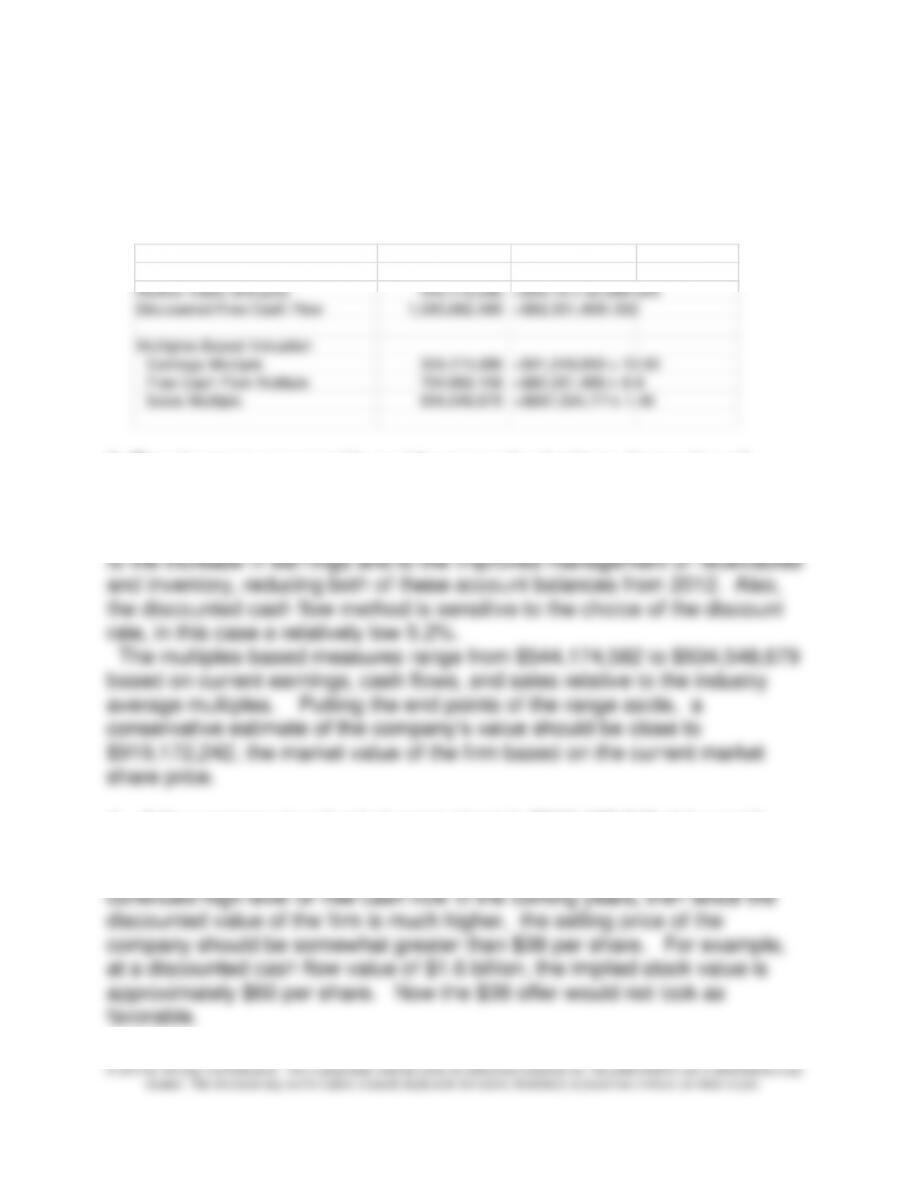
1. & 2. Calculation of book value, market value, discounted cash flow, and
multiples-based values:
2013
Book Value of Equity 125,941,338$
Market Value of Equity 919,172,242 =$35.78 x 25,689,554
Discounted Free Cash Flow 1,583,682,488 =$82,351,489/.052
Multiples–Based Valuation
Earnings Multiple 554,174,586 =$41,049,969 x 13.50
Free Cash Flow Multiple 724,693,106 =$82,351,489 x 8.8
Sales Multiple 934,548,679 =$667,534,771x 1.40
3. The six measures provide a wide range of valuations, from a low of
$125,941,338 for the book value of equity to a high of $1,583,682,481 for
the discounted cash flow method. The discounted cash flow measure is
relatively high because of the significant increase in cash flow in 2013 due
4. If the company is valued at approximately $919,172,242, this would
reflect an expected share price close to its current market value of $35.78.
Thus, the $38 offer looks good. On the other hand, if one projects a
20–49
© 2013 by McGraw-Hill Education. This is proprietary material solely for authorized instructor use. Not authorized for sale or distribution in any
manner. This document may not be copied, scanned, duplicated, forwarded, distributed, or posted on a website, in whole or part.
20–48 (continued – 1)
5. Sustainabllity issues may arise in the acquisition because both GSI
and BPP operate in environmentally sensitive industries. GSI, a retailer
of gardening supplies, must be vigilant about both the manufacturing
practices of its suppliers (to minimize harmful waste products getting into
the environment) and also about the handling of the materials within
GSI’s stores and in its transportation of these materials. Insecticides,
weed killers, fertilizers, and other products can have toxic and/or harmful
chemicals.
Also, the use of BPP plumbing expertise and materials has a
sustainability dimension. If these products are used to supply home or
commercial lawn and garden watering systems, then for sustainability,
Given that many investors now consider sustainability and important part
of a company’s strategic planning, then valuation will also be affected by
whether or not a company such as GSI or BPP have a sustainability
plan. Sustainability efforts are also often tied to cost reduction, as the
company’s efforts to improve sustainability reduce operating costs and
compliance costs. Companies with an effective plan for sustainability
will likely receive higher valuations, as investors and analysts see the
Chapter 20 – Management Compensation, Business Analysis, and Business Valuation
20-50
20-49 Business Analysis and Business Valuation (45 min)
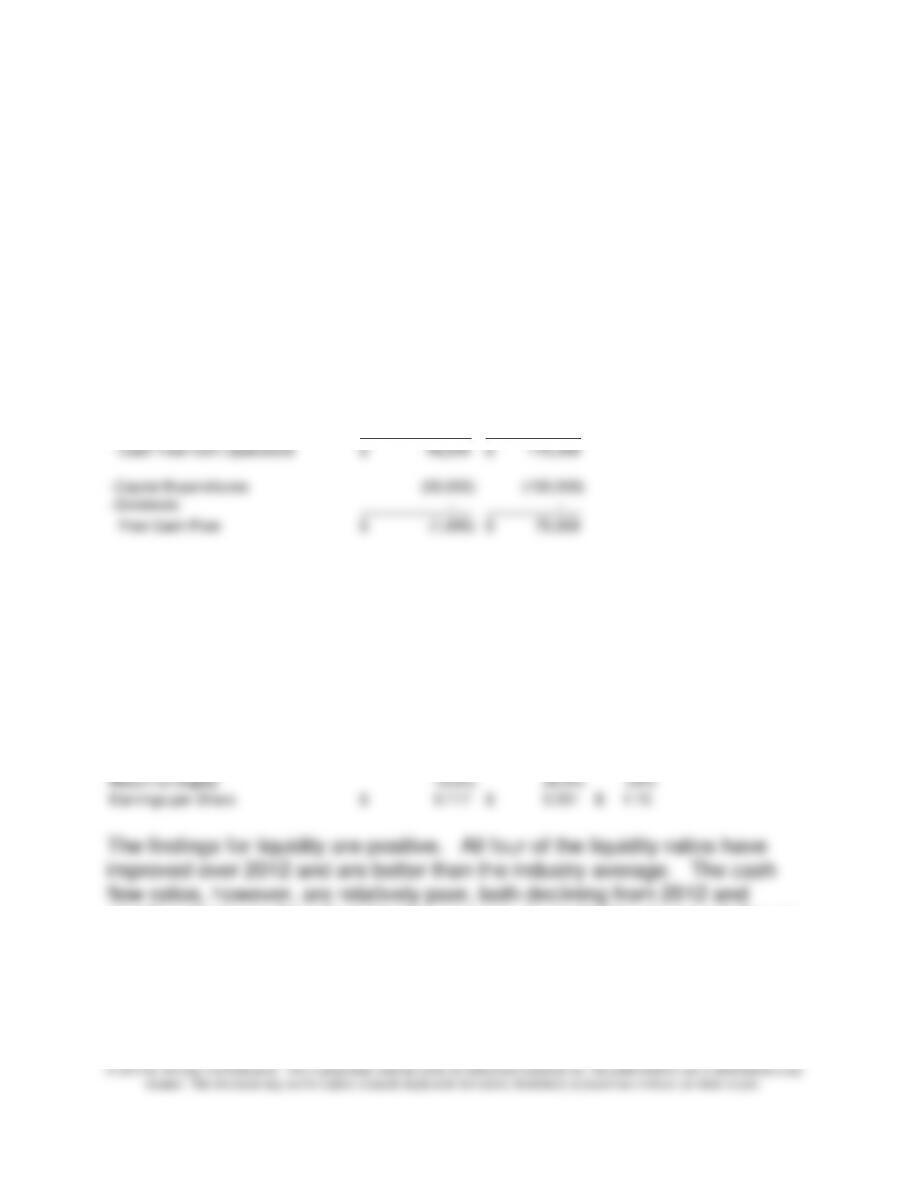
1. First, determine the amount of cash flow from operations and the
amount of free cash flow, assuming that the 2011 and 2012 balance
sheet values are the same. This means that there is no positive or
negative effect in the calculation of cash flow from operations for the
change in inventory or receivables. Second, calculate the financial
ratios. The results are shown below.
Cash Flow From Operations 2013 2012
Net Income 76,783$ 131,362$
Plus Depreciation Expense 42,746 43,997
+Decrease (-inc) in AccRec and Inv (25,960) –
+Increase (-dec) in Cur. Liabl. (45,564) –
Cash Flow from Operations 48,005$ 175,359$
-Capital Expenditures (50,000) (100,000)
-Dividends – –
Free Cash Flow (1,995)$ 75,359$
Financial Ratios 2013 2012 Industry
Accounts Receivable Turnover 43.14 41.73 8.80
Inventory Turnover 8.85 8.24 7.00
Current Ratio 2.95 2.36 2.00
Quick Ratio 2.24 1.85 1.10
Cash Flow Ratios
Cash Flow from Operations 0.22 0.66 1.40
Free Cash Flow (0.01) 0.28 1.10
Gross Margin Percentage 18.8% 23.8% 30%
Return on Assets (Net Book Value) 7.1% 12.3% 18%
Return on Equity 15.6% 28.9% 24%
Earnings per Share 0.117$ 0.201$ 1.15$
significantly lower than the industry average. In particular, free cash flow is
negative in 2013. A key reason for the decline in the cash flow ratios is the
decline in income and the increase in inventory and receivables from 2012
to 2013. The decline in cash flow is a real concern for JJP and should be
given immediate attention.
Chapter 20 – Management Compensation, Business Analysis, and Business Valuation
20–51
20–49 (continued –1)
1. (continued)
The profitability ratios are also poor. They are declining and below
the industry average. In particular, return on equity has fallen to
approximately half of its 2012 value, from 28.9% to 15.6%. This is a
very unfavorable sign for investors and, together with the decline in
cash flow, is a main reason for the decline in stock price from $5.50
should be investigated thoroughly.
2. Six business valuations are calculated below for 2012 and 2013.
2013 2012 Calc for 2013
Book Value of Equity 531,847$ 455,064$
Market Value of Equity 1,529,316 3,594,547 =$2.34 x 653,554
Discounted Cash Flow (35,000) 1,322,088 =$(1,995)/.057
Multiples-Based Valuation
Earnings Multiple 1,612,433 2,758,599 =$76,783 x 21
Free Cash Flow Multiple (17,556) 663,158 =($1,995) x 8.8
Sales Multiple 3,494,401 3,202,395 =$1,588,364*2.2
Note that every valuation measure except for book value of equity
has declined from 2012 to 2013 due to the decrease in cash flow and
the decrease in income. In fact the 2013 valuations based on free
cash flow are negative and therefore are excluded from further
choose a value of approximately $3 million for 2012 because the
sales multiple, market value of equity and earnings multiple are
centered near that point. For 2013, our judgment would be
conservative, given the recent decline in net income and cash flow.
Chapter 20 – Management Compensation, Business Analysis, and Business Valuation
20-52
20-49 (continued -2)
So, we would exclude the sales multiple as an outlier in 2013 and
choose a value close to that of the market value of equity or the
earning multiple, or approximately $1.5 million. This is a drop of
approximately 50% in market value in one year, a serious concern for
JJP.
20-50 Research Assignment; Business Valuation (50in)
1. The authors make the point that a successful business strategy
expert must be a very competent business valuation expert, and vice
versa, and thus, the roles of the two converge. For example, a
environment, together with the company’s strategy for success, will lead
to higher or lower future valuations.
2. The authors cite their research and include example companies to
show that a great product does not necessarily produce a great,
valuable company. The key is the competitive environment and the
3. The explanation here follows that in part 2 above. That is, the
“differences” have to be those differences that the customers are willing
4. The explanation here follows from the above. A great product does
20–53
© 2013 by McGraw-Hill Education. This is proprietary material solely for authorized instructor use. Not authorized for sale or distribution in any
manner. This document may not be copied, scanned, duplicated, forwarded, distributed, or posted on a website, in whole or part.
Investors may see for example the same level of cash flows in Company
A as in Company B in the current year, but have different expectations
for the future of those cash flows. If investors are predicting that
Company A’s cash flows will continue and/or grow with greater certainty,
then it is likely that Company A will also have the higher stock price,
even if all of the financial performance measures are identical. The role
of investor expectations is critical. This role is often measured by the
Price-Earnings ratio, or ”earnings multiple” as explained in the chapter.
5. Substantial growth can lead to financial difficulties, as can be seen in
the poor financial performance of many financial and construction firms’