Chapter 20 – Management Compensation, Business Analysis, and Business Valuation
20–31
20–39 (continued -1)
2. [Operating Income – (.06 x Invested Assets)] x .10 = Bonus
Amount
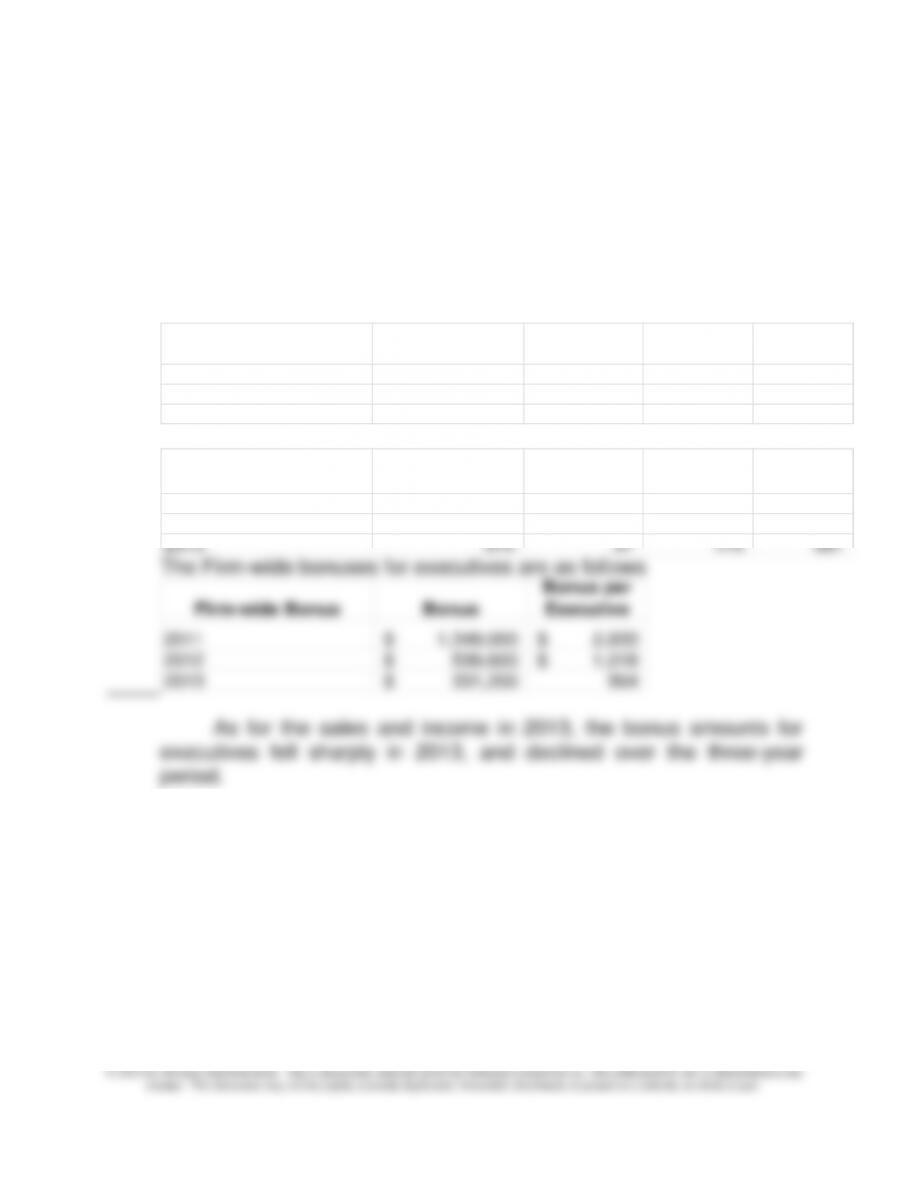
The total bonuses for each division and in total are determined as
follows:
Total Bonus
Consumer
Electronics
Office
Supplies
Computers Total
2011 1,167,700 75,000 106,300 1,349,000
2012 407,300 102,600 29,700 539,600
2013 94,300 108,000 128,900 331,200
And given the number of executives:
Number of Executives
Consumer
Electronics
Office
Supplies
Computers Total
2011 300 40 120 460
2012 350 40 140 530
2013 375 37 175 587
Chapter 20 – Management Compensation, Business Analysis, and Business Valuation
20–32
20-39 (continued –2)
3.
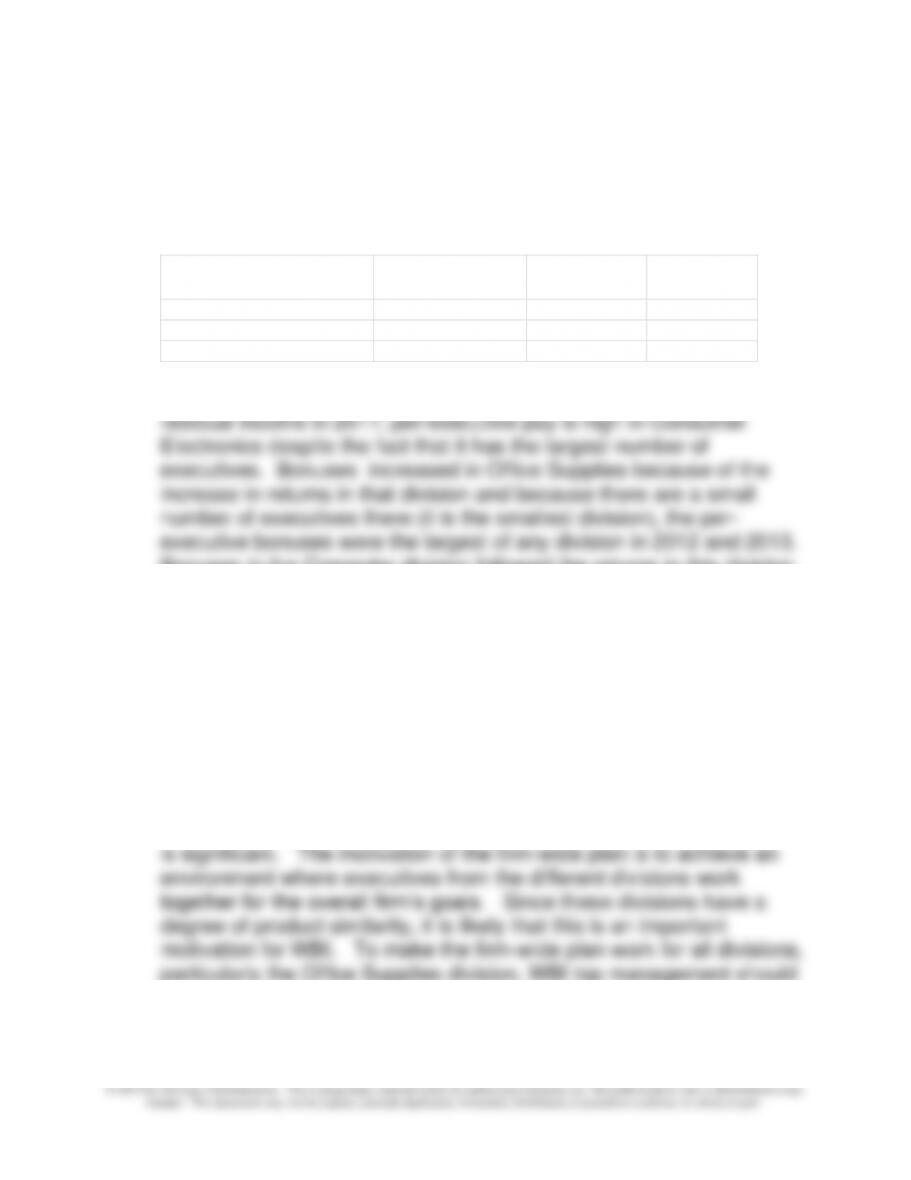
When bonuses are determined on a division-based method, the
results are as follows:
Division-based Bonus
per Executive
Consumer
Electronics
Office
Supplies
Computers
2011 3,892$ 1,875$ 886$
2012 1,164 2,565 212
2013 251 2,919 737
Bonuses per executive were largest for consumer electronics in 2011
because this division, the largest, generated the largest amount of
Bonuses in the Computer division followed the returns in this division,
down in 2012 and up again in 2013; overall the bonuses are smallest
in this division because of the relatively large, and increasing number
of executives in this division.
4.
Comparing the results for the three divisions in parts 2 and 3, it is
clear that the consumer electronics division managers would benefit
from the division-based plan based in 2012, while the Office Supplies
division would benefit in 2012 and 2013.
The contrast between the firm-wide and division-based bonus plans
work to make the opportunities for cross-division profit clear.
Chapter 20 – Management Compensation, Business Analysis, and Business Valuation
20–33
20–39 (continued -3)
Pros: The company-wide bonus plan promotes the sharing of
corporate-wide assets. The bonus plan also helps to keep talented
20–34
20-40 Compensation; Strategy (25 min)
For companies with substantial growth opportunities or long
product life cycles, bonus plans based on short-term decisions may
not adequately reflect long-term consequences of managerial
decisions.
options to be paid off.
MBI may want to consider granting stock options where the
exercise price is adjusted with the appreciation of an industry index.
This will allow MBI to reward executives for an increase in the value
of their stock relative to that of companies facing similar risks.
future. This would minimize the chance that executives would
increase current performance measures at the expense of damaging
future performance.
Developing effective compensation plans is more difficult for
multinational companies such as MBI because foreign currency
frequently managers of foreign SBUs are able to protect their unit
from unfavorable currency fluctuations by carefully chosen
purchasing, sales, and financing practices.
Chapter 20 – Management Compensation, Business Analysis, and Business Valuation
20–35
20-41 Executive Compensation; Teams; Strategy; Ethics (30
min)
1. Universal should use the new measures to improve product
quality and customer satisfaction.
a. At least three customer value-added measures for Universal Air
Inc. include the following:
• Availability of products to meet customer needs on a timely
basis.
b. At least three process-efficiency measures for Universal include
the following:
• New product development time and introduction time to market.
activities.
2. At least three types of employee behavior that Universal Air Inc.
can expect by having middle management participate in the
development of the second set of new performance measures include
the following:
• Increased job satisfaction and morale, as well as a feeling of
3. To ensure that the cross-functional teams are effective, the
executive management at Universal Air Inc. needs to provide:
• the necessary resources, including people and money
•
Chapter 20 – Management Compensation, Business Analysis, and Business Valuation
20–36
20–41 (continued –1)
functional managers and team members, and support for the
implementation of team-suggested changes.
4. Referring to the specific standards (competence, confidentiality,
integrity, and credibility) in the Institute of Management Accountants
Statement on Ethical Professional Practice, John Brogan’s behavior
is unethical for the following reasons:
Competence
• Brogan is undermining the preparation of complete and clear
reports.
Confidentiality
Credibility
Brogan did not:
• communicate information fairly and objectively disclose fully
all relevant information.
20–37
20-42 Executive Compensation (30 min)
1. a. The benefits to Jensen Corporation of a profit participation
incentive plan for the Hobbit Hole’s restaurant unit managers include
the following:
• Increased employee interest in, and motivation toward the
economic success of the company, leading to goal congruence
between the managers and Jensen. This could include improved
b. The negative behavioral problems that could occur with the
profit participation incentive plan for Hobbit Hole restaurant unit
managers include the following:
• Greater emphasis placed on short-term rather than long-term
objectives. This could have a negative impact on the company in
the long term if items such as capital expenditures are delayed to
problems.
2. a. The advantages to Jensen Corporation from having the motel
unit managers of Cruise and Snooze Inns participate in an incentive
plan based on goal attainment include the following:
• Improved employee motivation and ownership of the goals could
result since the unit managers have participated in establishing the
20–38
20–42 (continued -1)
b. The disadvantages to Jensen Corporation from having an incentive
plan based on goal attainment for the motel unit managers of Cruise and
Snooze Inns include the following:
• There may be a perceived lack of management objectivity or fairness
if goals are not consistent among individuals. Employees could
reach the goals.
3. a. The behavioral problems that could arise for Jensen Corporation
by having two different types of incentive plans for Hobbit Hole and
Cruise and Snooze Inns may be that unit managers may complain and
ask why their bonuses cannot be calculated like the other division’s. For
example, Hobbit Hole managers may request to be evaluated on items
other than just profitability.
b. The rationale that Jensen Corporation can give to the unit
managers of Hobbit Hole and Cruise and Snooze Inns to justify having
different incentive plans for the two divisions include the following:
• The goals of the two businesses may be different, and therefore
should be measured on different criteria in order to maintain goal
• The two divisions may have different incentive plans that are each an
accepted practice in their own industry.
Chapter 20 – Management Compensation, Business Analysis, and Business Valuation
20–39
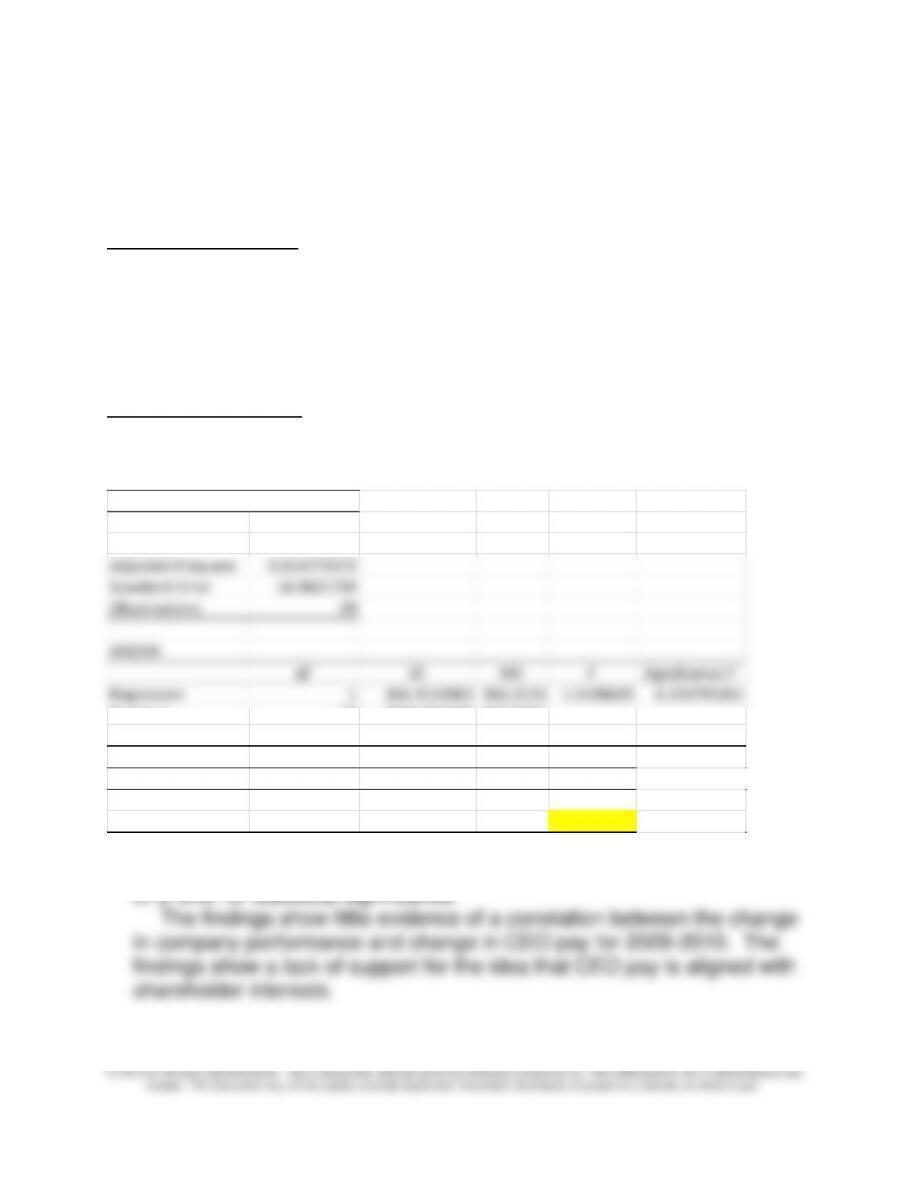
20-43 Compensation; Regression Analysis (40 min)
The results are shown below:
Correlation Analysis:
Correlation between executive pay and company performance is .223518
which is not statistically significant at the .10 level. While the direction of
the correlation is in the expected positive direction, there is no indication
from this data that there is a significant relationship between pay and
performance.
Regression Analysis:
A regression analysis with company performance (measured by stock
return) as the dependent variable and CEO pay as the independent
variable produce the following results:
Regression Statistics
Multiple R 0.223517854
R Square 0.049960231
Adjusted R Square 0.014773573
Standard Error 16.0621739
Observations 29
ANOVA
df SS MS F Significance F
Regression 1 366.3153062 366.3153 1.4198629 0.243795201
Residual 27 6965.822625 257.9934
Total 28 7332.137931
Coefficients Standard Error t Stat P-value
L
Intercept 19.17308552 3.422222448 5.602525 6.066E-06
Compensation 0.05103919 0.042833204 1.19158 0.24380
The above regression results confirm the correlation results shown
above. The p-value for the compensation variable is .2438, well short
Chapter 20 – Management Compensation, Business Analysis, and Business Valuation
20–40
Source: Pradnya Joshi, A Rich Year and More to Come,” The New York
Times, April 10, 2011, p. B7.
20-44 Compensation; Regression Analysis (20 min)
1. Given the available information, the most reliable regression appears to
be regression one, as it has the highest R squared. Regression three is
next best, and regression two is poor, an R squared of only 11%
2. The regressions have some common patterns:
• return on assets (ROA) is not a significant predictor of CEO pay for
any of the dependent variables.
• stock price volatility is significant at the lower level of reliability (.05) in
consistent with the expectation that lower levels of ownership require
stronger incentives, and thus higher CEO pay.
There are mixed results for the remaining variables, passenger load,
CEO tenure, and book to market value. These variables are not
significant in at least one of the regressions, indicating there is
potentially some relationship there but the nature of the relationship
depends on the dependent variable chosen, and that further analysis
would be necessary to understand the nature of the relationships
between these variables and CEO pay.
3. The principal goal of the study was to identify a potential relationship
between non-financial performance, as measured by passenger load, and
note that since many of the carriers included in the study were in financial
20–41
20–44 (continued -1)
distress at the time of the study, the presence of this distress may have
influenced the overall results.
4. The answers here could vary widely. One observation is that the
information is applicable only to the airline industry, and the results might
not be generalizable to other industries. Clearly the results indicate that
464.
Chapter 20 – Management Compensation, Business Analysis, and Business Valuation
20-42
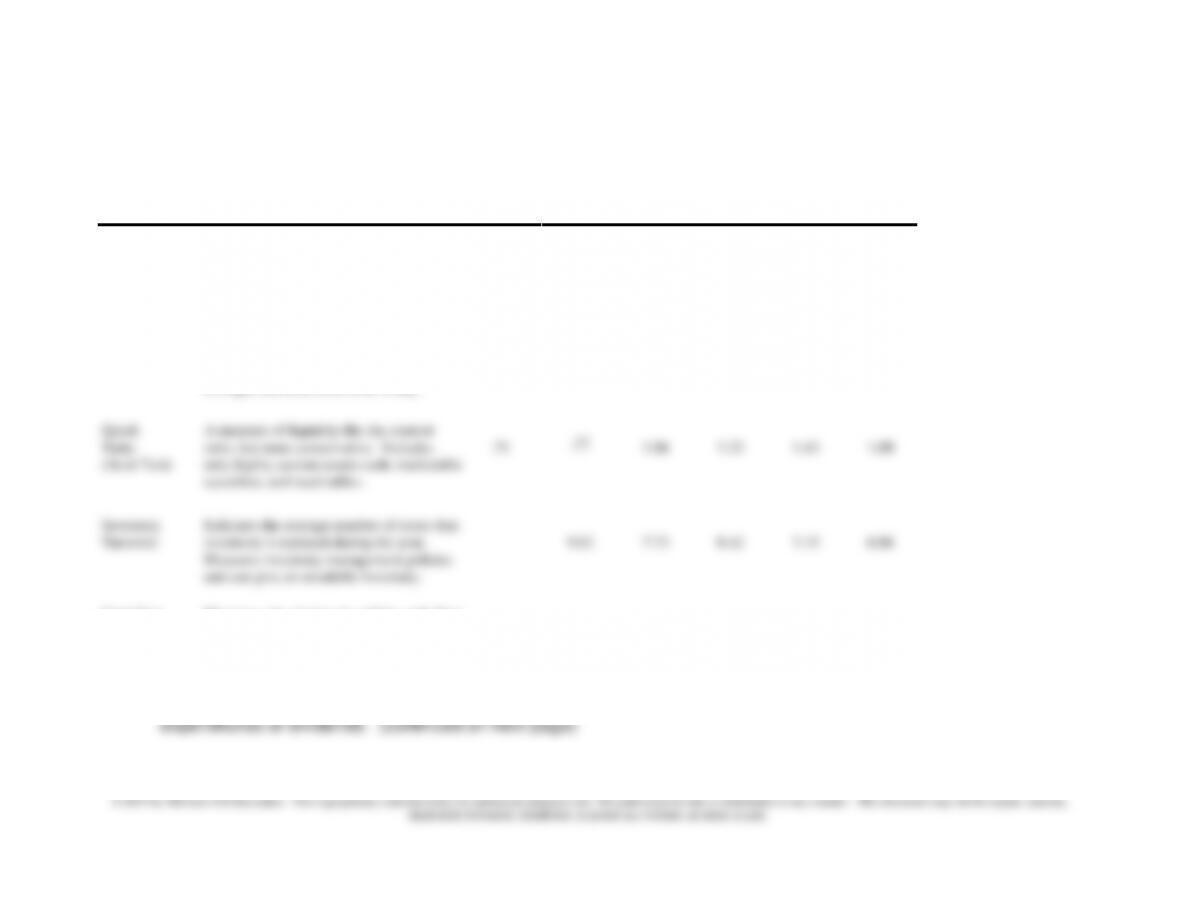
20-45 Business Analysis (45 min)
The following shows the ratios and an interpretation for each ratio.
a. Liquidity
Ratios
Relevance
2008
2009
2010
2011
2012
2013
A/R
Turnover
The average number of times per yr. net
receivables turn into cash. Indicates
effectiveness of credit policy and
collections. Should be compared to prior
years and to industry averages.
7.48
7.44
8.09
6.92
7.88
Current
Ratio
An important measure of liquidity. Should
be compared to prior years, industry
averages and debt restriction, if any.
1.01
1.23
1.66
1.92
2.23
1.90
Quick
Ratio
(Acid Test)
A measure of liquidity like the current
ratio, but more conservative. Includes
only highly current assets-cash, marketable
securities, and receivables.
.71
.77
1.06
1.23
1.43
1.09
Inventory
Turnover
Indicates the average number of times that
inventory is replaced during the year.
Measures inventory management policies
and can give an unsalable inventory.
9.62
7.73
8.42
7.15
6.86
Cash flow
ratio
Measures the degree to which cash flow
from operations covers the amount of
current liabilities
.11
.25
.61
.42
.53
Note: The free cash flow ratio is not calculated because information is not provided in the problem re: capital