Chapter 20 – Management Compensation, Business Analysis, and Business Valuation
20–16
20-28 Compensation and Trust (15 min)
This question is intended primarily for class discussion or for a short written
project. The answers are likely to vary. I would have the class discussion
include the following points for each of the two parts of the requirements.
1. Many of the six points George makes can be summarized in the
concept that executive pay should be based on longer-term
measures than the annual profit and revenue-based approaches that
are now commonly used. Some would argue that stock price is an
effective measure since it is aligned with shareholders’ interests. A
investments for their funds.
So the question should be, “Why should an executive be
rewarded for an increase in stock price that is due to these broad
economic changes?” Compensation based on longer-term and
multiple-base measures of financial and nonfinancial performance
would help to bring more fairness. Also, it could help managers’
motivation to be more aligned with the key success factors
(innovation, customer loyalty,…) of the company and have the
patience to see their efforts to improve these measures ultimately pay
off in financial performance.
2. Answers will vary on this point. I would point out that nonfinancial
measures such a customer service, quality, and innovation should be
rewarded in some way since they are often the means to long-term
Chapter 20 – Management Compensation, Business Analysis, and Business Valuation
20–17
20-28 (continued-1)
a. Don’t forget debt. Make sure that the executive compensation
plan includes in some way the valuation of the company’s debt.
This reflects the executives’ responsibility to creditors and also
provides an incentive for the executive to manage risk more
research which suggests that including debt in executive
compensation will manage this risk and should lead to lower
interest cost for the company, a benefit to shareholders.
b. Require a long term before executives can cash in on stock
options – a really long time. For example, have them wait
effectiveness of the stock award incentive. The outcome is
that the executive maintains the required “skin in the game.”
The often chosen alternative of re-pricing stock options rewards
the executive for the falling stock price.
An important consideration, irrespective of the compensation plan chosen,
is to retain a compensation policy that attracts, retains, and effectively
motivates the best quality managers.
Source: Bill George, “Executive Pay: Rebuilding Trust in an Era of Rage,”
Bloomberg Businessweek, September 13, 2010, p. 56; Alex Edmans, “
How to Fix Executive Compensation,” The Wall Street Journal, February
27, 2012, pp. R1-2.
Chapter 20 – Management Compensation, Business Analysis, and Business Valuation
20–18
20–29 Compensation at Non-public Companies (15 min)
1. The advantage of equity based compensation is that it aligns
2. A recent survey by Deloitte Development LLC found that nonpublic
firms are adding long-term incentive programs to their compensation
plans. The reason for the change to long-term incentives is to
achieve the desired alignment of managers’ incentives with those of
20–19
20–30 Compensation in Tough Economic Times (15 min)
A survey by outplacement firm Challenger, Gray & Christmas [sic] reports
that 20% of companies are scaling back on perks and another 10% are
considering it. The perks most likely to go are travel related, since these
are the most costly. Other companies are cutting back on free cafeteria
service (Google), free masseuse service (a Los Angeles law firm),
company parties (Viacom), dinner and cab fare allowances (Goldman
and the extra paid is intended to cover the tax the executive must pay for
receiving the benefit. The practice is called “gross up” payments. A
survey in 2010 showed this practice to be diminishing.
Other possible answers include reduction in health care coverage or
reduction in contributions to 401(k) plans. The difficulty here is that these
are key benefits for many managers and there should be a clear
recognition of the dire need for the cutbacks for the managers to accept the
Chapter 20 – Management Compensation, Business Analysis, and Business Valuation
20–20
20-31 International Accounting Standards and Bonus Compensation
(20 min)
The move from GAAP to IFRS will likely have wide-ranging effects and
present a great deal of uncertainty to CFOs and others involved in the
development of management bonus compensation plans. Current bonus
contracts are written for GAAP and tax considerations are based on
U.S./GAAP-based taxable income. Compensation plans would have to be
revised to incorporate the expected changes in the financial statements as
a result of the change to IFRS. Some things to note in the discussion for
this question:
1. Many global companies are likely to benefit from the move to IFRS as
it would provide the company with a single set of standards which are
used worldwide. Therefore, reporting entities in different countries
around the world would likely have the same accounting procedures
and policies (since IFRS are permitted or required in 122 countries
2. A related benefit for companies is that the comparability of managers’
performance evaluation reports (cost center, profit center, or
investment center) would be improved. After the convergence from
3. Those companies that had designed special in-company performance
measures using for example variable-costing principles or lean-
accounting principles, may have already achieved the desired level of
Chapter 20 – Management Compensation, Business Analysis, and Business Valuation
20–21
20-31 (continued –1)
4. A down-side to the switch to IFRS is that companies will have to
study the IFRS carefully and determine for example whether the
company will use the “cost model” or the “revaluation model” for long–
lived assets, both of which models are permitted under IFRS. The
cost model is based on purchase cost less depreciation or
preserve comparability among units. As GAAP is a “cost model” type
of accounting, it is likely that many U.S. companies will choose the
cost model.
5. Another down-side to the switch to IFRS is the period of training and
confusion that is likely to take place after the convergence. It will
take some time for financial staffs of the U.S. global corporations to
become proficient at the new accounting standards. Offsetting this
concern is that fact that the FASB and the IASB have in recent years
and to develop the required expertise for IFRS.
Useful reference:
IASB.org (http://www.ifrs.org/Home.htm)
Chapter 20 – Management Compensation, Business Analysis, and Business Valuation
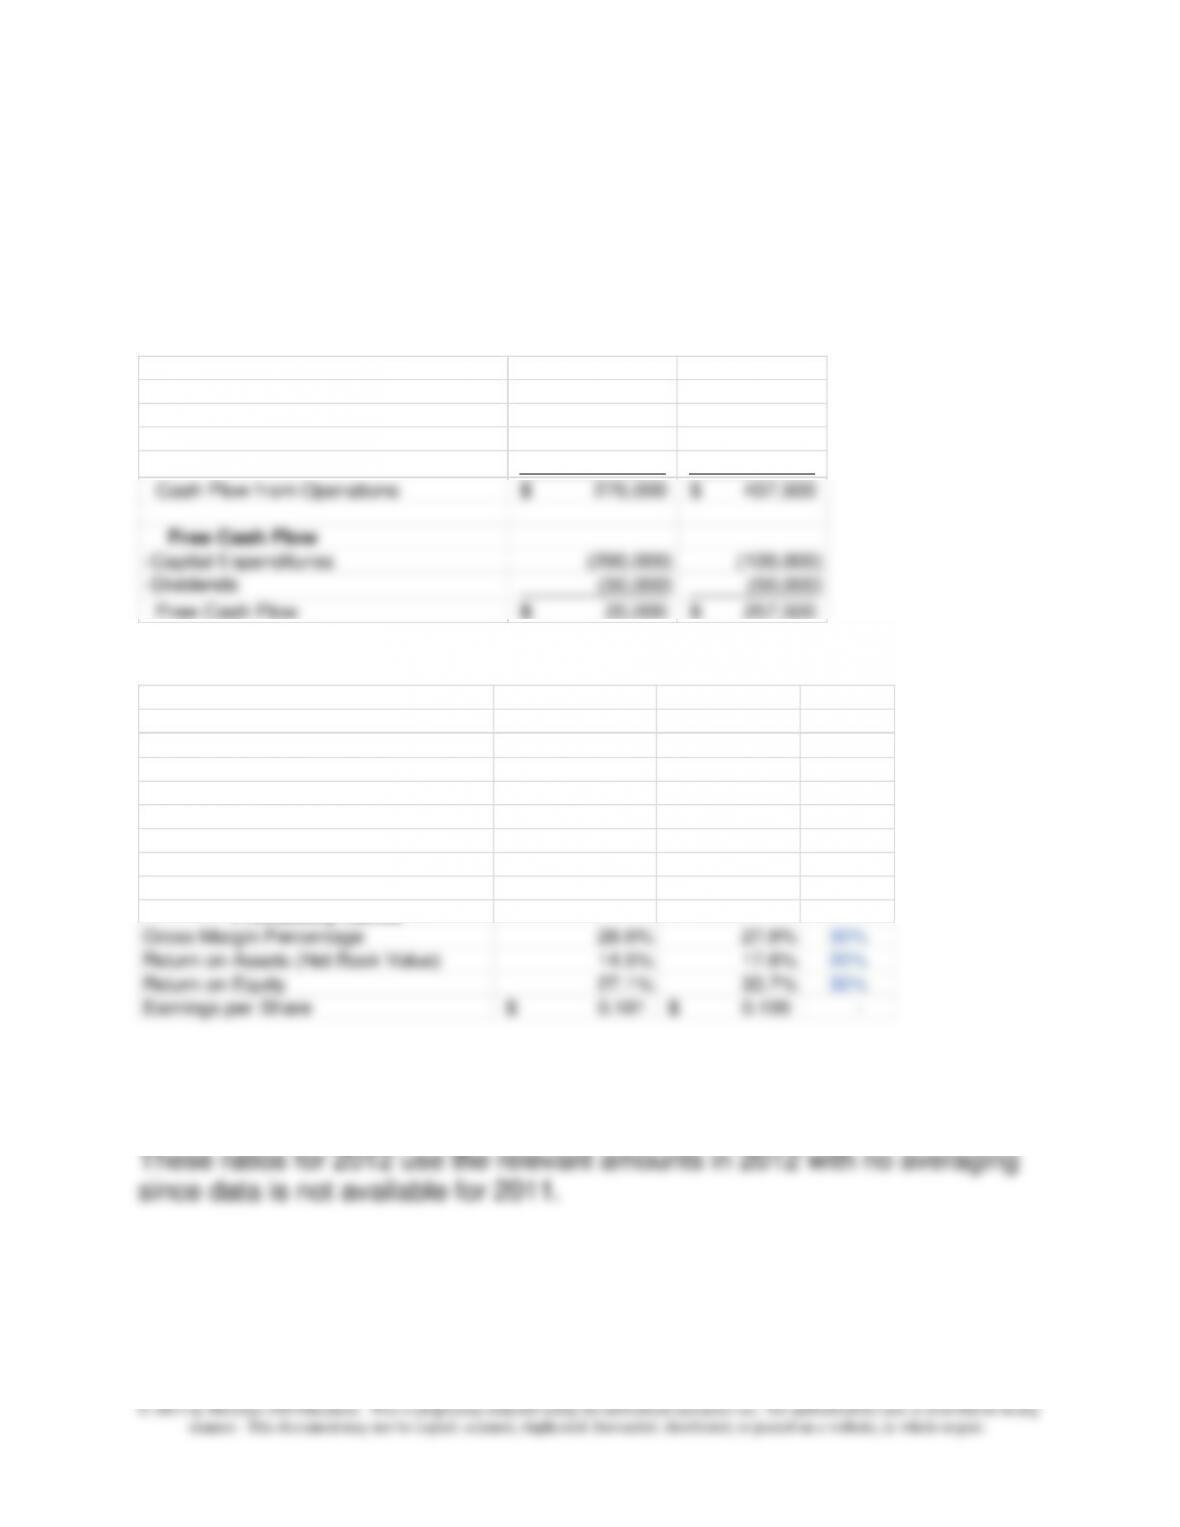
20-32 Business Analysis (30 min)
The financial ratios are shown below:
First, the calculation of free cash flow.
Cash Flow From Operations 2013 2012
Net Income 325,000$ 357,500$
Plus Depreciation Expense 60,000 50,000
+Decrease (-inc) in AccRec and Inv (135,000) –
+Increase (-dec) in Cur. Liabl. 25,000 –
Cash Flow from Operations 275,000$ 407,500$
Free Cash Flow
-Capital Expenditures (200,000) (100,000)
-Dividends (50,000) (50,000)
Free Cash Flow 25,000$ 257,500$
The ratios are as follows:
Financial Ratios 2013 2012 Industry
Liquidity Ratios
Accounts Receivable Turnover 18.67 16.00 11.10
Inventory Turnover 8.93 14.86 10.50
Current Ratio 3.98 3.06 2.30
Quick Ratio 2.05 2.06 1.90
Cash Flow Ratios
Cash Flow from Operations 1.38 2.33 1.20
Free Cash Flow 0.13 1.47 1.10
Profitability Ratios
Gross Margin Percentage 28.6% 27.8% 30%
Return on Assets (Net Book Value) 14.5% 17.6% 20%
Return on Equity 27.1% 33.7% 30%
Earnings per Share 0.181$ 0.199$ –
The turnover ratios and the return on assets and return on equity ratios for
2013 use the average of the 2013 and 2012 balances in the denominator.
Chapter 20 – Management Compensation, Business Analysis, and Business Valuation
20–23
20-32 (continued –1)
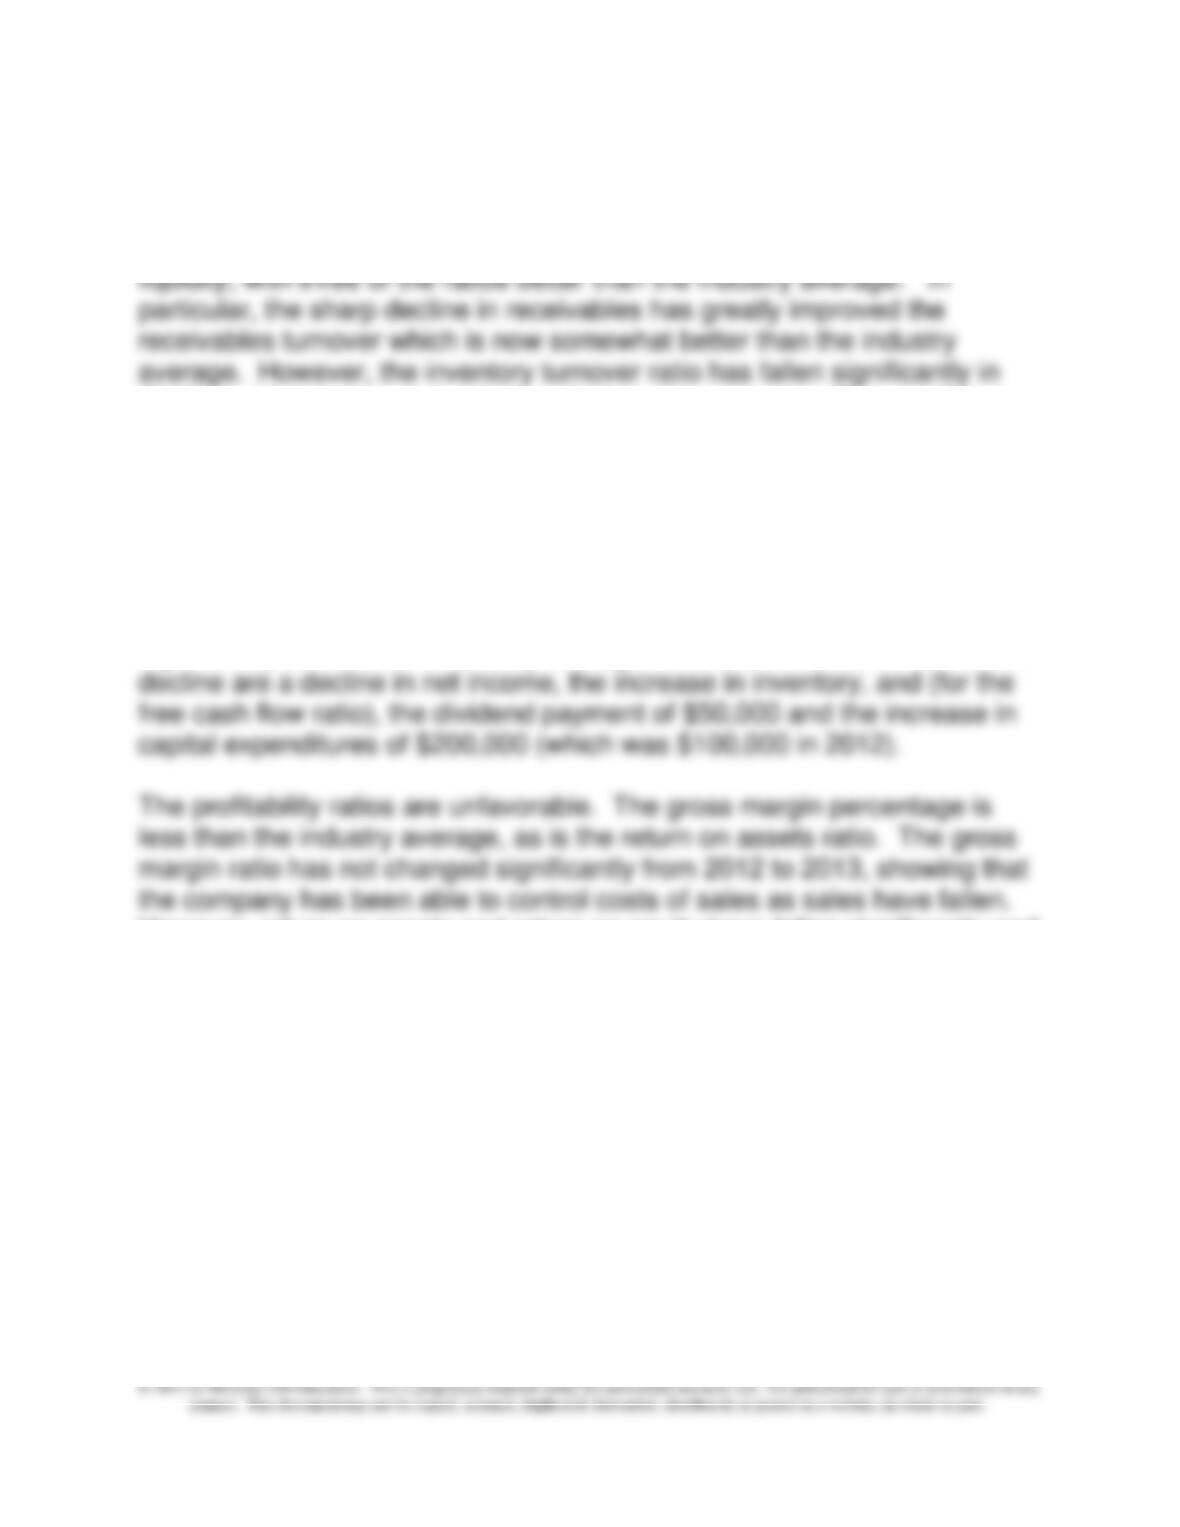
The financial ratios for Williams Company show good performance on
2013, and is now somewhat below the industry average. The significant
increase in inventory should be investigated; what portion, if any, of the
inventory is obsolete or unsalable? Management should check to make
sure that purchasing and inventory management procedures are being
maintained properly and that the trend of declining inventory turnover does
not continue.
The cash flow ratios have declined and the free cash flow ratio is now
significantly less than the industry average in 2013; the reasons behind the
However, return on assets and return on equity have fallen significantly and
are less than the industry average. A major contributor to the falling
returns is the falling sales and increase in operating expenses in 2013.
Chapter 20 – Management Compensation, Business Analysis, and Business Valuation
20–24
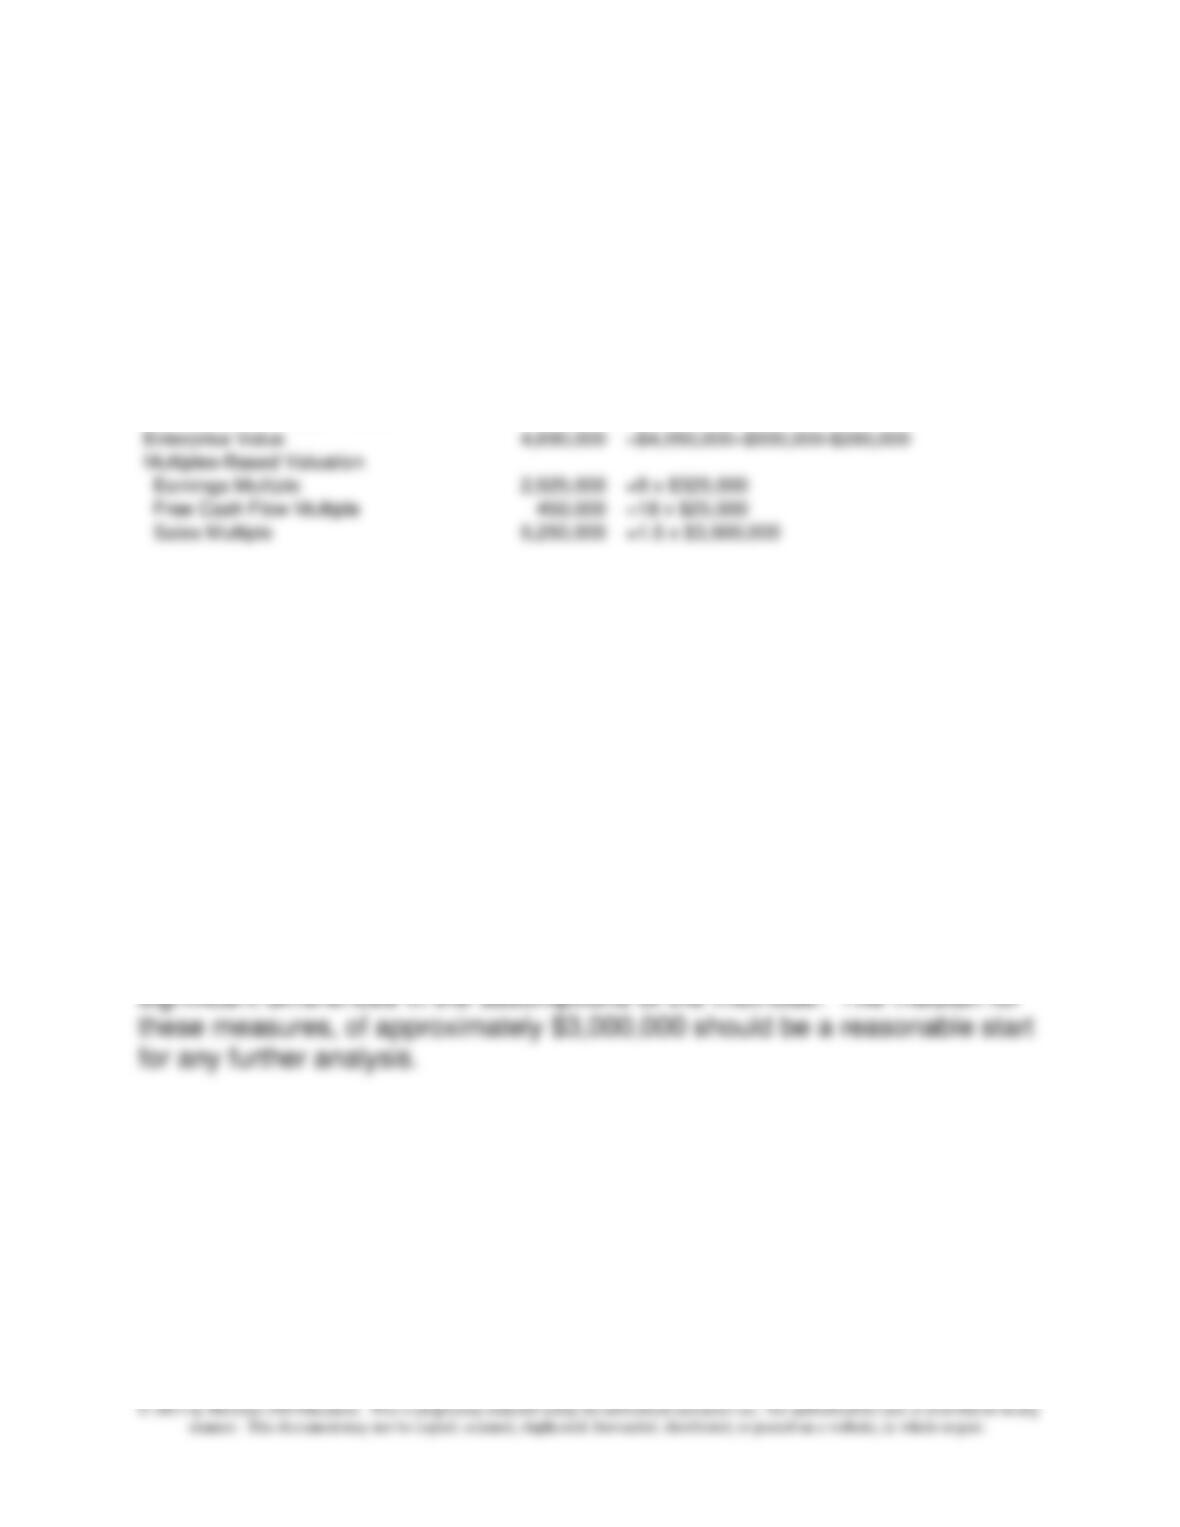
20-33 Business Valuation (30 min)
The book value of equity, market value of equity (market capitalization),
discounted cash flow, enterprise value, and multiples-based valuations for
Williams Company for 2013 are shown below.
Book Value of Equity 1,335,000$
Market Value of Equity 4,050,000 = $2.25 x 1,800,000
Discounted Free Cash Flows 500,000 =$25,000 x (1/.05)
Enterprise Value 4,690,000 =$4,050,000+$900,000-$260,000
Multiples-Based Valuation
Earnings Multiple 2,925,000 =9 x $325,000
Free Cash Flow Multiple 450,000 =18 x $25,000
Sales Multiple 5,250,000 =1.5 x $3,500,000
The book value of equity is taken from the balance sheet, while the market
value of equity is calculated from the product of the total shares
outstanding at year-end times the year-end share price.
The DCF valuation is based on the assumption that free cash flows will
continue indefinitely, so that the discount rate used is the reciprocal of the
cost of capital, or 1/.05.
The multiples-based valuations utilize the industry average multiples times
Williams’ earnings, free cash flow and sales.
Overall, the valuations range from $450,000 to $5,250,000, a significant
range. A wide range of different values is not unusual, however, given the
Chapter 20 – Management Compensation, Business Analysis, and Business Valuation
20–25
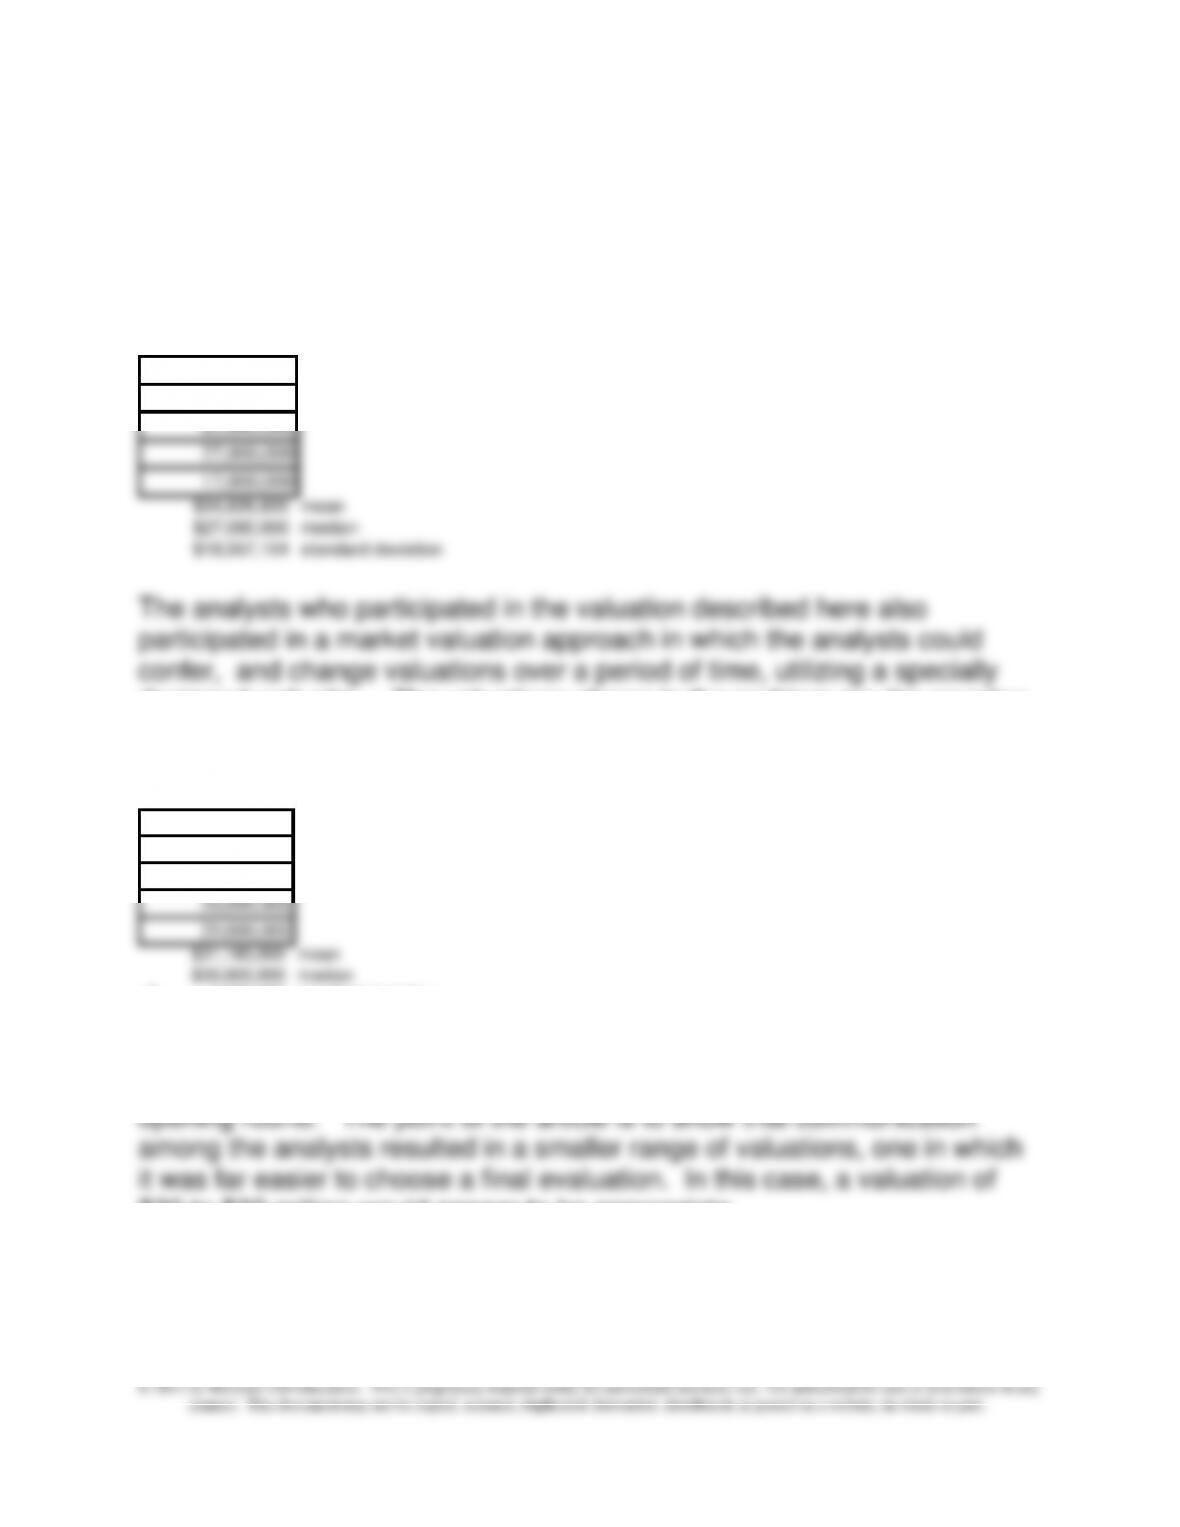
20-34 Business Valuation (15 min)
The simple mean and median for the data are shown below; the standard
deviation is $18,557,104. A number of choices for the final valuation are
possible. A choice within the range of the mean and the median,
$34,826,800 and $27,000,000 would be reasonable.
$26,331,000
38,803,000
65,000,000
27,000,000
17,000,000
$34,826,800 mean
$27,000,000 median
$18,557,104 standard deviation
The analysts who participated in the valuation described here also
participated in a market valuation approach in which the analysts could
confer, and change valuations over a period of time, utilizing a specially
designed web site. The valuations shown in the problem are the opening
valuations in this approach; later adjustments by each analyst, through
participation in the web site, resulted in a much smaller range of valuations:
$26,900,000
30,000,000
40,000,000
30,000,000
29,000,000
$31,180,000 mean
$30,000,000 median
5,090,383$ standard deviation
The standard deviation of the final round of evaluation, shown above, was
$5,090,383, much smaller than the $18,557,104 standard deviation of the
$30 to $32 million would appear to be appropriate.
Source: Peter Leitner, “Measure Twice, Cut Once,” Strategic Finance,
September 2005, pp. 27-32.
Chapter 20 – Management Compensation, Business Analysis, and Business Valuation
20–26
PROBLEMS
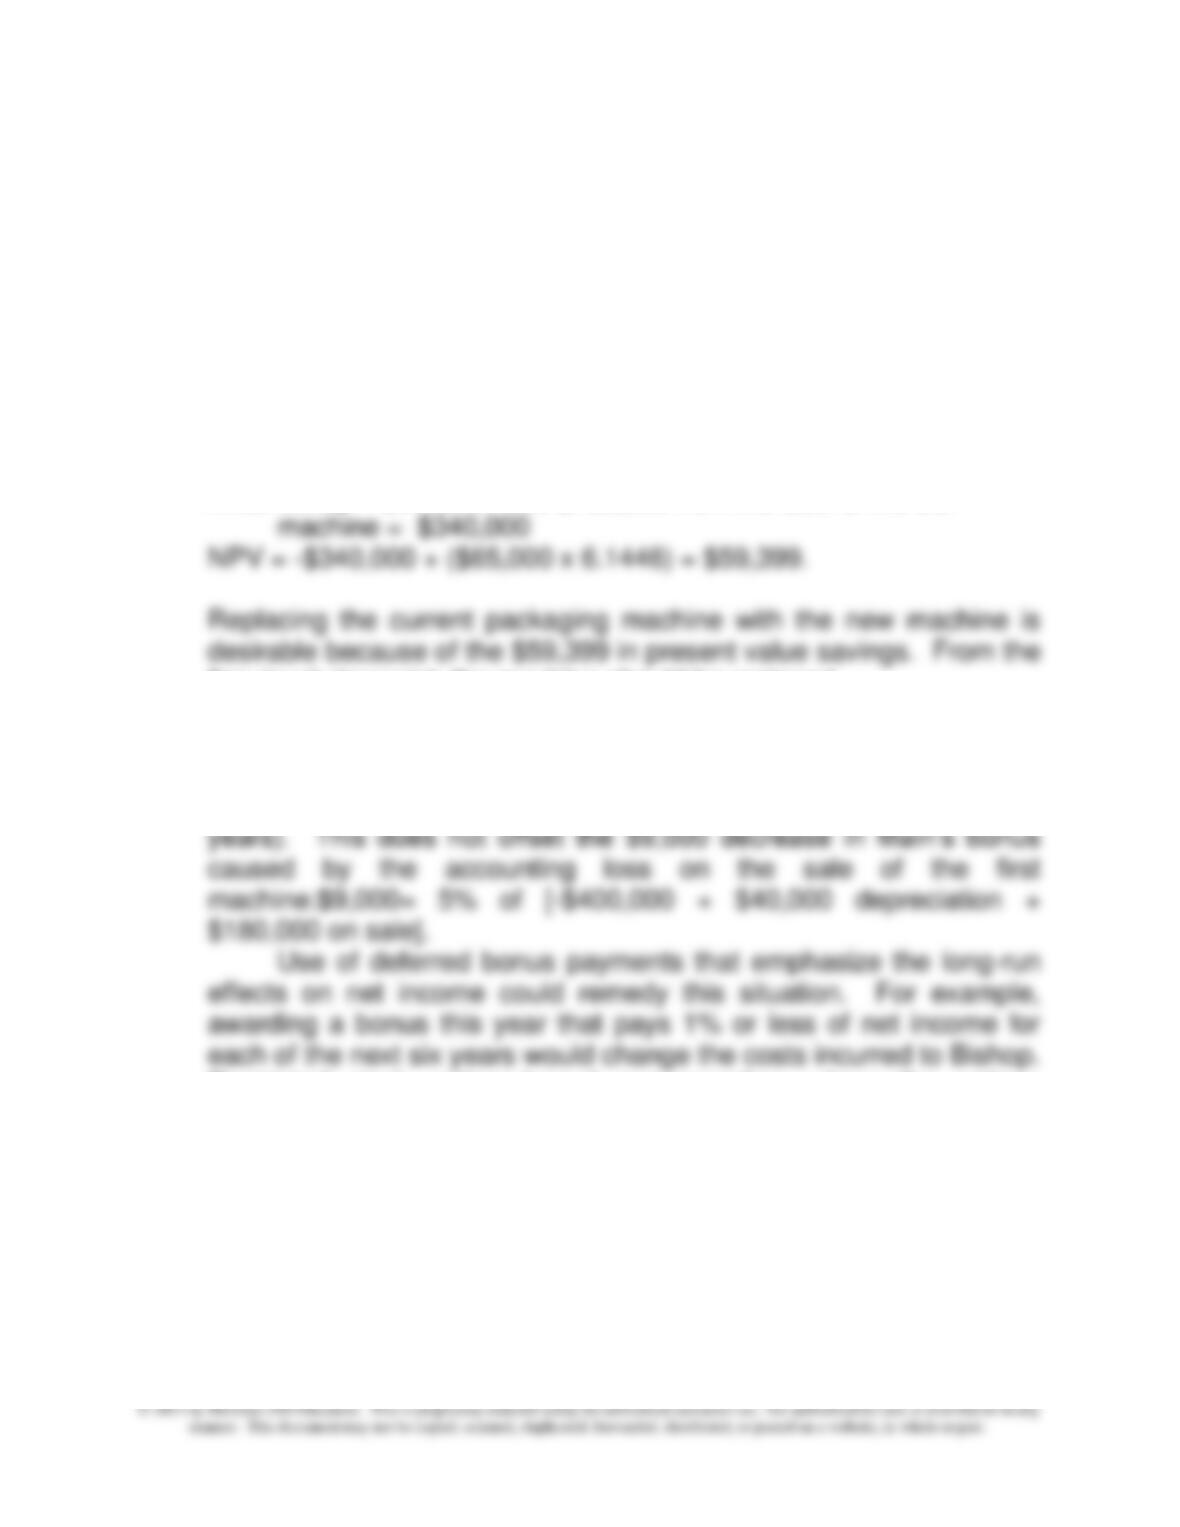
20-35 Compensation; Net Present Value (25 min)
This problem utilizes net present value concepts.
1. Annuity factor for 10 years at 10% is 6.1446
Annual savings from lower operating costs
= $95,000 – $30,000 = $65,000
Initial outlay = $520,000 less $180,000 from the sale of the old
firm-level viewpoint, the machine should be replaced.
2. Brian expects to be with Glee for two more years. Thus the
rewards to him (from his 5% bonus) of the increases in net income
caused by the lower operating costs are $6,500 = (5% of $65,000 x 2
Restricted stock options-based compensation, where the options
must be exercised in future years, would also cause Bishop to think
about the long-run effects of his decision.
Chapter 20 – Management Compensation, Business Analysis, and Business Valuation
20–27
20-36 Compensation; Benefits; Ethics (20 min)
1. The multiple levels of perquisites is a common practice and one
that is well understood and accepted. However, firms are obliged in
ethics, equity and fairness to all employees and to the shareholders
to make decision regarding perquisites on a reasonable basis. The
amount of perquisites should be associated with the responsibilities
firm.
Moreover, it is becoming more common for top level managers
to forego the excesses of many managers of the past, and they have
been rewarded by appreciation of shareholders and improved loyalty
and commitment of their employees.
2. Some of the instances described in the problem are probably
within the firm’s guidelines as acceptable use of perks. Often the firm
will pay for the spouse of an executive to accompany him or her on a
trip where the presence of the spouse is appropriate and in keeping
Management Accountants.
The firm’s policies about perks should be clear and fair and
somewhat detailed, so that issues such as these are not handled
“after the fact,” but rather each manager knows the policies about
perks, and can avoid potentially unethical actions such as those
described in the problem.
Chapter 20 – Management Compensation, Business Analysis, and Business Valuation
20–28
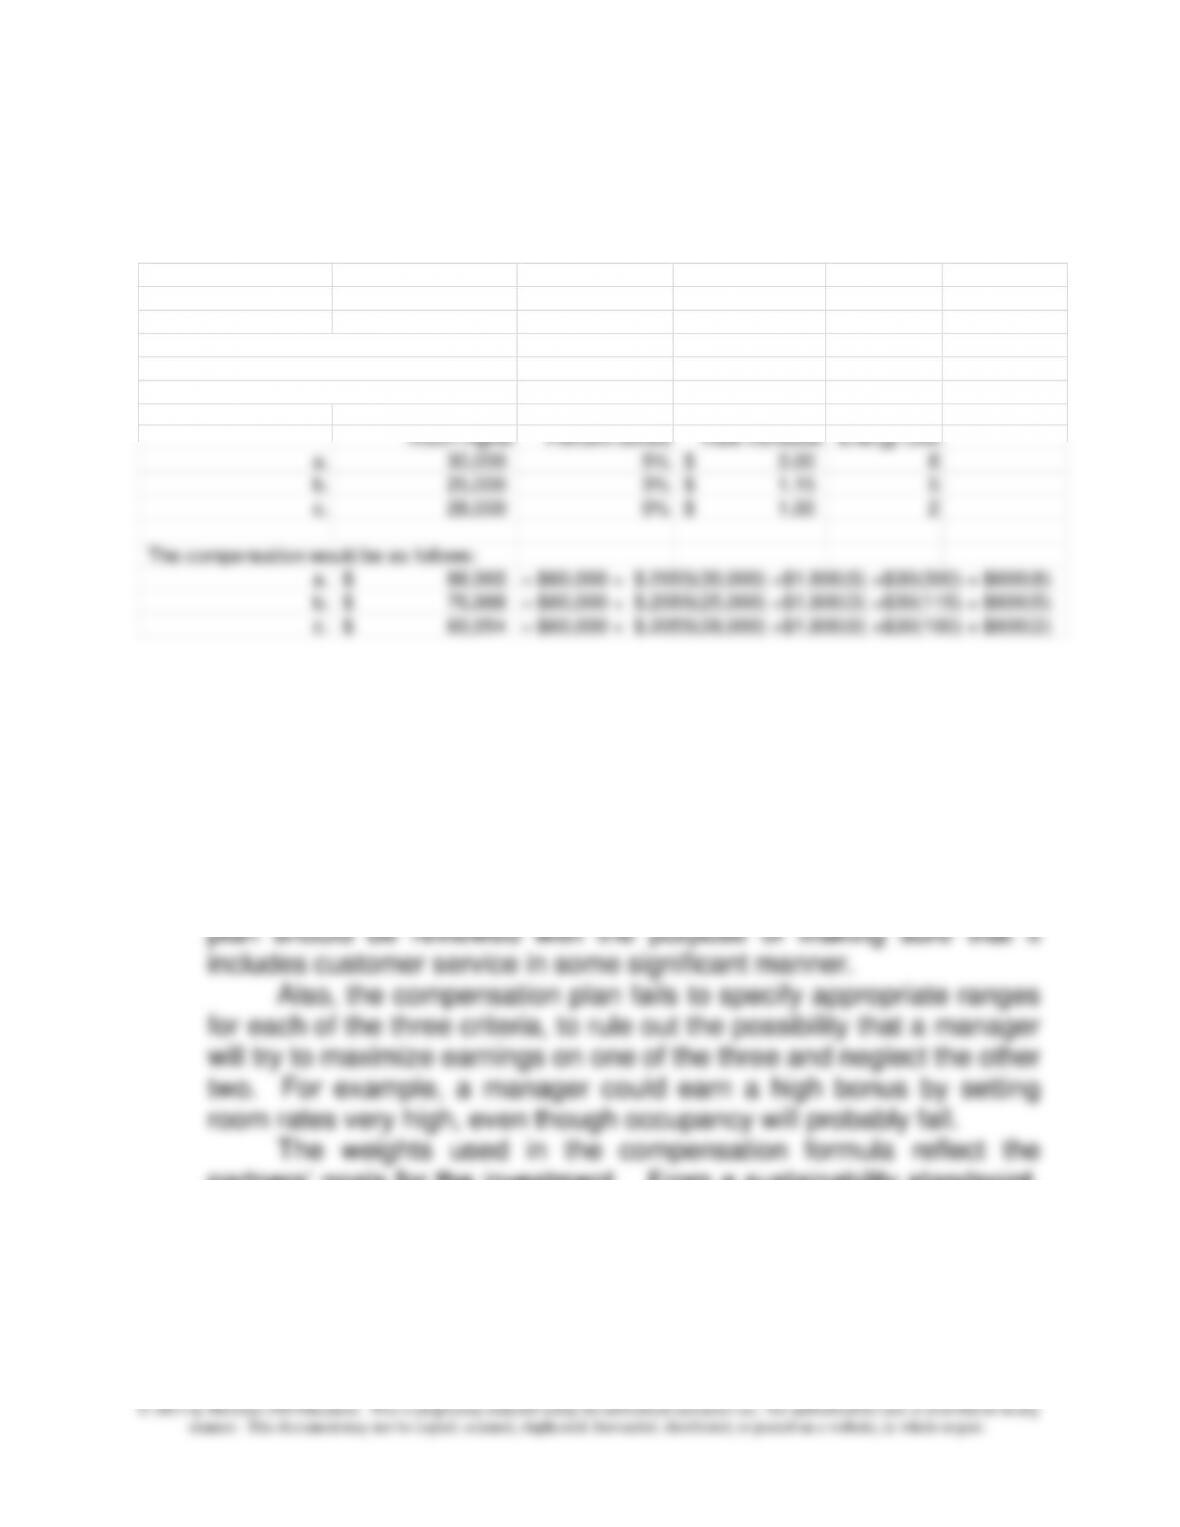
20-37 Incentive Pay in the Hotel Industry (20 min)
1. The compensation would be as follows:
Compensation Plan
Salary 60,000$
+ per room night 0.2055$
+ per percentage point saved in expense 1,800$
+ for each cent increase in room rate 30.00$
+ for each percentage point saved in energy
600.00$
Room nights Percent saved Rate Increase Energy Use
a. 30,000 5% 3.00$ 8
b. 25,000 3% 1.15$ 5
c. 28,000 0% 1.00$ 2
The compensation would be as follows:
a. 88,965$ = $60,000 + $.2055(30,000) +$1,800(5) +$30(300) + $600(8)
b. 76,988$ = $60,000 + $.2055(25,000) +$1,800(3) +$30(115) + $600(5)
c. 69,954$ = $60,000 + $.2055(28,000) +$1,800(0) +$30(100) + $600(2)
2. The compensation plan appears to be an effective one, as it
includes all the key factors of success which the partners are
interested in. However, a key success factor for hotels, as for any
service firm, is to provide effective customer service, and none of the
quantitative measures includes customer service or satisfaction
(though the occupancy goal is said to include service quality, it is not
quantitatively included in compensation). Thus, the compensation
partners’ goals for the investment. From a sustainability standpoint,
the compensation plan is strong; the reduction in energy usage,
which is reflected in two places in the compensation, both directly as
a measure of energy savings, and secondly as a part of savings for
the expense budget.
Chapter 20 – Management Compensation, Business Analysis, and Business Valuation
20–29
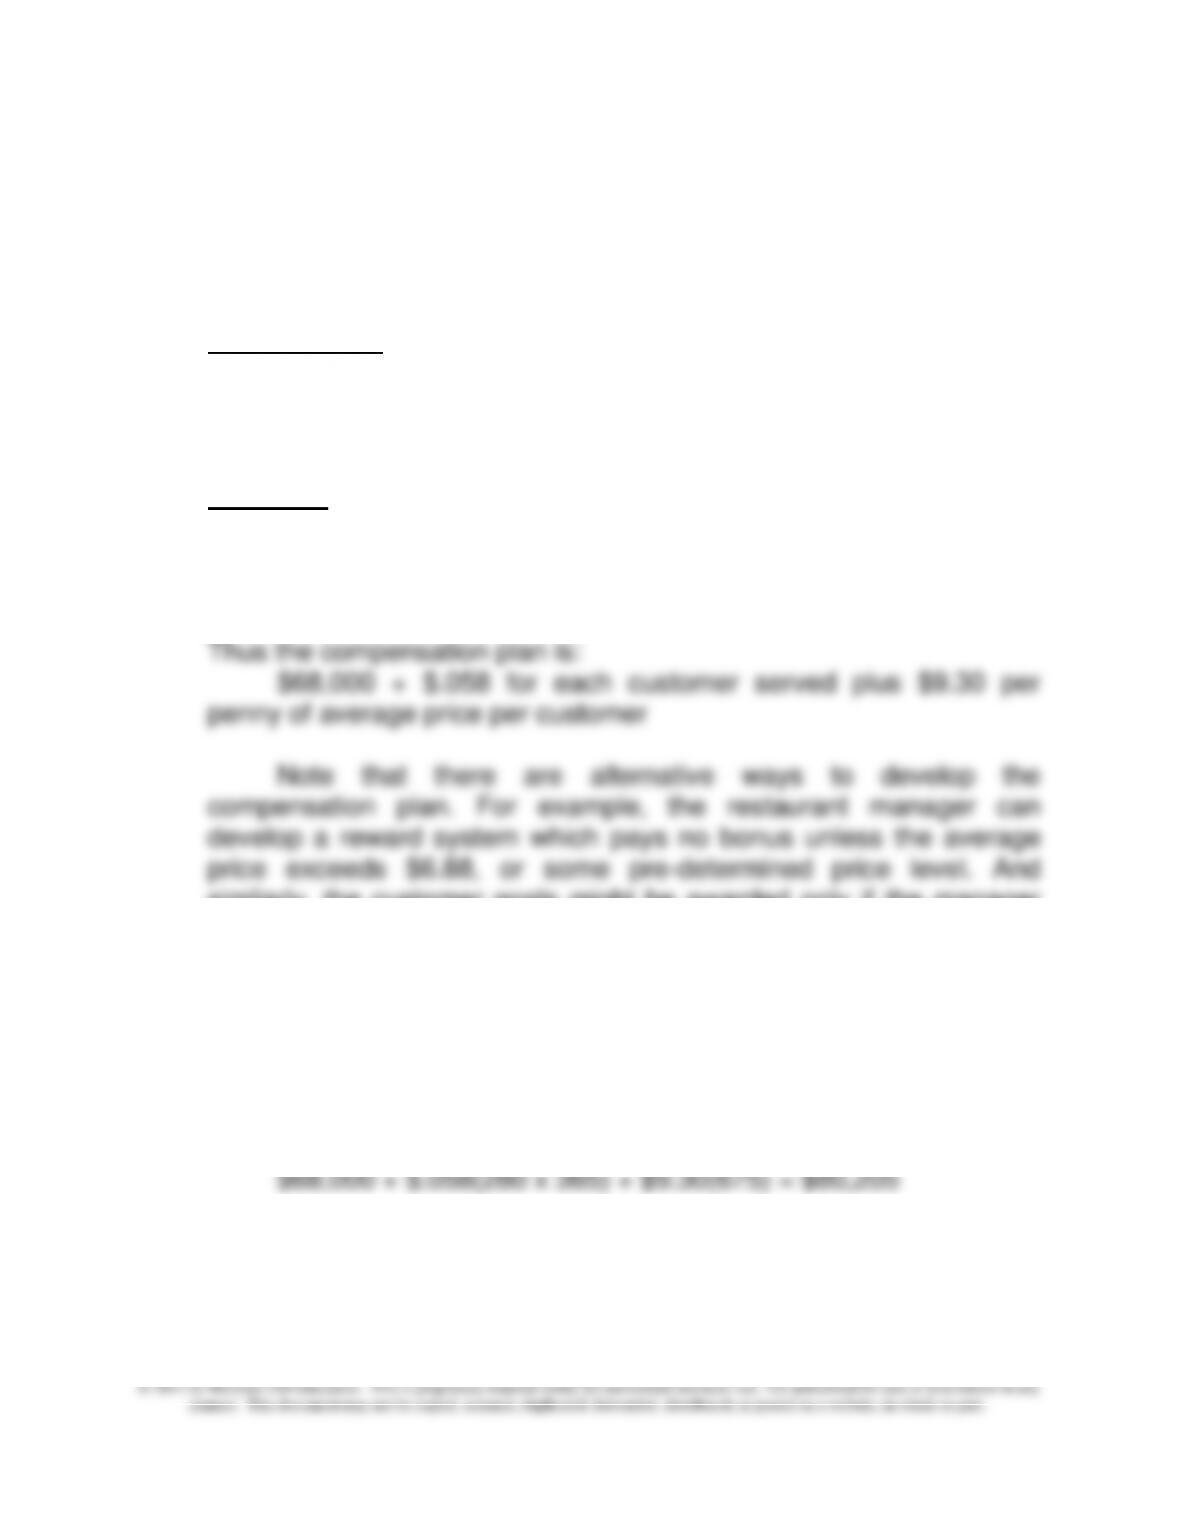
20-38 Incentive Pay Formula Development (30 min)
1.
There are two goals, a goal for number of customers and a price
goal:
Customer goal:
300/day target customers x 365 days = 109,500 customers
½ weight x $12,800 = $6,400
$6,400/109,500 = $ .058 per customer served
Price goal:
$6.88 target price
½ weight x $12,800 = $6,400
$6,400/688 = $9.30 per penny of average price per customer
similarly, the customer goals might be awarded only if the manager
exceeds a given level of customers.
Also, the compensation plan suffers from the same limitations
as described in 20-37 above; namely, there needs to be a range or
cap set on each criteria so that the manager does not attempt to earn
a high bonus by maximizing one of the criteria and ignoring the other.
2. If 280 customers are served per day at $6.75 average price per
person, the total compensation to the manager would be:
$68,000 + $.058(280 x 365) + $9.30(675) = $80,205
Chapter 20 – Management Compensation, Business Analysis, and Business Valuation
20–30
20-39 Compensation Pools; Residual Income; Review of Chapter 19
(40 min)
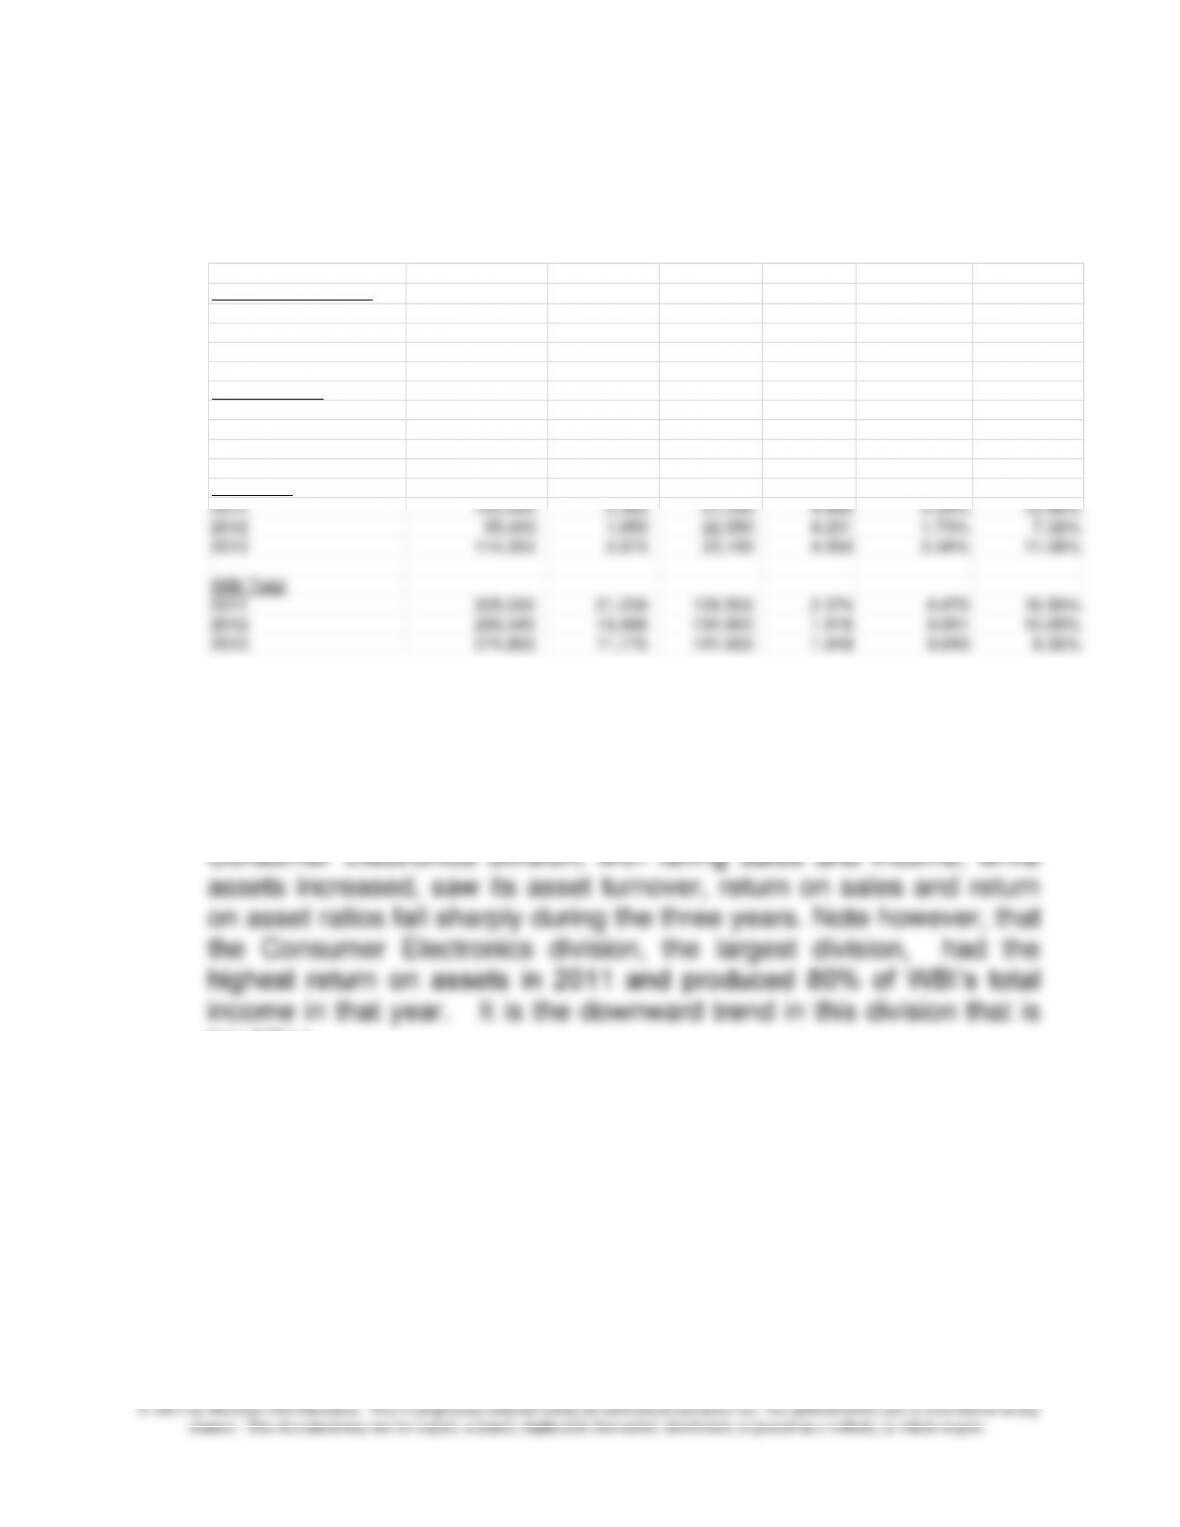
1.
Revenue Income Assets Asset Return on Return on
Consumer Electronics Turnover Sales Assets
2011 $ 155,780 $ 16,750 $ 84,550 1.842 10.75% 19.81%
2012 125,480 9,500 90,450 1.387 7.57% 10.50%
2013 110,650 6,850 98,450 1.124 6.19% 6.96%
Office Supplies
2011 48,750 2,100 22,500 2.167 4.31% 9.33%
2012 45,660 2,340 21,900 2.085 5.12% 10.68%
2013 49,800 2,250 19,500 2.554 4.52% 11.54%
Computers
2011 100,500 2,350 21,450 4.685 2.34% 10.96%
2012 95,400 1,650 22,550 4.231 1.73% 7.32%
2013 114,350 2,675 23,100 4.950 2.34% 11.58%
WBI Total
2011 305,030 21,200 128,500 2.374 0.070 16.50%
2012 266,540 13,490 134,900 1.976 0.051 10.00%
2013 274,800 11,775 141,050 1.948 0.043 8.35%
The calculations above show that 2013 had mixed results for WBI, as
income fell for two of the divisions and sales increased for two of the
divisions. Overall, sales were up and income down. Note that the
Office Supplies unit was able to reduce its assets in 2012 and 2013
so that its return on assets increased in both these years; the
troubling.
The Computer division, another large division, had a bad year
in 2012 but recovered nicely in 2013. Overall, WBI saw a steady
decline in return on assets over the three years, due primarily to the
problems in the Consumer Electronics division.