
Chapter 20 – Management Compensation, Business Analysis, and Business Valuation
20-1
Chapter 20
Management Compensation, Business Analysis, and Business
Valuation
Teaching Notes for Cases
20-1. Midwest Petro-Chemical Company: Evaluation of a Firm; Strategy
Adapted from teaching note provided by the case authors, David A. Kunz and Keith A. Russell
1. The case does not provide much information about the competitive environment for the firm, but we
know this is a commodity business, and the nature of the competition is therefore most likely to be cost
leadership. Appropriate compensation plans would be tied directly to managers’ ability to manage costs.
2. Analysis of company performance using ratio and industry norms as a benchmark.
Ratio/2013 Value Line Midwest
Profit margin 7.5% 2.4% ($2,315/$95,962)
Return on Assets 15.0% 5.3% ($2,315/$44,006)
(% earned total capital)
Return on Equity 17.5% 12.4% ($2,315/$18,657)
(% earned net worth)
Price Earning Ratio 18.5 7.3 ($22.50/$3.08)
Price to Book Value — .38 ($22.50/$58.74)
Operating Margin 17.0% 4.4% ($4,221/$95,962)
Income Tax Rate 35.5% 30.0% ($992/$3,307)
Per cent (%) Retained
to Common Equity 12.0% 85.0% ($16,698/$19,702)
Clearly, Midwest Petro-Chemical is a weak firm relative to industry norms, based on financial ratio
analysis.
Strengths of ratio analysis:
a. Provides an excellent historical profile of a firm.
b. Comparative information is readily available for public firms.
Weaknesses of ratio analysis:
a. Ratio analysis is an art; users have to make important judgments.
b. As firms diversify, become conglomerates, and/or multi-national, specific
differentiated.

Chapter 20 – Management Compensation, Business Analysis, and Business Valuation
20-2
3. Why did ratio analysis serve as an effective tool for Tom Williams?
As a banker, Williams was more concerned about loan repayment ability than about value.
4. Discuss each valuation method. What are strengths and weaknesses of each? What difficulties are
encountered when applying each method?
a. Asset-based or market value: The firm’s value can be determined by valuing the assets.
Three approaches to this method are;
i.) Modified book value⎯adjusts book value to show differences between historical
Strengths of the asset method: Best used to value firms in natural resources or the securities
industry.
Weaknesses of the asset method: Not a popular method; techniques do not consider firm as a
going concern; historical or book value may bear little, if any, relationship to market value.
b. Market Comparison: Uses market values for similar forms to determine value.
c. Discounted cash flow: This method assumes that the value of a firm is a direct function of
future cash flows from the firm’s operations. A discount rate, sometimes stated as the required rate of
return, is the most important part, albeit subjective, of this method. The discount rate is viewed as the
opportunity cost of funds by the investor. The rate typically contains two components:
1. a risk-free element equal to the rate earned on a short-term government instrument
d. Capitalization of earnings: Based on the value of historical or future earnings divided by a
capitalization rate.
Historic earnings: An average of the firm’s net incomes is divided by the capitalization rate. If
there is a discernible earnings trend, let’s say earnings are increasing each year, greater emphasis is placed
on most recent earnings.
Projected earnings: Project future earnings, three to five years out; average these earnings, and
again, divide by the capitalization rate.
Chapter 20 – Management Compensation, Business Analysis, and Business Valuation
20-3
The capitalization rate is determined by the risk associated with the firm’s earnings and the
growth rate of the projected earnings. As a rule of thumb, the capitalization rate is based on the following:
Strengths: Used by knowledgeable investors; solid method for evaluating a low-risk firm.
Weaknesses: Capitalization rate determination is subjective (estimated); the method may be
somewhat difficult to understand.
5. Develop values for Midwest’s Petro–Chemical’s stock using the methods discussed in part 4.
A. Asset-based or market value (000s omitted)
Exhibit One: Appraisal Value (Replacement) for land,
plant, property, and equipment $24,335
B. Market Comparison:
Year Earnings per share
2013 $3.08
2012 $2.66
2011 $1.08
2010 $1.15
$7.97/ 4 years = $1.99 x 16* = $31.84
* sales price x earnings for Western Solvents (given in case)
Chapter 20 – Management Compensation, Business Analysis, and Business Valuation
20-4
C: Discounted Cash Flow
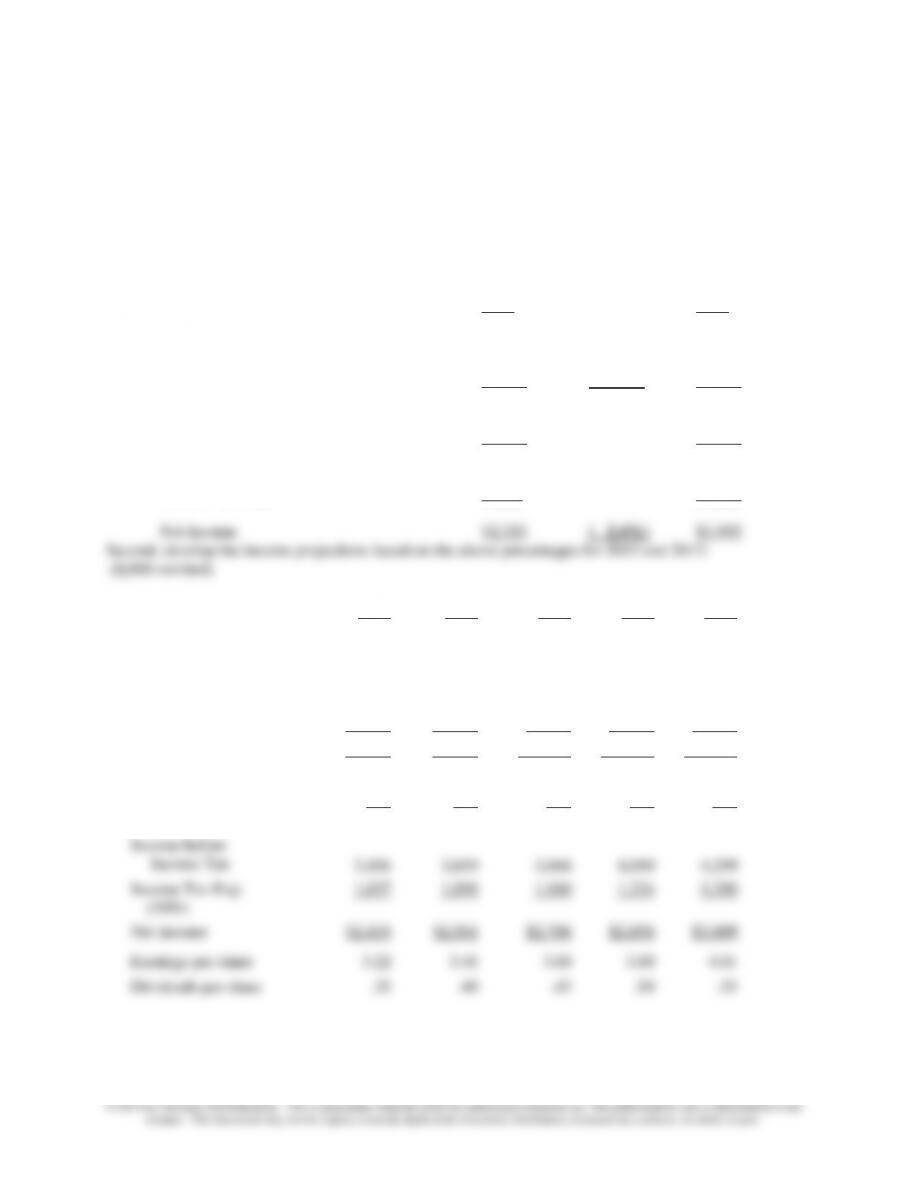
First, determine the cost of sales and income as a percent of sales as a basis for projecting income
for 1996-2000.
Statement of Income
for years ending December 31
($, 000s omitted)
2013 2012
Net Sales $95,652 (100%) $92,333
Cost and Expenses
Cost of Sales 77,719 (81.2%) 74,882
Selling G & A 13,712 (14.4%) 13,388
Total cost & Exp 91,431 (95.6%) 88,270
Operating Income 4,221 ( 4.4%) 4,063
Interest Expense 914 1,214
Income before Income Tax 3,307 2,849
Income Tax Exp. 992 854
2014
2015
2016
2017
2018
Sales
Cost of Sales
$99,000
$102,466
$106,050
$109,764
$113,605
Costs & Expenses
80,388
83,202
86,113
89,128
92,247
Selling G & A
14,256
14,755
15,271
15,806
16,359
Total Cost & Exp
94,644
97,957
101,384
104,934
108,606
Operating Income
4,356
4,509
4,666
4,830
4,999
Interest Expense
900
850
800
750
700
Income before
Income Tax
3,456
3,659
3,866
4,080
4,299
Income Tax Exp.
(30%)
1,037
1,098
1,160
1,224
1,290
Net Income
$2,419
$2,561
$2,706
$2,856
$3,009
Earnings per share
3.22
3.41
3.60
3.80
4.01
Dividends per share
.35
.40
.45
.50
.55
Chapter 20 – Management Compensation, Business Analysis, and Business Valuation
20-5
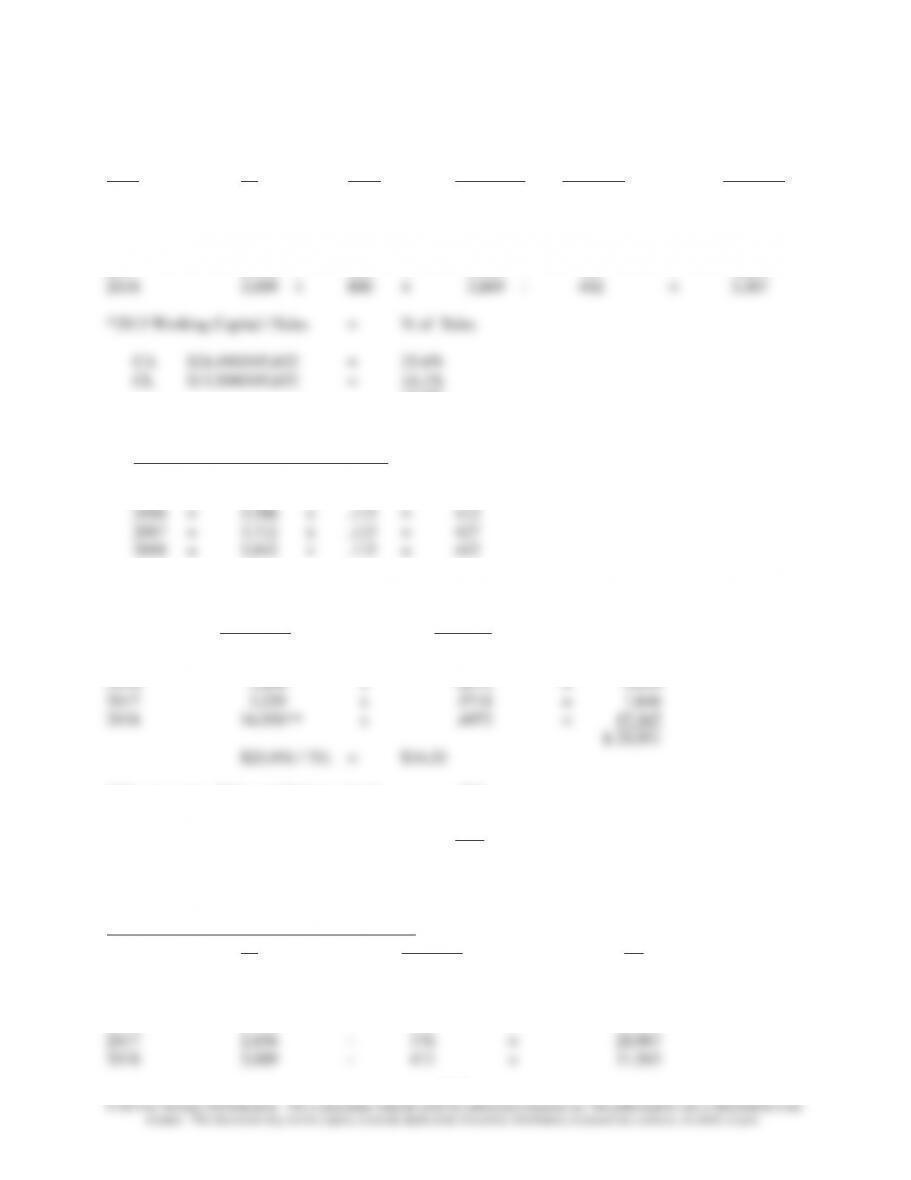
Third, develop Cash Flow Projections:
Cash Flow WC Cash Cash
Year NI Depr In Flow Out* Flow Net
2014 $2,419 + $800 = $ 3,219 – $385 = $2,834
2015 2,561 + 800 = 3,361 – 398 = 2,963
2016 2,706 + 800 = 3,506 – 412 = 3,094
2017 2,856 + 800 = 3,656 – 427 = 3,229
11.5%
Supporting data for developing the cash flow projections:
WC Cash Flow Out: Changes in Sales
2014 = 3,348 x .115 = 385
2015 = 3,465 x .115 = 398
Fourth, develop the valuation based on discounted cash flow:
Present Value
Cash Flow @ 15%*
2014 $2,834 x .8696 = $2,464
2015 2,963 x .7561 = 2,240
*Discount rate: Debt cost (balance sheet) .095
+ Premium (equity) .030
+ Premium (small firm) .025
.150
** Cash Flow plus stockholder equity ($,367 + 31,563)
Supporting data for the above:
Changes in Stockholder Equity (000s omitted):
NI Dividend SE
2013 $ $ $ 19,702
2014 2,419 – 263 = 21,858
2015 2,561 – 300 = 24,119
2016 2,706 – 338 = 26,487

Chapter 20 – Management Compensation, Business Analysis, and Business Valuation
20-6
Dividends (rounded to nearest 000s):
2014 .35 x $751,000 = $ 263,000
2015 .40 x 751,000 = 300,000
2016 .45 x 751,000 = 338,000
2017 .50 x 751,000 = 376,000
2018 .55 x 751,000 = 413,000
D. Capitalization of Earnings (000s omitted)
Net Income Begin SE* Return on Equity
2013 $ 2,315 / $17,612 = 13.1%
2014 1,995 / 15,805 = 12.6%
* Year Begin SE NI – Dividends
2013 $19,702
2012 17,612 2,315 – 225 ($.30 x 751)
2011 15,805 1,995 – 188
2010 14,446 809 – 165
2009 15,161 865 – 150
Historic EPS
2013 – $3.08
2012 – 2.66
2011 – 1.08
2010 – 1.15
$7.97 / 4 = $1.99
$1.99 / .0925 = $21.51
Projected EPS
2014 – $ 3.22
2015 – 3.41
2016 – 3.60
Chapter 20 – Management Compensation, Business Analysis, and Business Valuation
20-7
6. Based on your previous answers, develop a fair-market value for Midwest’s common stock.
Use an average for each of the values produced in part 5 above:
A. Asset-based: $ 32.51
B. Market comparison: $ 31.84
C. Discounted cash flow: $ 34.55
7. Have Frank Armstrong draft a response to Georgia Chemical in Atlanta covering the following
points:
• The Board’s surprise at the purchase inquiry since Midwest has not made public an interest to
sell the firm.
• On behalf of the Board, Armstrong should offer to meet with Georgia Chemical officers to
by the Board and provide time for reflection by Fletcher.
However, it should be noted that Fletcher owns 41.8% of Midwest shares. Also, the pension funds own
10.4% of the shares voted by Allen. These two blocks of stock give Fletcher 52.2% of the voting shares.
Allen will vote the pension fund shares the way Fletcher, his boss, tells him to vote the shares. In short,
Fletcher still controls Midwest. No sale will take place until Fletcher agrees to the sale no matter what
negotiations take place.
8. Once a price is agreed upon by a buyer and a seller, sales terms must be structured.
A. Will the price be paid in cash at closing?
Rarely is the full purchase price paid in cash at closing.

Chapter 20 – Management Compensation, Business Analysis, and Business Valuation
20-8
B. Will stock and assets be sold?
Will the sales terms affect the price? YES.

Chapter 20 – Management Compensation, Business Analysis, and Business Valuation
20-9
20-2. Evaluating a Firm
This case describes the financial analysis of the W. T. Grant retail firm in the five years prior to
its bankruptcy in 1975. To disguise the case, the actual dates are not used in the text. The year 19X8
represents the actual year 1968, and so on. The case is useful to point out some of the limitations of
financial analysis based primarily on ratio analysis, and to point out the importance of analyzing cash
flows, especially for firms under financial stress, as was W. T Grant in the early 1970s.
The article by Largay and Stickney in the August, 1980 Financial Analysts Journal (“Cash
Flows, Ratio Analysis, and the W.T. Grant Company Bankruptcy”) is the basis for the following
discussion.
“Although they surfaced as a gusher rather than a trickle, the problems that brought the W.T.
Grant Company into bankruptcy and ultimately, liquidation, did not develop overnight. Whereas
traditional ratio analysis of Grant’s financial statements would not have revealed the existence of many of
the company’s problems until 1970 or 1971, careful analysis of the company’s cash flows would have
revealed impending doom as much as a decade before the collapse.”
Grant’s profitability, turnover, and liquidity ratios have trended downward over the 10 years
preceding bankruptcy. But the most striking characteristic of the company during that decade was that it
generated no cash internally. Although working capital provided by operations remained fairly stable
through 1973, this figure (which constitutes net income plus depreciation and is frequently referred to in
the financial press as “cash flow”) can be a very poor indicator of a company’s ability to generate cash.
Through 1973, the W. T. Grant Company’s operations were a net user, rather than provider, of cash.
Grant’s continuing inability to generate cash from operations should have provided investors with
an early signal of problems. Yet as recently as 1973, Grant stock was selling at nearly 20 times earnings.
Investors placed a much higher value on Grant’s prospects than an analysis of the company’s cash flow
from operations would have warranted.” (Largay and Stickney, p51)
The analysis of liquidity and profitability ratios is shown below.

Chapter 20 – Management Compensation, Business Analysis, and Business Valuation
20–10
Liquidity
Ratios
Relevance
2008
2009
2010
2011
2012
2013
A/R
Turnover
The average number of times per yr.
net receivables turn into cash.
Indicates effectiveness of credit policy
and collections. Should be compared
to prior years and to industry averages.
3.74
3.57
3.20
3.07
3.23
Current
Ratio
An important measure of liquidity.
Should be compared to prior years,
industry averages and debt restriction,
if any.
3.57
3.30
3.40
3.38
3.50
4.03
Quick
Ratio
(Acid Test)
A measure of liquidity like the current
ratio, but more conservative. Includes
only highly current assets-cash,
marketable securities, and receivables.
2.19
2.03
2.17
2.13
2.22
2.36
Inventory
Turnover
Indicates the average number of times
that inventory is replaced during the
year. Measures inventory management
policies and can give an unsalable
inventory.
3.77
3.80
3.49
3.33
3.22
Cash flow
Ratio
Measures the degree to which cash
flows from operations covers current
liabilities
.29
.20
.14
.11
(.25)
Looks OK overall, but for recent buildup in inventory and receivables; all ratios look stable. The key is to see that the cash flow ratio is falling steadily, with a

Chapter 20 – Management Compensation, Business Analysis, and Business Valuation
20–11
sharp drop in the recent year. This shows that the company is beginning to fund operations through long term debt, a signal of sever liquidity problems. Note
that the conventional liquidity measures do not tend to show this, and disguise the rapid build up in receivables in inventory.

Chapter 20 – Management Compensation, Business Analysis, and Business Valuation
20–12
Profitability
Ratios
Relevance
2008
2009
2010
2011
2012
2013
Return on
Total Assets
A measure of management’s
efficiency and effectiveness in using
available assets.
6.46%
6.29%
5.23%
4.02%
3.68%
Return on
Equity
A measure of management’s
effectiveness in providing returns to
shareholders
14.55%
14.65%
13.35%
11.22%
11.45%
Gross
Margin %
An important measure of profitability.
Should be compared to prior years
and to relevant industry data.
Reflects control over costs and
pricing policies.
31.83%
32.47%
32.68%
33.03%
32.43%
31.74%
Earnings per
Share
A measure of profitability available to
shareholders; is often used to asses
the value of the firms stock, using the
“price/earnings ratio”
$2.54
$2.78
$3.05
$2.89
$2.51
$2.79
Profitability is mediocre but stable in the years shown, showing also how the profitability ratios, as well as the liquidity
ratios, disguise the troubles of the firm, which are shown so clearly in the falling cash flow from operations.

Chapter 20 – Management Compensation, Business Analysis, and Business Valuation
20–13
20-3. Economic Value Added; Review of Chapter 18; Strategy
(Adapted from teaching note prepared by the case writer, Paul Dierks, Wake Forest University)
1. Economic Value Added, or EVA, is a measure of financial performance that combines the familiar
concept of residual income with principles of modern corporate finance NI⎯specifically, that all capital
has a cost and that earning more than the cost of capital creates value for shareholders. EVA is after-tax
net operating profit (NOPAT) minus cost of capital. If a company’s return on capital exceeds its cost of
capital, it is creating true value for shareholders. Companies consistently generating high EVAs are top
performers that are highly valued by shareholders.
How does EVA stack up against the conventional financial measures of performance? Advocates
of EVA are quick to point out that financial measures based on reported accounting earnings ⎯ earnings
growth, earnings per share, and return ratios calculated on either investment, equity or assets ⎯ are
misleading measures of corporate performance. This is based on their view that accountants place their
primary emphasis on placating the interests of a firm’s lenders in order to provide a conservative
assessment of the firm’s liquidation value. Thus, the quality of reported earnings are diminished by
various financial accounting rules, like incorporating charge-offs of such value-building capital outlays as
R&D and bookkeeping entries that have little to do with recurring cash flow. This group also feels that
many investors may be fooled by accounting “shenanigans,” but investors who matter are not misled.
They know that stock prices are set by a select group of “lead steers” who look through misleading
accounting results to arrive at true values. Although blissfully ignorant of why the price is right, the rest
of the “herd” is well protected by the lead steers’ informed judgments.
One comparison is to the standard accounting return on common equity (ROE), which is
generally understood and easily calculated by dividing net income available to common stockholders by
the amount of accounting equity capital. However, ROE suffers from distortions of accounting earnings
by, among other things, expensing R&D, selecting LIFO or FIFO for inventory costing, recording
acquisitions as a purchase or a pooling, and burying recurring cash flows generated from operations in
reserves because of accrual accounting methods.
Also, ROE reacts to changes in the debt-to-equity mix a company employs and in the rate of
interest it pays on its debts, making it difficult to determine if ROE rises or falls for operating or financial
reasons without examining the return on assets and the firm’s debt–to-equity ratio. With ROE as its goal,
management may be tempted to accept substandard projects that happen to be financed with debt and pass
by very good ones that are financed with equity. To avoid such situations, managers shouldn’t associate
sources of funds with the uses of those funds. Such association distorts the desirability of undertaking a
project by mixing operating and financing decisions. Instead, all projects should be thought of as being
financed with a target blend of debt and equity no matter how they might indeed be financed. Moreover,
by focusing just on ROE, managers may pass up good (wealth creating) projects that are safer than the
average assets of the firm because the return on the project would lower the firm’s ROE. Similarly,
managers may take on bad (wealth reducing) projects that are riskier than the average asset of the firm
because the project’s return increases the firm’s ROE. It should be kept in mind that by focusing on ROE,
the manager ignores the risk associated with a specific project and hence the appropriate return needed for
that investment.
An alternative measure of performance is return on assets (ROA), but it too ignores the cost of
capital, which can lead a firm to make decisions that reduce economic value. For example, IBM, in its
most profitable year, had a return on assets that was over 11 %, but its cost of capital was almost 13 %.
Assuming their cost of capital remains at 13 %, accepting projects with risks similar to existing assets, but
with a return below 13 %, reduces shareholder value.
Another comparison to make is against earnings per share (EPS). In contrast to EVA, EPS tells
little about the cost of generating those profits. Since EPS is directly influenced by the amount of earnings
relative to the number of shares outstanding, financing new investments through debt capital can increase
EPS. Large or rapid earnings growth can be manufactured by pouring capital into riskier projects; earning
an adequate rate of return relative to risk is far more important than growing rapidly. Thus, at best, EPS

Chapter 20 – Management Compensation, Business Analysis, and Business Valuation
20–14
measures only the quantity of earnings, but the quality of earnings reflected in the price-to-earnings
multiple also matters.
Calculating EVA
In The Quest for Value (Harper Collins Publishers, 1991), G. Bennett Stewart calculates a firm’s
EVA in two ways: an Operating Approach, and a Financing Approach. The Financing Approach builds
up to the rate of return on capital from the standard return on equity in three steps: eliminating financial
leverage, eliminating financing distortions, and eliminating accounting distortions. As a result of the first
two steps, NOPAT is a sum of the returns attributable to all providers of funds to the company, and the
NOPAT return is completely unaffected by the financial composition of capital. What matters is simply
the productivity of capital employed in the business. The financial form in which the capital has been
obtained does not matter. Only the financial approach is presented here; for the development of the
operating approach, consult Stewart’s text.
Before developing the calculations for EVA it is important to first cover the concepts of the
equity equivalent adjustments, or EE’s.
Understanding / Use of Equity Equivalents
Equity equivalents, or ‘EE’s’, per Bennett Stewart’s book, are adjustments that turn a firm’s
accounting book value into “economic book value,” which is a truer measure of the cash that investors
have put at risk in the firm and upon which they expect to accrue some returns. In this way, capital-related
items are turned into a more accurate measure of capital that better reflects the financial base investors
expect to accrue their returns on. Also, revenue- and expense-related equity equivalent adjustments are
included in a NOPAT that is a more realistic measure of the actual cash yield generated for investors from
recurring business activities.
Stewart has identified a total of 164 equity equivalent reserve adjustments; however, only about
20 to 25 have to be addressed in detail, and only a portion of these may actually be made in practice. In
our published rankings and illustrations we have chosen to make only a handful of such adjustments in
the calculation of EVA ⎯ typically those which can be made with information contained in the
Compustat database and easily explained to the general business reader. They recommend making an
adjustment only in cases that pass four tests:
1.) Is it likely to have a material impact on EVA?
2.) Can the managers influence the outcome?
3.) Can the operating people readily grasp it?
4.) Is the required information relatively easy to track and derive?
R&D expenditures provide a good example of an equity equivalent adjustment. Under accounting
conventions, outlays for R&D are charged off to the income statement in the period when they are
incurred. These immediate charge-offs as operating expenses say there is no future value to be derived
from R&D. Thus, the firm’s profits are reduced and its capital is undervalued. For EVA purposes, all
outlays over the life of successful R&D projects should be removed from the income statement, be
capitalized into the balance sheet and amortized against earnings over the period benefiting from the
successful R&D efforts. In calculating EVA, R&D is seen as an investment and amounts spent for it
must be included in a firm’s capital base to accurately reflect the amount of capital employed. Only the
portion of R&D that no longer has future value should be charged to the income statement in order to
properly reflect the costs and profit of a period. The portion of R&D expenditures that has future value
should appear as an asset. These equity equivalent adjustments are made in calculating EVA.
The following list of equity equivalents and their effect on capital and NOPAT is taken from
Stewart’s book. The asterisked items are equity equivalents in the OSI case. They are described further in
the paragraphs after the list.

Chapter 20 – Management Compensation, Business Analysis, and Business Valuation
20–15
Add to Capital: Equity Equivalents
Deferred income tax reserve*
LIFO reserve*
Cumulative goodwill amortization*
Unrecorded goodwill
(Net) capitalized intangibles
Full-cost reserve
Cumulative unusual loss (Gain) after tax
Other reserves, such as:
Bad debt reserve Inventory obsolescence reserve
Warranty reserve Deferred income reserve
Add to NOPAT: Increase in Equity Equivalents
Increase in deferred tax reserve*
Increase in LIFO reserve*
Goodwill amortization*
Increase in (net) capitalized intangibles
Increase in full-cost reserve
Unusual loss (gain) after tax
Increase in other reserves
Deferred Income Tax Reserve. Deferred taxes arise from a difference in timing when revenues
and expenses are recognized for financial reporting versus when they are reported for tax purposes. The
difference between the accounting provision for taxes and the tax amount paid is accumulated in the
reserve for deferred income taxes account. If long-term assets that give rise to tax deferrals are
replenished, a company’s deferred tax reserve increases, which constitutes the equivalent of permanent
equity. Adjusting NOPAT for the change in deferred tax reserve results in NOPAT being charged only
with the taxes actually paid instead of the accounting tax provision. This provides a clearer picture of the
true cash-on-cash yield actually being earned in the business. Action(s) to be taken:
Add to Capital: Amount of the deferred tax reserve
Add to (Deduct From) NOPAT: Amount of increase (decrease) in the deferred tax reserve
The LIFO Reserve. In periods of rising prices, firms save taxes by using a LIFO basis of
inventory costing. Under LIFO, recently acquired goods are expensed and the costs of prior periods are
accumulated in inventory, resulting in an understatement of inventory and equity. A LIFO reserve account
captures the difference between the LIFO and FIFO value of the inventory and indicates the extent that
the LIFO inventories are understated in value. Adding the LIFO reserve to capital as an equity equivalent
adjustment converts inventories from a LIFO to a FIFO basis of valuation, which is a better
approximation of current replacement cost. Also, adjusting NOPAT for the change in the LIFO reserve
brings into earnings the current period effect of unrealized gain attributable to holding inventories that
appreciated in value. Action(s) to be taken:
Add to Capital: Amount of the LIFO reserve
Add to (Deduct From) NOPAT: Amount of increase (decrease) in the LIFO reserve
Changes in the LIFO reserve can also be viewed as a difference between the LIFO and FIFO cost
of goods sold. Including this change in reported profits converts a LIFO cost of goods sold expense to
FIFO, but LIFO‘s tax benefit is retained. The overall effect of treating a LIFO reserve as an equity
equivalent adjustment is to produce a FIFO balance sheet and income statement but preserve the LIFO tax