Unlock document.
This document is partially blurred.
Unlock all pages and 1 million more documents.
Get Access

Chapter 20 - Management Compensation, Business Analysis, and Business Valuation
20-31
experience and commitment of its employees (an environment fostered by this long
relationship) as one of its sustaining competitive advantages (Salter and Dayley 2000). If
John Deere used (or ever uses) unfair bargaining tactics when negotiating its compensation
contracts with its manufacturing employees, then all the trust and goodwill that has
developed between these two parties (and one of John Deere’s sustaining competitive
advantages) would be lost.
Directing Role
By rewarding group performance, CIPP provides employees incentives to focus on cooperative
efforts and activities that increase the overall production efficiency of their product-focused teams
(illustrated in question 4.c). Based on the observations of company management, many of the
process improvements in the years following CIPP’s implementation were the result of increased
cooperation within manufacturing teams. For example, many manufacturing teams met outside
their scheduled work hours in an attempt to better coordinate activities across work-shifts and job
classifications.
On the whole, CIPP appears to more effectively direct employees’ attentions to activities that
provide the highest benefit to John Deere. However, by making individual compensation dependent
upon the actions of others, the use of a group-based compensation plan has increased employee
tensions within some teams. For example, several instances of “parking-lot diplomacy” have been
documented among employees.
Attracting Role
Because individual compensation is highly dependent on the actions of others, John Deere may no
longer attract the highest skilled workers to its manufacturing facilities (discussed in the teaching
note to question 4.d). That is, the most highly motivated and skilled individuals are likely to prefer
plans that reward their individual talents and efforts. However, John Deere has been, for the most
part, eliminating the jobs of retiring workers (i.e. John Deere has reduced its hiring). Thus, the
company has not felt much of the effects of this specific tradeoff.
John Deere’s Desired Improvements in Upcoming CIPP Negotiations
In upcoming contract negotiations, John Deere would like to improve CIPP along two dimensions.
First, management would like to adjust the benchmark whenever average bi-annual performance
exceeds 115 percent rather than 120 percent. In general, this change would decrease the benefits to
employees of producing just shy of the benchmark adjustment level. Further, John Deere wants to
adjust the team’s benchmark by the exact percentage that average bi-annual performance exceeds
the 115 percent threshold (as opposed to a maximum adjustment of 6.49 percent).
John Deere’s second objective in upcoming contract negotiations is to provide increased incentives
for employees to reveal their private production information. To this end, the company wants to
increase the bonus from 5 percent to 15 percent of the standard increase. Currently, employees only
receive a 5 percent bonus for a 6.49 percent increase in the standard. Additionally, John Deere
wants to provide employees the option of receiving their bonuses in additional vacation time as
opposed to cash – this allows employees the option of converting their efforts to paid time off.
This second objective reveals John Deere’s strategy for overcoming one of the inherent difficulties
of CIPP – measuring the costs imposed on the manufacturing employees of generating production

Chapter 20 - Management Compensation, Business Analysis, and Business Valuation
20-32
efficiencies. As described in the case, implementing process improvements potentially imposes
many costs on employees (for example, reduced future compensation, greater effort, and increased
probability of future job loss). However, it is extremely difficult (if not impossible) for John Deere
to accurately estimate these costs.
Since John Deere cannot perfectly measure employees’ reservation wage for these innovations, the
company elected to initiate CIPP with a 5 (or 10) percent bonus for each increase in a team’s
benchmark – an amount far below the benefit that accrues to John Deere for these process
improvements (see question 4.b). In the years since CIPP’s implementation, employees revealed
(through implementation) the process improvements for which their costs were below the benefits
of the one-time 5 percent bonus. John Deere is now willing to pay a 15 percent bonus for these
innovations.
One potential problem with this strategy, however, is that employees could “hold-up” their process
improvements in the hopes of receiving even higher bonuses in the future. Specifically, if
employees anticipate John Deere offering even higher bonuses in the future, then it may be in their
best interest save-up their innovations until the next round of contract renegotiations.
REFERENCES
Aeppel, T. 2002. Tricks of the trade: On factory floors, top workers hide secrets to success. The
Wall Street Journal (July 1): A1.
Arnold, P. 1998. The limits of Postmodernism in accounting history: The Decatur experience.
Accounting, Organizations, and Society 23 (7), 665-684.
Salter, M., and M. Dayley. 2000. Deere & Company: sustaining value. Harvard Business School
Case 9-899-001.
FIGURE 1
Average (Actual) Benchmarks for Manufacturing Teams at John Deere for the
Eight Bi-annual Periods (Four Years) Following CIPP’s Implementation

Chapter 20 - Management Compensation, Business Analysis, and Business Valuation
20-33
0.70
0.75
0.80
0.85
0.90
0.95
1 2 3 4 5 6 7 8
Bi-annual Period Following CIPP Implementation
Manufacturing Team Benchmark
Chapter 20 - Management Compensation, Business Analysis, and Business Valuation
20-34
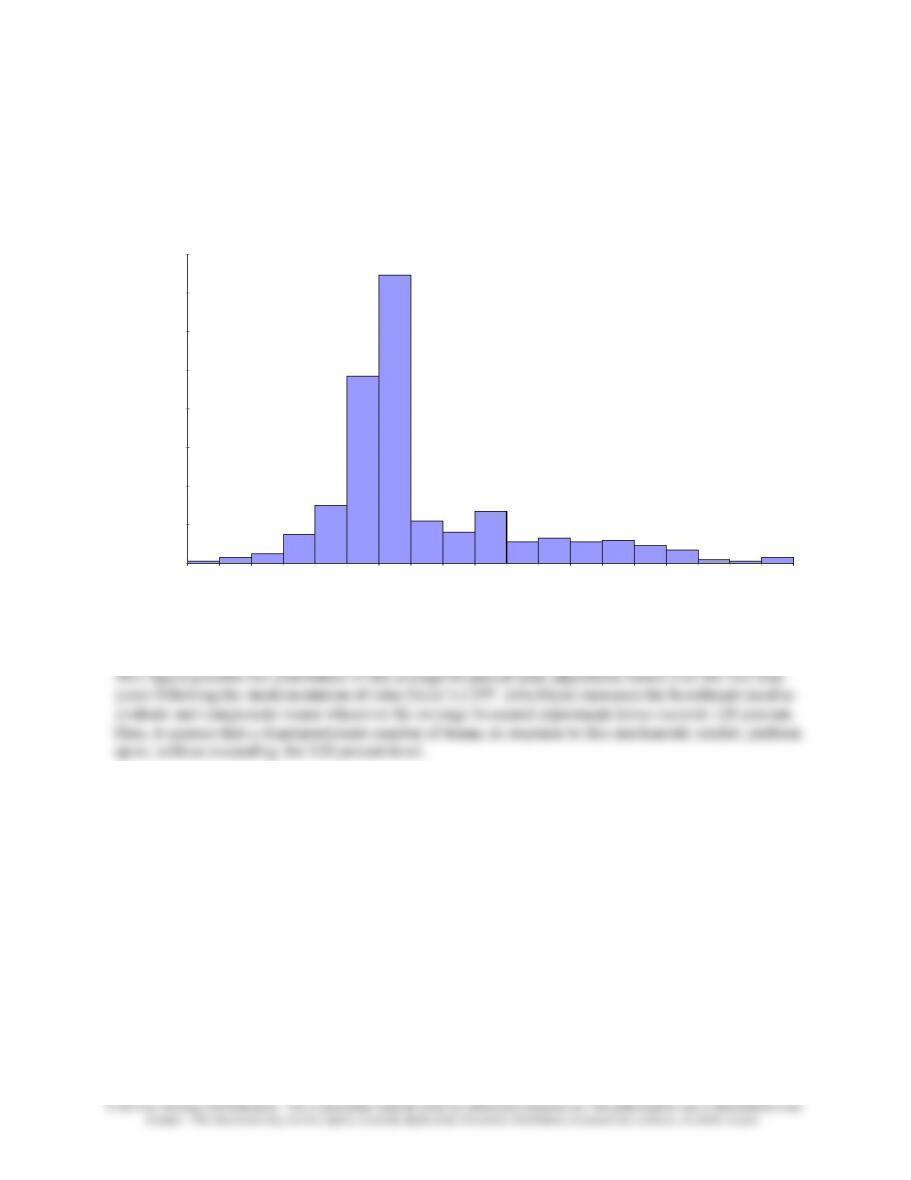
FIGURE 2
Distribution of Bi-Annual (Actual) Manufacturing Team Performance
at John Deere under CIPP
0
20
40
60
80
100
120
140
160
<=108
108-
110
110-
112
112-
114
114-
116
116-
118
118-
120
120-
122
122-
124
124-
126
126-
128
128-
130
130-
132
132-
134
134-
136
136-
138
138-
140
140-
142
>142
Performance Level (Adjustment Factor)
Frequency (n)

20-35
20-5 Henson Stores
Note: The Henson Stores Case is similar to Problem 18-49 in the text.
Overview: The case is intended for the cost or advanced management accounting course. It can also be
used with the MBA management accounting course. The case assumes knowledge of Excel, including
the ability to apply correlation and regression analysis (found in Data Analysis under the Data menu in
Excel).
Learning Objectives:
The main learning objectives of the case are to assess the validity of the balanced scorecard (BSC) and to
use the validated BSC to determine (and interpret) bonus compensation for the store managers of a multi-
store retail company. The learning objectives:
1. Using regression and correlation analysis, determine which of the measures in a BSC have a
statistically significant (and therefore reliable) relationship with the key performance measure
in the case, store-level earnings.
2. Determine the amount of bonus to be allocated to each store manager based on the reliable
BSC measures, and interpret the results of the bonus calculations.
Answers to Requirements:
1. The regression and correlation results for the data are shown below.
These results show (see regression results in TN-1) that only two of the BSC measures are valid,
that is – statistically significant at the p=.05 level. These two measures are the customer survey
(p=.0315) and the average wait time (p<.00). The manager review and the employee awards
program do not have a statistically significant relationship with earnings. The key statistical
Review -0.217692 2.119481547 -0.10271 0.91901258 -4.582845878
Awards -1.0705299 1.960288514 -0.546108 0.589832219 -5.107819614
Correlation Results
Earnings Survey Wait Time
between earnings and each of the significant variables – customer survey and wait time. The results are

Chapter 20 - Management Compensation, Business Analysis, and Business Valuation
shown in TN-1 above: customer survey (r = .762875) and wait time (r = -.875424). The correlation is
negative for the wait time measure since lower wait time leads to greater customer satisfaction and to
greater earnings. Both of these correlations are significant at the .05 level, as determined from the
regression model.
2. Using the results in part 1, we can calculate the bonus for each manager.
a. The total compensation pool is 5% of $58,191,000 = $2,910,000
Chapter 20 - Management Compensation, Business Analysis, and Business Valuation
20-37
The reasoning behind this allocation method is that it provides a range of bonus rewards which is
consistent with the customer survey results. Note that the standard deviation of bonus rewards is 6.49 for
the customer survey bonus and 9.99 for the wait time bonuses, not a very large difference. Other
approaches I examined in coming up with these allocations produced results such that the amounts of the
bonuses ranged from very large to very small or zero. My goal in choosing the allocation method was to
have a method in which the allocations would (a) not result in negative bonuses, and (b) would produce
approximately the same variation (standard deviation) for each of the BSC measures. For example, in one
the wait time bonus pool to the managers. For example, one could allocate the entire bonus pool to, say,
the top 10 store managers. Another option would be to allocate the bonuses so that only the managers
achieving above a certain threshold score (for example the median of all scores) would receive a bonus.
An argument for increasing the variance of bonuses received by managers is to more strongly motivate
the best managers to work hard to achieve the higher bonuses. Alternatively, an argument for reducing
the variance of bonuses received by managers is that the managers may have to work together to achieve
higher overall profits for all stores (for example, the incentive for a manger to guide customers to other
stores when his or her store is out of stock), and a method with lower variance would be more consistent

Chapter 20 - Management Compensation, Business Analysis, and Business Valuation
20-38
c. The sub-pool bonuses are added to determine the total bonus for each manager, shown in
TN-3.
TN-3 Total Bonus for Each Manager using BSC Measures
Customer Survey Average Wait Time Wait Time Total
Store No. Earnings Survey Bonus Store No. Wait Time Score Bonus Store No. Bonus
Store No.
Bonus
1 2,787$ 78.0 49.50$ 1 49 94 67.57$ 1 117.06$ 12 126.92$
2 1,335 54.0 34.27 2 92 51 36.66 2 70.93 21 120.15
3 1,704 60.0 38.07 3 77 66 47.44 3 85.51 1 117.06
4 2,011 80.0 50.77 4 80 63 45.28 4 96.05 10 117.02
5 1,239 73.0 46.32 5 95 48 34.50 5 80.83 29 114.32
6 1,902 73.0 46.32 6 62 81 58.22 6 104.55 20 113.77
7 2,012 71.0 45.06 7 65 78 56.06 7 101.12 14 110.68
8 1,610 72.0 45.69 8 81 62 44.56 8 90.25 17 109.62
9 1,889 66.0 41.88 9 69 74 53.19 9 95.07 13 105.31
10 2,095 87.0 55.21 10 57 86 61.81 10 117.02 6 104.55
11 2,000 71.0 45.06 11 65 78 56.06 11 101.12 24 102.81
12 2,875 89.0 56.48$ 12 45 98 70.44 12 126.92 25 101.88
13 2,300 81.0 51.40 13 68 75 53.91 13 105.31 7 101.12
14 2,213 77.0 48.86 14 57 86 61.81 14 110.68 11 101.12
15 1,669 59.0 37.44 15 98 45 32.34 15 69.79 19 96.43
16 1,600 67.0 42.52 16 81 62 44.56 16 87.08 4 96.05
17 2,311 81.0 51.40 17 62 81 58.22 17 109.62 9 95.07
18 1,405 55.0 34.90 18 89 54 38.81 18 73.72 27 93.08
19 1,756 67.0 42.52 19 68 75 53.91 19 96.43 28 90.76
20 2,187 83.0 52.67 20 58 85 61.10 20 113.77 8 90.25
21 2,387 84.0 53.30 21 50 93 66.85 21 120.15 22 88.05
22 1,835 64.0 40.61 22 77 66 47.44 22 88.05 16 87.08
23 1,511 69.0 43.79 23 89 54 38.81 23 82.60 3 85.51
24 1,910 68.0 43.15 24 60 83 59.66 24 102.81 23 82.60
25 2,230 79.0 50.13 25 71 72 51.75 25 101.88 26 81.84
26 1,549 61.0 38.71 26 83 60 43.13 26 81.84 30 81.24
27 1,849 64.0 40.61 27 70 73 52.47 27 93.08 5 80.83
28 1,756 66.0 41.88 28 75 68 48.88 28 90.76 18 73.72
29 2,514 85.0 53.94 29 59 84 60.38 29 114.32 2 70.93
30 1,750 51.0 32.36 30 75 68 48.88 30 81.24 15 69.79
465 58,191$ 2,135 1,355$ 465 2,127 2,163 1,555$ 465 2,910$
Total Bonus Rank
The right hand column shows the rank of store managers based on total compensation. The top three
managers are those for stores 12,21, and 1. The lowest ranked store manager is for store number 15. The
3. The solution is similar to that for part 2 above.
a. The total compensation pool is 5% of $58,191,000 = $2,910,000
The correlation measures for customer survey and wait time are used to determine the amount of
the compensation sub-pool for each of these BSC measures, as follows:
Absolute Correlation
Compensation
Comp w/ Comp.
Corrleation Measures Correlation Correlation Proportion Pool Earnings @50% Pool
Customer Survey 0.763 0.763 0.466 1,355$ 23.28% 23.3%=.5*(.763/1.638) 677.42
Wait Time (0.875) 0.875 0.534 1,555$ 26.72% 777.36
1.638 1.000 2,910
Earnings 50.00% 1454.78
100% 2910

Chapter 20 - Management Compensation, Business Analysis, and Business Valuation
20-39
The bonus for each manager for earnings, survey, and wait time are as shown in TN-4 below:
TN-4: Bonus Calculations for Earnings, Customer Survey, and Wait Time
Customer Average Wait Time Wait Time
Store No. Earnings Survey Bonus Store No. Wait Time Score Bonus Store No. Earnings Bonus
12 2,875 89.0 28.24$ 1 49 94 33.78$ 12 2,875$ 71.88$
10 2,095 87.0 27.60 2 92 51 18.33 1 2,787 69.68
29 2,514 85.0 26.97 3 77 66 23.72 29 2,514 62.85
21 2,387 84.0 26.65 4 80 63 22.64 21 2,387 59.68
20 2,187 83.0 26.34 5 95 48 17.25 17 2,311 57.78
13 2,300 81.0 25.70 6 62 81 29.11 13 2,300 57.50
17 2,311 81.0 25.70 7 65 78 28.03 25 2,230 55.75
4 2,011 80.0 25.38 8 81 62 22.28 14 2,213 55.33
25 2,230 79.0 25.07 9 69 74 26.59 20 2,187 54.68
1 2,787$ 78.0 24.75 10 57 86 30.91 10 2,095 52.38
14 2,213 77.0 24.43 11 65 78 28.03 7 2,012 50.30
5 1,239 73.0 23.16 12 45 98 35.22 4 2,011 50.28
6 1,902 73.0 23.16 13 68 75 26.95 11 2,000 50.00
8 1,610 72.0 22.84 14 57 86 30.91 24 1,910 47.75
7 2,012 71.0 22.53 15 98 45 16.17 6 1,902 47.55
11 2,000 71.0 22.53 16 81 62 22.28 9 1,889 47.23
23 1,511 69.0 21.89 17 62 81 29.11 27 1,849 46.23
24 1,910 68.0 21.58 18 89 54 19.41 22 1,835 45.88
16 1,600 67.0 21.26 19 68 75 26.95 19 1,756 43.90
19 1,756 67.0 21.26 20 58 85 30.55 28 1,756 43.90
9 1,889 66.0 20.94 21 50 93 33.42 30 1,750 43.75
28 1,756 66.0 20.94 22 77 66 23.72 3 1,704 42.60
22 1,835 64.0 20.31 23 89 54 19.41 15 1,669 41.73
27 1,849 64.0 20.31 24 60 83 29.83 8 1,610 40.25
26 1,549 61.0 19.35 25 71 72 25.88 16 1,600 40.00
3 1,704 60.0 19.04 26 83 60 21.56 26 1,549 38.73
15 1,669 59.0 18.72 27 70 73 26.24 23 1,511 37.78
18 1,405 55.0 17.45 28 75 68 24.44 18 1,405 35.13
2 1,335 54.0 17.13 29 59 84 30.19 2 1,335 33.38
30 1,750 51.0 16.18 30 75 68 24.44 5 1,239 30.98
465 58,191$ 2,135 677.42$ 465 2,127 2,163 777.36$ 465 58,191$ 1,454.78$
Standard Deviation 3.24
5.00 9.97
Note that the standard deviations for the three bonus pools are slightly different, ranging from a low of 3.24 for customer survey to a high of 9.97
for earnings. This difference could be a concern if the stores were of unequal size as it would potentially unfairly reward managers of larger
stores. The information in the case indicates that all of the stores are of similar size, but this result suggest one might want to examine the
potential effect of store size on the earnings component of compensation, and perhaps use a return on sales or return on assets measure that would
normalize the score for this measure.

Chapter 20 - Management Compensation, Business Analysis, and Business Valuation
20-40
The sub-pool bonuses are added to determine the total bonus for each manager, shown in TN-5.
TN-5: Total Bonus for Each Manager Using the BSC Measures and Earnings
Customer Average Wait Time Wait Time Bonus
Store No. Earnings Survey Bonus Store No. Wait Time Score Bonus Store No. Earnings Bonus
Store No.
Total Store No. Bonus
1 2,787$ 78.0 24.75$ 1 49 94 33.78$ 1 2,787$ 69.68$ 1 128.21$ 12 135.33
2 1,335 54.0 17.13 2 92 51 18.33 2 1,335 33.38 2 68.84 1 128.21
3 1,704 60.0 19.04 3 77 66 23.72 3 1,704 42.60 3 85.36 29 120.01
4 2,011 80.0 25.38 4 80 63 22.64 4 2,011 50.28 4 98.30 21 119.75
5 1,239 73.0 23.16 5 95 48 17.25 5 1,239 30.98 5 71.39 17 112.59
6 1,902 73.0 23.16 6 62 81 29.11 6 1,902 47.55 6 99.82 20 111.56
7 2,012 71.0 22.53 7 65 78 28.03 7 2,012 50.30 7 100.86 10 110.89
8 1,610 72.0 22.84 8 81 62 22.28 8 1,610 40.25 8 85.38 14 110.66
9 1,889 66.0 20.94 9 69 74 26.59 9 1,889 47.23 9 94.76 13 110.15
10 2,095 87.0 27.60 10 57 86 30.91 10 2,095 52.38 10 110.89 25 106.69
11 2,000 71.0 22.53 11 65 78 28.03 11 2,000 50.00 11 100.56 7 100.86
12 2,875 89.0 28.24 12 45 98 35.22 12 2,875 71.88 12 135.33 11 100.56
13 2,300 81.0 25.70 13 68 75 26.95 13 2,300 57.50 13 110.15 6 99.82
14 2,213 77.0 24.43 14 57 86 30.91 14 2,213 55.33 14 110.66 24 99.16
15 1,669 59.0 18.72 15 98 45 16.17 15 1,669 41.73 15 76.62 4 98.30
16 1,600 67.0 21.26 16 81 62 22.28 16 1,600 40.00 16 83.54 9 94.76
17 2,311 81.0 25.70 17 62 81 29.11 17 2,311 57.78 17 112.59 27 92.77
18 1,405 55.0 17.45 18 89 54 19.41 18 1,405 35.13 18 71.98 19 92.11
19 1,756 67.0 21.26 19 68 75 26.95 19 1,756 43.90 19 92.11 22 89.90
20 2,187 83.0 26.34 20 58 85 30.55 20 2,187 54.68 20 111.56 28 89.28
21 2,387 84.0 26.65 21 50 93 33.42 21 2,387 59.68 21 119.75 8 85.38
22 1,835 64.0 20.31 22 77 66 23.72 22 1,835 45.88 22 89.90 3 85.36
23 1,511 69.0 21.89 23 89 54 19.41 23 1,511 37.78 23 79.08 30 84.37
24 1,910 68.0 21.58 24 60 83 29.83 24 1,910 47.75 24 99.16 16 83.54
25 2,230 79.0 25.07 25 71 72 25.88 25 2,230 55.75 25 106.69 26 79.64
26 1,549 61.0 19.35 26 83 60 21.56 26 1,549 38.73 26 79.64 23 79.08
27 1,849 64.0 20.31 27 70 73 26.24 27 1,849 46.23 27 92.77 15 76.62
28 1,756 66.0 20.94 28 75 68 24.44 28 1,756 43.90 28 89.28 18 71.98
29 2,514 85.0 26.97 29 59 84 30.19 29 2,514 62.85 29 120.01 5 71.39
30 1,750 51.0 16.18 30 75 68 24.44 30 1,750 43.75 30 84.37 2 68.84$
465 58,191$ 2,135 677.42$ 465 2,127 2,163 777.36$ 465 58,191$ 1,454.78$ 2,910$
Total Bonus Rank
and 10. The lowest ranking store is now store 2 due to its relatively poor performance on the BSC measures and its relatively low earnings.

20-41
4. A variety of comments and proposals are likely. Some have been suggested in the notes for
parts 2 and 3 above. Some additional points:
a. It should be useful to guide the discussion at some point to the objectives of the bonus
plan. Which incentives are most important: earnings growth, customer service, wait
time, etc.? Perhaps some of the non-significant BSC measures which were excluded in
the above analysis should be included for other reasons.
b. What is the firm’s strategy, and how does the choice of a bonus plan fit that strategy?
The case information indicates that customer service is key to the company’s success, so
the use of BSC measures of customer satisfaction are reasonable. Are other BSC
measures, especially operational measures, also important in creating customer
satisfaction and therefore advancing the firm’s strategy; should they be included in the
bonus plan?
c. Do store managers feel that the current bonus system is fair? Would the proposed BSC-
based system be perceived as more or less fair? What amount of input, if any, should
managers have for the design of the bonus plan?
d. The stores are listed in the case from oldest to newest (store 30). How should the age of
the store be incorporated into the analysis, if at all?
Chapter 20 - Management Compensation, Business Analysis, and Business Valuation
20-42
Teaching Strategies for Readings
20-1 Using Shareholder Value to Evaluate Strategic Choices
The basic principle of the article is that performance evaluation based on accounting measures
alone is not sufficient. The evaluation of a business unit or of the unit’s manager must also consider the
business unit’s performance in creating shareholder value. Based on ideas from Alfred Rappaport’s book,
Creating Shareholder Value, the article develops the measures of cash flow and market risk. An
illustration for a hypothetical firm is provided.
Discussion Questions
1. Explain the differences between the two measurement methodologies presented in the article.
A box in the article summarizes the two methodologies. One is based on economic principles and
2. Why is it important for firms and managers to consider shareholder value?
Firms that fail to consider shareholder value make themselves vulnerable to market forces. For
strong or the firm’s management might lose control over the firm.
3. What are the key factors in determining shareholder value?
Chapter 20 - Management Compensation, Business Analysis, and Business Valuation
20-43
20-2 The Role of Strategy
This article presents a careful look at the role of local culture in the desirability of different management
control systems. Local culture is defined in terms of Hofstede’s research paradigm, including the
measures: individualism, uncertainty avoidance, power distance, masculinity, and Confucianism. The
culture of several major countries (including the U.S., U.K., Japan, Germany, and others) is considered
and suggestions are provided for designing the management controls system for foreign SBUs.
Companies should include both the firm’s strategy and the culture of the foreign country in determining
the most effective form of SBU and how it is to be implemented.
Discussion Questions
1. Identify and explain the meaning of each of the cultural factors (or “dimensions”) used in Hofstede’s
research of cultures in various countries.
There are five dimensions:
1. Power distance: indicates the extent a society accepts an unequal distribution of power
eastern and western cultures.
2. How should each of the cultural factors be used in developing effective SBU control systems?
The cultural factors can assist top management in designing the appropriate management control
system. For example, an SBU in a culture with high individualism should use performance measures at
the individual level rather than the firm level as this adapts most appropriately to the personal
individualism of the culture. Another example is a firm that has a differentiation strategy and operates in
3. For which countries do you think it would be most difficult to develop an effective management control
system, and why?
4. For which countries do you think it would be easiest to develop an effective management control
system, and why?
It is probably best to say that each country and its culture will present challenges in developing an
appropriate and effective management control system. The examples in the answer to question 2 above
give a useful guide. A look at Table 1 in the article provides information about which countries have
Chapter 20 - Management Compensation, Business Analysis, and Business Valuation
20-44
20-3 Preserving Performance Pay
The article discusses the ways in which executive compensation can be changed to more directly align
managers’ interests with those of shareholders.
Discussion Questions
The authors argue that stock-based compensation should be restructured in two key ways.
Describe each of the two ways and explain why each is important.
(1) Short vesting periods. The authors argue the majority of stock options prior to 2004 had
very short vesting periods. The vesting period is the time the executive must wait before
the executive can exercise the options. Vesting periods were as short as one year. The
effect of these short vesting periods is that executives viewed the options very nearly as a
cash bonus based on current performance, and the executives thus had the incentive to
performance measures, that is, performance measures that are controllable by the
individual executive.

Chapter 20 - Management Compensation, Business Analysis, and Business Valuation
20-45
20-4 When Strategy and Valuation Meet: Five Lessons from Return Driven Strategy
1. Explain briefly the difference between the skills need for a business strategy expert and the skills of a
business valuation expert.
The authors make the point that a successful business strategy expert must be a very competent
business valuation expert, and vice versa, and thus, the roles of the two converge. For example, a
2. Explain why a great product seldom ensures a great business.
The authors cite their research and include example companies to show that a great product does not
necessarily produce a great, valuable company. The key is the competitive environment and the
customer needs. There may be competitors that supply the same great product but at a better price or
3. Explain why being “different” is not central to strategy.
The explanation here follows closed on that in part 2 above. That is, the “differences” have to be
4. Explain the difference between a great company and a great stock.
The explanation here follows from the above. A great product does not mean a great company and a
great company does not mean a great stock. A great stock is one for which investors see a relatively
certain and positive direction in earnings and, particularly, cash flows. Investors may see for
example the same level of cash flows in Company A as in Company B in the current year, but have
5. Explain when and why growth is not necessarily a good thing.
Substantial growth can lead to financial difficulties, as can be seen in the poor financial performance
of many financial and construction firms’ since 2007. The basic idea is that the increase in assets or


