
Chapter 20 – Management Compensation, Business Analysis, and Business Valuation
20–16
benefit.
Cumulative Goodwill Amortization. Goodwill arises when the acquisition of another firm is
recorded as a purchase and there is an excess of cost over the fair value of the net assets acquired. The
amount of the goodwill recorded can be amortized against earnings over a period not to exceed 40 years.
To make this non-cash, non-tax-deductible item the non-issue it really is, the amortized amount should be
added back to reported earnings. And, to be consistent, the cumulative goodwill that has been amortized
must be added back to equity capital and to goodwill remaining on the books. By un-amortizing goodwill
in this way, the rate of return will properly reflect the true cash-on-cash yield that is of interest to
shareholders. Action(s) to be taken:
Add to Capital: Amount of the cumulative goodwill amortization
Add to NOPAT: The amount of increase in goodwill amortization
An Overview of the Process Involved in Calculating EVA
The solution of the OSI case is in the attached Exhibits that have been prepared for OSI (TN-1
through TN-3).
The following is a list of the steps to be completed in calculating OSI’s EVA amounts:
1. Obtain a Balance Sheet and Income Statement for 2013
2. Obtain the footnotes to those financial statements;
3. Analyze the footnotes for information on equity equivalent adjustments;
4. Obtain information on the firm’s stock, debt and interest rates;
5. Determine equity equivalent adjustment amounts by analyzing the footnotes;
6. Calculate the firm’s weighted average cost of capital;
7. Prepare worksheets of EVA statements
8. Prepare final statements of EVA showing amounts calculated for RONA (Return on Net
Assets), and EVA
Calculating EVA
EVA calculations for OSI in 2013 using the Financing Approach are detailed in Exhibit TN-3.
Refer to Exhibits TN-1 and TN-2 for relevant information on the WACC and the equity equivalent
adjustment amounts involved in these calculations.
Note: This case situation focused primarily on EVA, but other valuation-based performance
metrics exist such as NPV, CFROI, and RI. CFROI (cash flow return on investment) is a rate of return
measure calculated by dividing inflation-adjusted cash flow from the investment by the inflation-adjusted
amount of the cash investment. While CFROI does adjust for inflation, it fails to account for risk and the
appropriate required return on the project. In a sense, CFROI is similar to the internal rate of return (IRR)
⎯ after including the EE adjustments, hence it measures the investment’s return as opposed to the wealth
created or destroyed by the investment.
2. Benefits / Advantages and Disadvantages of EVA
All managers basically have the same objective ⎯ putting scarce capital to its most promising
uses. To increase their company’s stock price, managers must perform better than those with whom they
compete for capital. Then, once they get the capital, they must earn rates of return on it that exceed the
return offered by other, equally risky seekers of capital funds. If they accomplish this, value will have
been added to the capital their firm’s investors placed at their disposal. If they don’t accomplish that goal,
there will be a misallocation of capital, and the company’s stock will sell at a price that discounts the sum
total of the resources employed.
EVA is a financial management system that is well adapted to this kind of a situation since it
focuses on creating shareholder value. In using the system, managers and employees focus on how capital
is used and on the cash flow generated from it. It runs counter to the notion that long-term stock
appreciation comes from earnings.

Chapter 20 – Management Compensation, Business Analysis, and Business Valuation
20–17
Focusing on EVA growth provides two benefits: 1) management’s attention is focused more
toward its primary responsibility ⎯ increasing investor wealth; and, 2) distortions caused by using
historical cost accounting data are reduced, or eliminated. As a result, managers spend their time finding
ways to increase EVA rather than debating the intricacies of the fluctuations in the earnings reported in
their traditional accounting statements.
EVA measures the amount of value a firm creates during a defined period through operating
decisions it makes to increase margins, improve working capital management, efficiently using its
production facilities, redeploying underutilized assets, etc. Thus, EVA can be used to hold management
accountable for all economic outlays, whether they appear in the income statement, on the balance sheet
or in the financial statement‘s footnotes. EVA creates one financial statement that includes all the costs of
being in business, including the carrying cost of capital. The EVA financial statement gives managers a
complete picture of the connections among capital, margin and EVA. It makes managers conscious of
every dollar they spend, whether that dollar is spent on or off the income statement, or on operating costs
or the carrying cost of working capital and fixed assets.
Another very subtle benefit for a firm that adopts EVA is that it creates a common language for
making decisions, especially long-term decisions, resolving budgeting issues, evaluating the performance
of its organizational units and their managers, and measuring the value-creating potential of its strategic
options. An outgrowth of such an environment is that the quality of management also improves as
managers begin to think like owners and adopt a longer horizon view.
3. To this point, the emphasis has been on how focusing on EVA may help managers increase shareholder
wealth. However, for the metric to help in creating shareholder wealth, managers must behave in a
manner consistent with wealth creation. One powerful way to align managers’ interests with those of the
shareholders is to tie their compensation to output from the EVA metric. In fact, it is not just for
managers, but may be used for all employees. When implemented correctly, the basic notion of increasing
shareholder value will permeate the entire organization, and employees at all levels will then begin to act
in concert with upper levels of management.
Implementing an EVA-based incentive plan is fundamentally a process of empowerment ⎯
getting employees to be entrepreneurial, to think and act as owners, getting them to run the business as if
they owned it, and giving them a stake in the results they achieve.
The overall, firm-wide objective is to generate a persistent increase in EVA. To achieve that,
employees must understand the role they play in increasing a firm’s EVA. A key factor in sustaining a
continuing interest in EVA and in making it work is to revise the compensation system to focus on
creating value. It has been shown that one of the critical components in successfully using EVA to
improve a company’s MVA is tying it to bonuses and pay schemes. Designing an incentive compensation
system that pays people for sustainable improvements in EVA, in concert with an understanding of what
drives EVA, and what drives economic returns, is what transforms behavior within a company.
A good way to get started quickly is to increase insider ownership of the firm’s stock. One way to
do this is to turn old profit-sharing plans into employee stock-ownership plans.
If an incentive system is to work, it must have certain distinctive properties:
1. An objective measure of performance, which cannot be manipulated by one of the parties who
may benefit. For example, in many existing plans, the budget is a commonly used target for
performance, but the manager being evaluated is usually heavily involved in negotiating that
budget.
2. It must be simple so that even employees far down in the organization will understand how EVA
is tied to economic value and can follow it well.
3. Bonus amounts have to be significant enough in amount for employees to alter their behaviors.

Chapter 20 – Management Compensation, Business Analysis, and Business Valuation
20–18
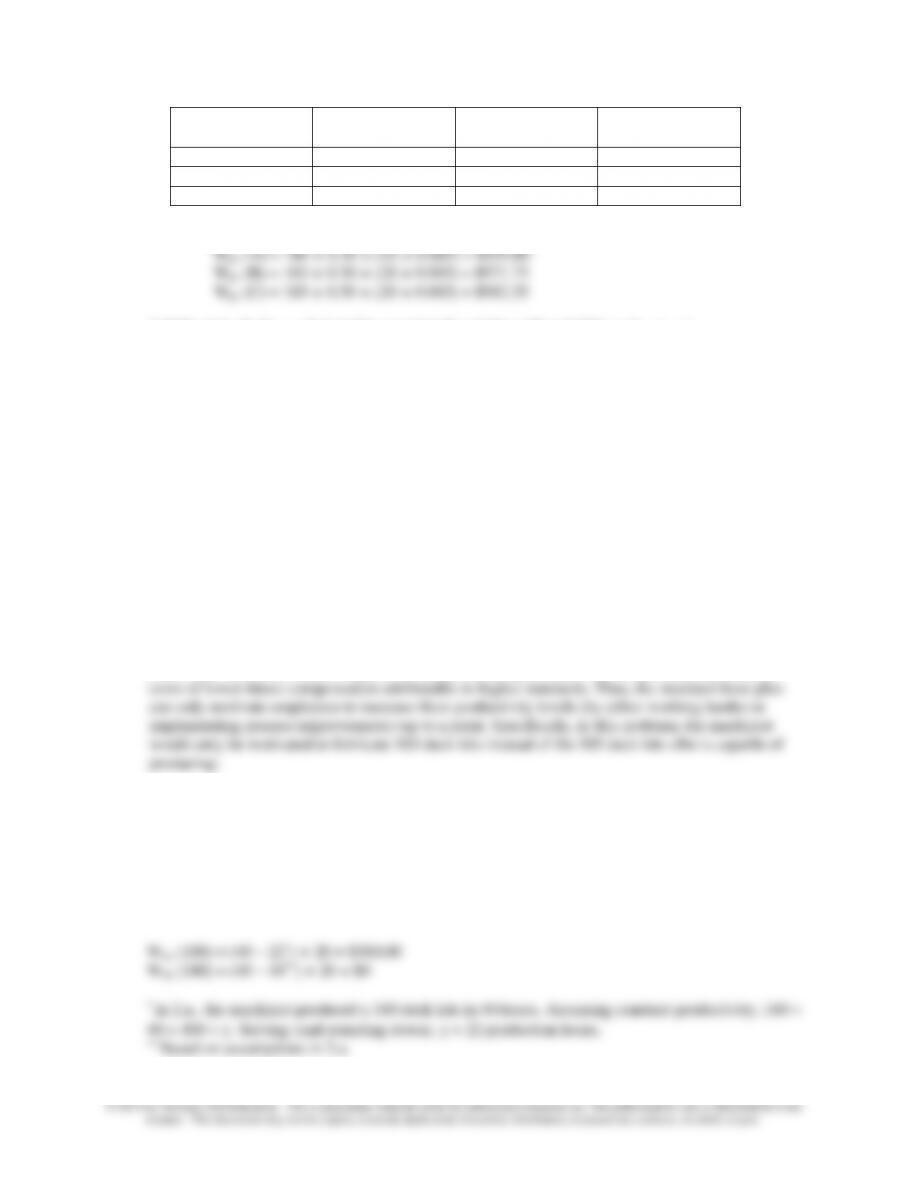
Exhibit TN-1
Financial Data Input and Calculation of Interest Rates/Expense:
Calculate Weighted Ave. Cost of Capital – Based on Market:
Rate
Interest
Weights:
Pct of Total
Short-term Debt:
$8,889
8.00%
$711
Long-term Note Payable
$117,155
17.8%
Long-term Debt: Current portion
$18,411
10.00%
$1,841
Preferred Stock
Long-term Debt: Long-term portion
$98,744
10.00%
$9,874
Shares o/s
1,000
$117,155
Interest paid=
$12,427
Par value
$100
$100,000
15.2%
Common Stock
Risk-free rate (90 day T-bills)=
5.0%
Shares o/s
219,884
Return on the Market=
12.5%
Market value
$2.00
$439,768
66.9%
Beta Value of common stock=
1.2
———
Tax Rate=
35.0%
$656,923
Price per share of common stock=
$2.00
Weighted Average Cost of Capital
For Debt=
1.159%
Calculated Cost of Equity Capital:
14.0%
For Preferred Stock=
1.674%
Common stock dividend/share paid last year=
0.111
per share
Common Stock=
9.372%
Total common stock dividend paid last year=
$24,429
——-
Calculated current dividend yield (last year)=
5.555%
12.206%
Expected growth rate of dividends=
8.000%
Future dividend yield (next year)=
5.999%
Calculate Weighted Ave. Cost of Capital – Based on Book Value:
Common stk dividend/sh. expected-next year=
0.120
Weights:
Pct of Total
Total common stock dividend to pay next year=
$26,383
Long-term Note Payable
$117,155
22.1%
Check: Calculated Future dividend yield (next year)=
5.999%
Preferred Stock
Preferred stock dividend/share paid last year=
$11.00
per share
Shares o/s
1,000
Total preferred stock dividend paid last year=
$11,000
Par value
$100
$100,000
18.9%
Total preferred stock dividend for next year=
$11,000
Common Stock
Share Book Value
$219,884
Paid-in capital
$32,056
59.0%
Retained earnings
$61,125
$313,065
————
$530,220
Weighted Average Cost of Capital
For Debt=
1.436%
For Preferred Stock=
2.075%
Common Stock=
8.266%
——-
11.777%

Chapter 20 – Management Compensation, Business Analysis, and Business Valuation
20–19
Exhibit TN-2
OutSource, Inc.
Pertinent Information Extracted from the Footnotes to the Annual Report
Footnote
A.
Inventories are stated principally at cost (last-in, first-out), which
is not in excess of market. Replacement cost would be $2,796 greater
than in 2012 and $3,613 greater in 2013.
$3,613
Add to Inventory and Capital: Amount of the LIFO reserve
$817
Add to NOPAT: The amount of increase in the LIFO reserve
B.
Deferred tax expense results from timing differences in recognizing
revenue and expense for tax and reporting purposes.
$6,784
Include as Capital: Amount of the Deferred tax reserve
$1,934
Add to NOPAT: The amount of increase in the deferred tax reserve
C.
On July 1, 2011, the Company acquired CompuPay. The acquisition has been
accounted for as a purchase, and the excess of cost over the fair value of net
assets acquired was $109,200, which is being amortized on a straight-line basis
over12 years. One-half year of amortization was taken in 1993.
$21,000
Include as Capital: Cumulative amount of goodwill that has
been amortized to date.
$8,400
Add to NOPAT: The amount of increase in Goodwill amortization
D.
Research and development costs related to software development are expensed as
incurred. Software development costs are capitalized from the point in time when
the technological feasibility of a piece of software has been determined until it is
ready to be put on line to process customer data. The cost of purchased software,
which is ready for service, is capitalized. Software development and purchased
software costs are amortized using the straight-line method over periods ranging
from three to seven years. A history of software development cost items follows:
Expensed
Capitalized
Amortized
2011
$166,430
$9,585
$0
2012
$211,852
$5,362
$4,511
2013
$89,089
$18,813
$5,111
———
———
———
$467,371
33,760
$9,622
$9,622
Include as Capital: Cumulative amount of software development
costs that have been amortized to date.
$467,371
Include as Capital: Cumulative amount of software development
costs that have been expensed to date.
$5,111
Add to NOPAT: The amount of increase in Goodwill amortization

Chapter 20 – Management Compensation, Business Analysis, and Business Valuation
20–20
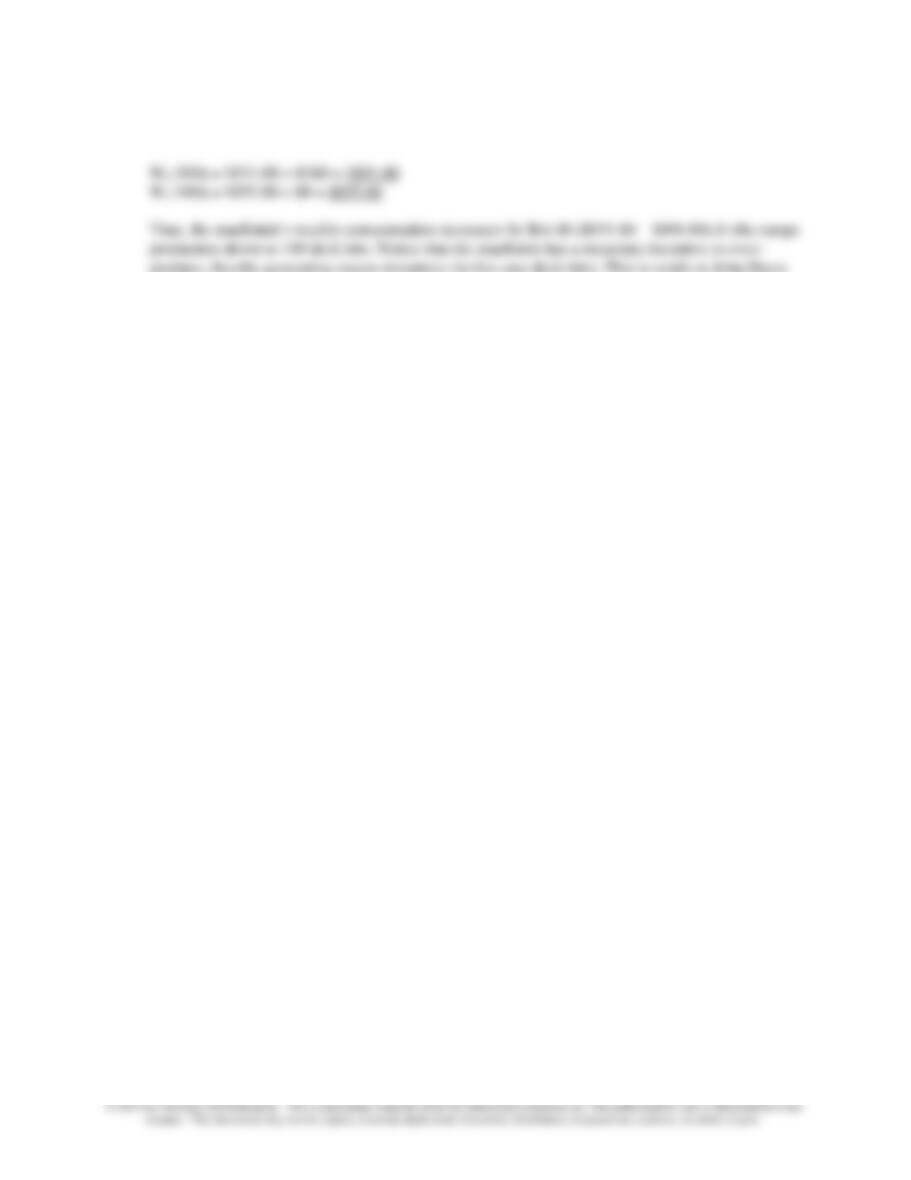
Exhibit TN-3
OutSource, Inc.
OutSource, Inc.
EVA Capital via Financing Approach
EVA NOPAT via Financing Approach
Balance Sheet, December 31,
2013
Income Statement
2013
LIABILITIES & NET WORTH
Current liabilities
Income Available to Common
$40,616
Short-term debt and current portion
of long-term note
$27,300
Deferred Taxes (Increased)
1,934
(B)
Long-term debt less current portion
98,744
Lifo Reserve (Increased)
817
(A)
————
Goodwill Amortization
8,400
(C)
Total Debt
126,044
Software Dev. Costs Amortization
5,111
(D)
Software Dev. Costs Expensed
89,089
(D)
Equity Equivalents
————
Deferred income taxes
6,784
(B)
Increase in Equity Equivalents
105,351
LIFO Reserve
3,613
(A)
Accum Goodwill Amortization
21,000
(C)
Adjusted Income Available to Common
$145,967
Accum Software Dev. costs Amortization
9,622
(D)
Capitalize amounts of Software dev.
Add: Adjusted Interest Expense
12,427
costs that have been expensed.
467,371
(D)
Less: Tax Benefit of Interest Expense
(4,349)
————
Interest Expense After Taxes
8,077
Total Equity Equivalents
508,390
EVA NOPAT via Financing Approach
$154,044
Shareholders’ Equity:
Cumulative Convertible Exchangeable
Return on Net Assets (RONA) = NOPAT / Capital
Preferred Stock, $100 par value, authorized
EVA NOPAT via Financing Approach =
$154,044
5,000 shares, 1,000 shares issued and
EVA Capital via Financing Approach =
$1,047,499
outstanding
100,000
RONA =
14.71%
Shareholders’ Equity:
Calculate EVA – Based on:
Market Value
Book Value
authorized; 219,884 shares issued
Weighted Ave. Cost of Capital (WACC) =
12.21%
11.78%
and outstanding
219,884
EVA = (RONA – WACC) * Capital =
$26,189
$30,680
Addtl Paid in Capital
32,056
Retained Earnings
61,125
————
Adjusted Shareholders’ Equity
413,065
————
EVA Capital via Financing Approach
$1,047,499
=========
Chapter 20 – Management Compensation, Business Analysis, and Business Valuation
20–21
20-4 John Deere Case
Question 1: As discussed in the case, performance-evaluation and reward systems play a fundamental
role in guiding employees’ actions and, optimally, such systems should induce employees to engage in
organizationally desirable behaviors. When entering into labor contracts, employees and employers likely
have differing objectives. On the one hand, employees want to maximize the benefits they extract from
their relationship with the organization. Employees likely desire to maximize their compensation,
minimize their effort, and perform tasks that provide the most intrinsic enjoyment (and future
compensation). Employers (owners), on the other hand, hire employees to increase an organization’s
value. They want employees to exert high levels of effort towards projects with the greatest expected
payoffs for the lowest possible cost.
Performance-evaluation and reward systems should dampen, if not mitigate, the conflicts of interest
between employees and employers. To this end, performance-evaluation and reward systems serve many
vital functions in an organization (most of these are directly or indirectly discussed in the case). First,
such systems serve a motivational role whereby employees are enticed to exert high levels of effort
(duration and intensity) on organizational endeavors. In this regard, such systems not only need to
production quantity or quality. Additionally, employees can choose to perform more routine, day-to-day
activities, or engage in thinking about innovative ways to improve the process. Moreover, performance–
evaluation and reward systems should make it profitable for employees to apportion their work effort to
the tasks and activities with the highest expected returns to the organization.
Third, performance-evaluation and reward systems serve an extracting role. Employees typically know
and efficiency of the production process, thereby reducing the cost, improving the speed, and/or
increasing the quality of production. Performance-evaluation and reward systems should make it
profitable for employees to share their private information with other members of the organization.
Finally, performance-evaluation and reward systems serve an attracting role. Such systems should entice
employees with the requisite abilities and skills desired by the organization to seek employment with the
facilities of John Deere. Indeed, just about every organization, be it private, public, or not-for-profit, has a
performance-evaluation and reward system in place. For example, sales persons frequently are evaluated,
and receive a large part of their compensation, based on sales. Such compensation systems are used to: (1)
motivate sales persons to spend their time selling units; (2) focus sales persons’ attention on selling and
sales-related activities; (3) get sales persons to use their knowledge about the product and their customers
Chapter 20 – Management Compensation, Business Analysis, and Business Valuation
20–22
to sell more units (in turn, the company finds out which products are selling best, which customers are
buying, and where/when customers are buying); and (4) attract people who are skilled at sales and/or
motivated to sell. For similar reasons, a waiter or waitress’ compensation is linked to tips, a middle
manager’s compensation is linked to divisional performance, and an executive’s compensation is linked
to his/her company’s stock price and/or net income.
More generally, just about everyone’s performance is routinely evaluated and rewarded (or punished) by
person. For example, an instructor uses examinations to both motivate and direct student effort. This same
instructor may use student peer evaluation forms to extract information about the relative effort levels of
group members. Finally, instructors’ course policies and grading procedures are publicly available,
serving to attract students interested in the subject matter and work requirements.
Question 2:
2.a. Using formulas 1-3 from the case text, the machinist’s compensation for the week is (notice that Oa
> Os; i.e., 180 > 133.33 (40/0.3))
2.b. If 185 deck kits are fabricated, then the machinist’s compensation for the week is:
Notice that compared to question 2.a (when 180 deck kits were fabricated), the machinist’s
compensation is higher. When standards are held constant, fabricating more deck kits (by either
exerting greater effort or implementing process improvements) leads to greater compensation.
Thus, under the standard-hour plan, the machinist should be motivated to increase his/her
productivity.
As described in the case text and illustrated in this problem, however, standards under the standard-
probability of an audit, the machinist’s expected two–week compensation (again using formulas 1-3
in the case text) for the three scenarios presented in Table 2 is calculated below:
Chapter 20 – Management Compensation, Business Analysis, and Business Valuation
20–23
Choice
Wp (period 1)1
Wp (period 2)
Expected2
Total
Expected Pay
A
$955.80
$955.80
$1,911.60
B
$971.73
$958.77
$1,930.50
C
$982.35
$923.41
$1,905.76
1: Wp1 (A, B, C) = (# deck kits completed) × 0.30 × (20 × 0.885)
2: E[Wp2] (A, B, C) = (# deck kits completed) × 0.30 × (20 × 0.885) × (1 – paudit)
+ (# deck kits completed) × (revised standard) × (20 × 0.885) × paudit
E[Wp2] (A) = 180 × 0.30 × (20 × 0.885) = $955.80
E[Wp2] (B) = [(183×0.30×20×0.885) × 0.80] + [(183×0.28×20×0.885) × 0.20] =
$958.77
E[Wp2] (C) = [(185×0.30×20×0.885) × 0.10] + [(185×0.28×20×0.885) × 0.90] =
$923.41
Choice B maximizes the machinist’s expected two-week compensation. Notice that even though
output is highest under choice C, the machinist’s second-period (and beyond) compensation is
expected to be lower than choices A and B because of the likely increase in the standard – i.e., John
Deere is likely to ratchet-up the employee’s standard and extract some of the first-period
compensation. John Deere, on the other hand, clearly prefers choice C because production per labor
hour is highest and cost per unit of production is lowest.
This problem illustrates the inherent tradeoff faced by employees evaluated under the standard-
hour plan. Specifically, when deciding whether to increase their productivity levels, employees
must trade-off the benefits of higher current period compensation with the potential (uncertain)
2.c. Using equation (1) from the case text, the machinist’s production wages for 100/180 deck kits are:
Wp (100) = 100 × 0.30 × (20 × 0.885) = $531.00
Wp (180) = 180 × 0.30 × (20 × 0.885) = $955.80
Using equation (2) from the case text, the machinist’s non-production wages for 100/180 deck kits
are:
Chapter 20 – Management Compensation, Business Analysis, and Business Valuation
20–24
Using equation (3) from the case text, the machinist’s total wages for 100/180 deck kits are:
produce, thereby generating excess inventory (in this case deck kits). This is costly to John Deere
on several fronts: (1) increased inventory holding costs – in this case an extra $80 per week; (2)
potential for spoilage, damage, costly rework, and/or obsolescence due to holding inventory; (3)
muted incentives for employees to engage in any activity other than production such as training
new employees or helping co-workers.
2.d. Employee A – compensation under John Deere’s contract and the competitor’s contract:
Wp (JD) = 180 × 0.30 × ($20 × 0.885) = $955.80
Wp (competitor) = 40 × $20 = $800.00
Employee B – compensation under John Deere’s contract and the competitor’s contract:
Wp (JD) = 100 × 0.30 × ($20 × 0.885) = $531.00
Wp (competitor) = 40 × $20 = $800.00
Employee A maximizes her weekly compensation by choosing to work for John Deere while
Employee B maximizes his compensation by choosing to work for John Deere’s competitor. This
example illustrates that incentive-based compensation contracts can serve as useful sorting
(screening) mechanisms, thereby attracting employees with the highest levels of ability and
motivation.
2.e. As illustrated in questions 2.a and 2.b, the standard-hour plan can motivate employees to work hard.
In the absence of standard adjustments, employee compensation strictly increases as production
increases. Unfortunately, substantial increases in productivity can also trigger audits and standard
increases – thus, employees may withhold effort in certain situations (as shown in question 2.b). As
illustrated in question 2.d, the standard-hour plan also can attract employees with high levels of
skill and motivation.
As illustrated in question 2.c, the standard-hour plan does not always direct employees to activities
that provide John Deere the most value. Under the standard-hour plan, employees do not have
strong incentives to cooperate with, or assist, co-workers. Additionally, the standard-hour plan can
encourage overproduction. Finally, as illustrated in question 2.b, the standard-hour plan likely
penalizes employees for sharing production-related information. Moreover, employees’ private
information regarding the production process is likely to lead to large increases in performance – in
turn, large increases in performance are likely to lead to large increases in standards. Thus,
employees can find themselves being penalized for sharing their private information – i.e., they
could be working harder for less pay.
All in all, the goals of John Deere and its manufacturing employees are not perfectly aligned under
the standard-hour plan.
Chapter 20 – Management Compensation, Business Analysis, and Business Valuation
20–25
Question 3:
Organizations can reap many benefits by moving from an individual-based to a team-based
performance-evaluation and reward system. First, team-based compensation schemes allow
performance measures to be collected at a more aggregate level. The use of aggregate information
is especially advantageous when it is costly to collect information at the individual level. This can
generate tremendous cost savings – for example, by moving to a team-based compensation plan,
John Deere no longer needed to employ a large number of industrial engineers to monitor
individual performance (as stated in the case text, this alone saved John Deere over $32 million per
year).
A second advantage to organizations is that team-based plans can foster a cooperative atmosphere
among employees. Performance evaluation and reward systems based on group performance
monitor each other’s performance. Since each individual’s compensation is tied to the collective
efforts of the group, there are incentives to ensure that every team member is contributing at a high
level.
There are, of course, possible costs to organizations associated with moving from individual-based
to team-based compensation arrangements. First, while individuals can encourage and monitor the
effort levels of fellow employees under team-based plans, this influence might be used to enforce
Another cost to organizations of team-based plans is that they can provide incentives to employees
to free-ride off the effort of others. Because individuals only receive a portion of the benefit for
each unit of effort (1 the number of team members), individuals under team based performance-
evaluation and reward systems frequently have an incentive to shirk and rely on other members to
accomplish the team’s objectives. This can lead to a classic public-goods dilemma and low levels
of production.
around each member’s strengths and weaknesses (promoting collaboration and effort-sharing).
Another benefit to employees is that team-based plans allow risks inherent in manufacturing
environments to be shared across all team members. That is, under a group-based plan, lost
compensation attributable to a “bad” event that is outside the control of the team (such as a
machine breakdown) is equally shared by all. Under an individual-based compensation plan,
Chapter 20 – Management Compensation, Business Analysis, and Business Valuation
20–26
Despite the potential benefits of using group-based plans to evaluate and reward performance,
these plans also can impose costs on employees. Because group-based plans make individual
compensation highly dependent upon the actions of others, group members would be motivated to
impose harsh penalties on employees not contributing at a high level to the team. For example, at
John Deere individuals have been subject to “parking lot diplomacy” and other forms of negative
group recourse since CIPP’s inception. Moreover, team-based plans have the potential to create an
environment that breeds distrust and conflict among employees.
Finally, group-based plans can raise equity concerns among team-members. Specifically, under a
group-based plan, the compensation of highly skilled and/or hard working employees could be
reduced by lower skilled and/or effort-averse employees (and vice-versa). That is, group-based
plans may under-compensate hard-working and/or highly skilled employees and over-compensate
lesser skilled, or more effort-averse, employees. Such equity issues could lead to employees being
less satisfied with team-based, rather than individual-based, compensation.
Question 4:
4.a. Using equation (4) in the case text, the adjustment factor, A, for the team is calculated as follows:
Team input hours = 30 employees × 40 hours per employee = 1,200 hours
Team standard output hours = 180 units × 6.5 hours per unit = 1,170 hours
Ea (actual team efficiency) = 1,170 1,200 = 0.975
employees). As mentioned in the teaching note to question (3), this could lead to equity concerns
among employees. That is, the machinist could feel s/he is working just as hard under CIPP as
under the standard-hour plan. However, since pay is linked to the productivity of others, his/her
compensation might actually decrease under CIPP.
4.b. The Machinist’s Weekly Compensation—185 Mowers Produced
Using equation (4) from the case text, the adjustment factor, A, for the team is calculated as
follows:
Team input hours = 30 employees × 40 hours per employee = 1,200 hours
Using equation (5) from the case text, the machinist’s compensation for the week is:
Wt = 40 × 20 × 1.201 = $960.80
Chapter 20 – Management Compensation, Business Analysis, and Business Valuation
20–27
Notice that compared to question 4.a (when the team produced 180 mowers), the machinist’s
compensation is higher. When team benchmarks are held constant, producing more mowers (by
either working harder or implementing process improvements) leads to higher compensation. Thus,
similar to the standard-hour plan, CIPP should motivate employees to increase their productivity.
The Machinist’s Compensation over the next two Bi-annual Periods – 180 Mowers Produced
If the team chooses to keep production stable at 180 mowers per week, then the machinist would
earn $943.20 per week (calculated in 4.a above). Thus, the machinist’s compensation over the next
two bi-annual periods (one year) would be:
Ea (actual team efficiency) = 1,202.5 1,200 ≈ 1.002
Eb (benchmark efficiency) = 0.94
So, A = {([(1.002 – 0.94) 0.94] × 0.67) + 1} × 1.15 ≈ 1.201
In turn, using equation (5) the machinist’s compensation for the week is:
Wt = 40 × 20 × 1.20 = $960.80
Thus, the machinist’s compensation for bi-annual period 1 (before the bonus) would be:
Bi-annual Period 2 Compensation
Since the team exceeded the standard by over 6.49 percent (the adjustment was over 120 percent),
the new benchmark for the team will be approximately 1.001 (0.94 × 1.0649).
Using this new benchmark and equation (4) from the case text, the adjustment factor, A, for the
team is calculated as follows:
Team input hours = 30 employees × 40 hours per employee = 1,200 hours

Chapter 20 – Management Compensation, Business Analysis, and Business Valuation
20–28
The machinist’s compensation for the week is:
Wt = 40 × 20 × 1.151 = $920.80
Thus, the machinist’s compensation for bi-annual period 2 would be:
Wbi-annual period 2 = $920.80 × 26 weeks per bi-annual period = $23,940.80
Total Compensation Over the Two Bi-annual Periods
mowers) because of the one-time bonus paid for exceeding the benchmark by 6.49 percent.
More generally, when deciding whether to implement an innovation, teams evaluated and rewarded
under CIPP continue to face a tradeoff between the benefits of higher current period compensation
and the cost of being evaluated and rewarded under a higher benchmark in the future. As illustrated
in question 2.b, this is very similar to the tradeoff faced by employees under the standard-hour
plan. However, there are two fundamental differences between the tradeoff faced by employees
production efficiency. As illustrated in this question, the bonus attempts to mitigate the tradeoff
faced by manufacturing teams when deciding whether to make their production processes more
efficient.
The Labor Savings to John Deere
The reduction in the machinist’s bi-annual compensation would be $1,040 ($24,980.80 before the
benchmark increase – $23,940.80 after the benchmark increase). Thus, John Deere rewards a one-
company pays a lump sum in the present to reap permanent increases in production efficiency.
4.c. By spending non-production hours training the two newly hired employees, the machinist could
increase the productivity of these two group-members. Further, increasing the productivity of these

Chapter 20 – Management Compensation, Business Analysis, and Business Valuation
20–29
two group members would ultimately enhance the efficiency of the F725 Front Mower team. Since
the machinist’s compensation depends upon the efficiency of his or her team, the machinist would
have financial incentives to spend non-production hours training the two newly hired employees.
Thus, by linking individual compensation to team performance, CIPP rewards group-member’s
Although the standard-hour plan provides financial incentives for cooperative efforts, it is unclear
whether it is in the machinist’s best interest to train the newly hired employees. Specifically, the
machinist would have to bear the full cost of the effort required to train the newly hired employees,
but the benefit that results from this effort would be shared equally by all team members. As
described in the teaching note to questions (3) and 4.a, the machinist could feel s/he is being
inequitably rewarded for this effort.
4.d. CIPP continues to reward high skills and high effort levels since performance and pay, ceteris
paribus, strictly increase as these variables increase. Under CIPP, however, compensation levels
not only depend on individual performance but also depend on the performance of other team
members. This dependence on other team members can alter the incentives of both high-skilled and
low-skilled employees to seek employment with John Deere. High-skilled employees would likely
members. Thus, lower-skilled employees might face negative group recourse (stress) and peer
pressure to perform at levels beyond their capabilities.
4.e. Overall, CIPP appears to make improvements over the standard-hour plan in motivating effort,
extracting production information, and appropriately directing the attentions of its manufacturing
employees. To achieve these gains, John Deere likely trades-off its ability to attract the most highly
skilled employees. In the remainder of this section, we discuss some of these improvements and
tradeoffs of CIPP when compared to the standard-hour plan as well as present actual performance
results from the plan. Finally, we discuss improvements that John Deere management would like to
make to CIPP in the upcoming contract negotiations.
Motivating and Extracting Roles
Because employees know ex ante exactly when and how their standards will increase (i.e. they no
Chapter 20 – Management Compensation, Business Analysis, and Business Valuation
20–30
Specifically, Figure 1 presents the average team benchmarks for John Deere’s manufacturing
employees for the first eight bi–annual periods (four years) following CIPP’s implementation. This
figure shows that, on average, team benchmarks increased from their initial level of 0.79 to 0.92 by
benefit of the one time 5 to 10 percent bonus for the costs of higher future standards.
Instead, manufacturing teams began to produce just shy of the 120 percent adjustment level. Figure
2 presents the distribution of actual bi-annual team performance at John Deere for the past five
years. Figure 2 clearly demonstrates a discontinuity in the distribution just short of the 120 percent
benchmark adjustment level. This behavior represents a rational economic response to the
mechanistic ratchet imposed under CIPP. That is, by producing just shy of the 120 percent
adjustment level, manufacturing teams maximize their compensation without incurring an
increased future benchmark.
Thus, in the first three years following the implementation of CIPP, the plan seems to have
successfully created a “win–win” situation for the manufacturing employees and John Deere as a
whole. Employees received larger compensation in the form of one time bonuses for increasing
UAW, Caterpillar (John Deere’s primary competitor) was replacing striking UAW
employees with non-union employees. Thus, the UAW was under a tremendous amount of
pressure to complete the contract with John Deere without a strike.
Consequently, the fear of job loss or plant closures could have induced employees to agree
to wage concessions and/or standard increases that were not necessarily in their best
interest. Moreover, companies have used the threat of job loss and/or plant closures to
induce employees to agree to compensation contracts with terms more favorable to the
organization (see Arnold (1998) for a vivid example of this strategy at Caterpillar).