Chapter 2 – Implementing Strategy: The Value Chain, the Balanced Scorecard, and the Strategy Map
2-31
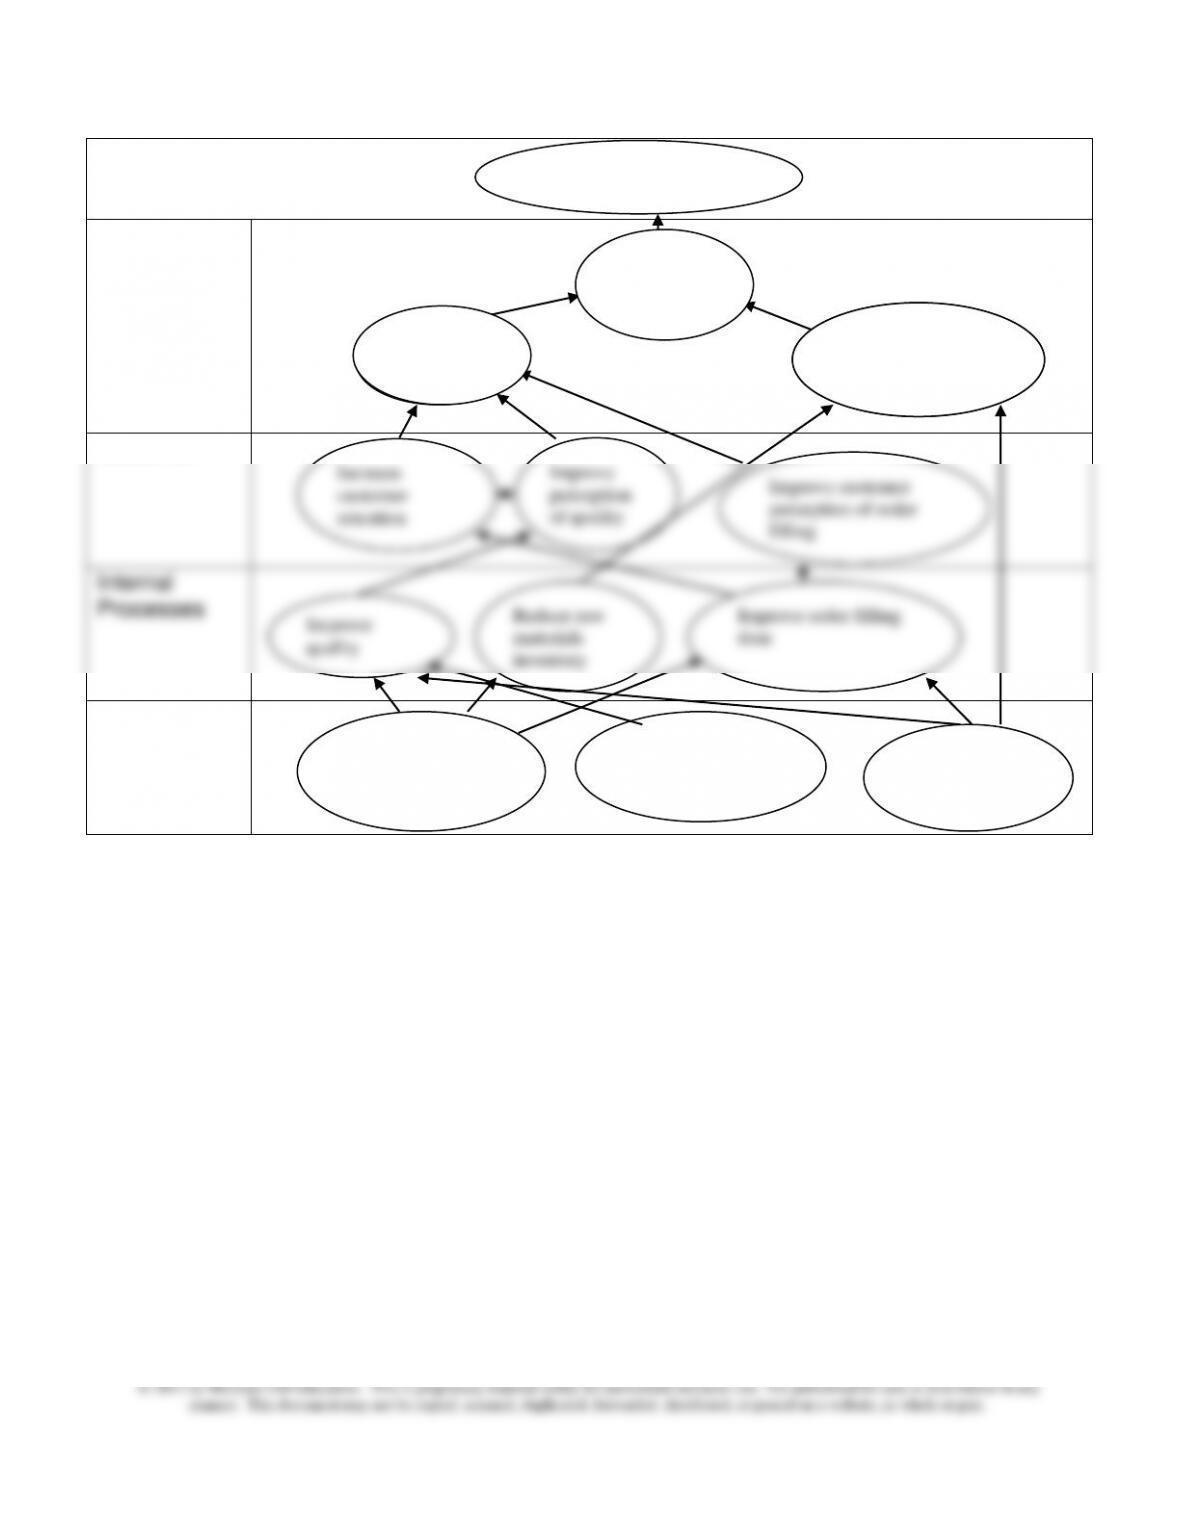
Financial
Customer
Internal
Processes
Learning and
Growth
Improve order filling
time
Improve
perception
of quality
Increase new
manufacturing
processes
Improve
quality
Evaluate emerging
technologies
Increase
training hours
Revenue
growth
Reduce cost for
each unit and for
each value stream
REturn
Return on
Investment
Reduce raw
materials
inventory
Increase
customer
retention
Shareholder Value
Sales Growth
Return on
Investment
Reduce operating
costs and selling
expenses
Improve customer
perception of order
filling
Chapter 2: Implementing Strategy: The Value Chain, the Balanced Scorecard, and the Strategy Map
2-32
2-46 Strategic Analysis (15 min).
Jim’s new business is likely to face great competition, as there
are already a number of firms in this market. What Jim must do to
have a successful business is differentiate his business from the
other Internet firms. Since the current competition is successful at
low cost and fast delivery, Jim must seek other ways to differentiate
his business. Because of his experience, it is likely that he can
information for setting prices, evaluating product profitability, and
evaluating potential new products. These cost management methods
are explained in Part Two of the book.
Chapter 2 – Implementing Strategy: The Value Chain, the Balanced Scorecard, and the Strategy Map
2-33
2-47 Strategic Analysis (30-40 min)
1. Performance Bicycles: The on-line retail industry is very
competitive, so the competitive strategy is likely to be both cost
leadership (since catalog shoppers can readily find the lowest price)
and differentiation (the mail order customers will differentiate on
2. Oxford Omni: Because the customers are primarily business and
convention visitors, the Omni is likely to compete on differentiation,
given a market-set price and therefore cost. The business traveler is
3. Orange County Public Health Clinic: A strategic goal for a public
agency is compliance with the charter of the organization, including
spending in approved ways. Thus, a critical success factor for the
services. The cost management information can be used as the
basis for requests for increased funding from governmental agencies,
or for donations from foundations and other donors.
4. Harley-Davidson Motorcycle Co.: With the introduction of
Japanese motorcycles in the U.S. in the late 1960s and 1970s,
Chapter 2: Implementing Strategy: The Value Chain, the Balanced Scorecard, and the Strategy Map
2-34
2-47 (continued -1)
unique style of cycle) plus increased emphasis on cost reduction and
problem 2-56.
5. Merck Pharmaceutical Company: A manufacturer of
pharmaceuticals such as Merck Company competes primarily on the
basis of differentiation. Cost management is used to assist the
company in managing the costs of developing new drugs. The
likely to be research and development accomplishment (innovation),
effective advertising, excellent results in clinical trials and reports, and
recognition by key medical staff and institutions.
6. St. Sebastian’s College: A small liberal arts college is likely to
compete primarily on the basis of differentiation. The differentiation
might be the nature of the programs offered, religious affiliation,
location, or some other attractive feature of the college. Cost
prices given in the marketplace. Critical success factors are likely to
be measures of recruiting effectiveness (number of applicants, quality
of applicants…), student/faculty ratio, achievement in sports, facilities
management, etc.
2-35
2-48 Strategic Analysis; The Camera Industry (40-50 min)
1. The objective of this problem is to have the students understand
that the concept of competition is perhaps not as simple as set out in
Porter’s framework. We use Porter’s framework because it provides a
useful organizing theme for understanding how firms compete. But
advantage.” This might be cost leadership or product differentiation.
The major point is that, by applying the cost leadership strategy for
example, a firm remains competitive and successful as long as it
remains the cost leader. Some argue that the competition in certain
industries is far too intense to have any one firm achieve more than a
temporary advantage, whether it be on cost or differentiation.
Instead, each firm must simultaneously compete on the three
competitive factors: cost (low cost and low price), quality
(conformance of the product with advertised features and
specifications), and functionality (the product’s features; its ability to
1995) that most firms in the consumer products industries do not
achieve a competitive advantage. In particular, the camera
2-36
2-48 (continued -1)
It is assumed that quality is near perfect, as is the consumer’s
expectation. Thus, the camera firms work hard at identifying the key
desires (Olympus hires sales agents to work in retail camera stores to
identify customer preferences, for example).
2-37
2-48 (continued -2)
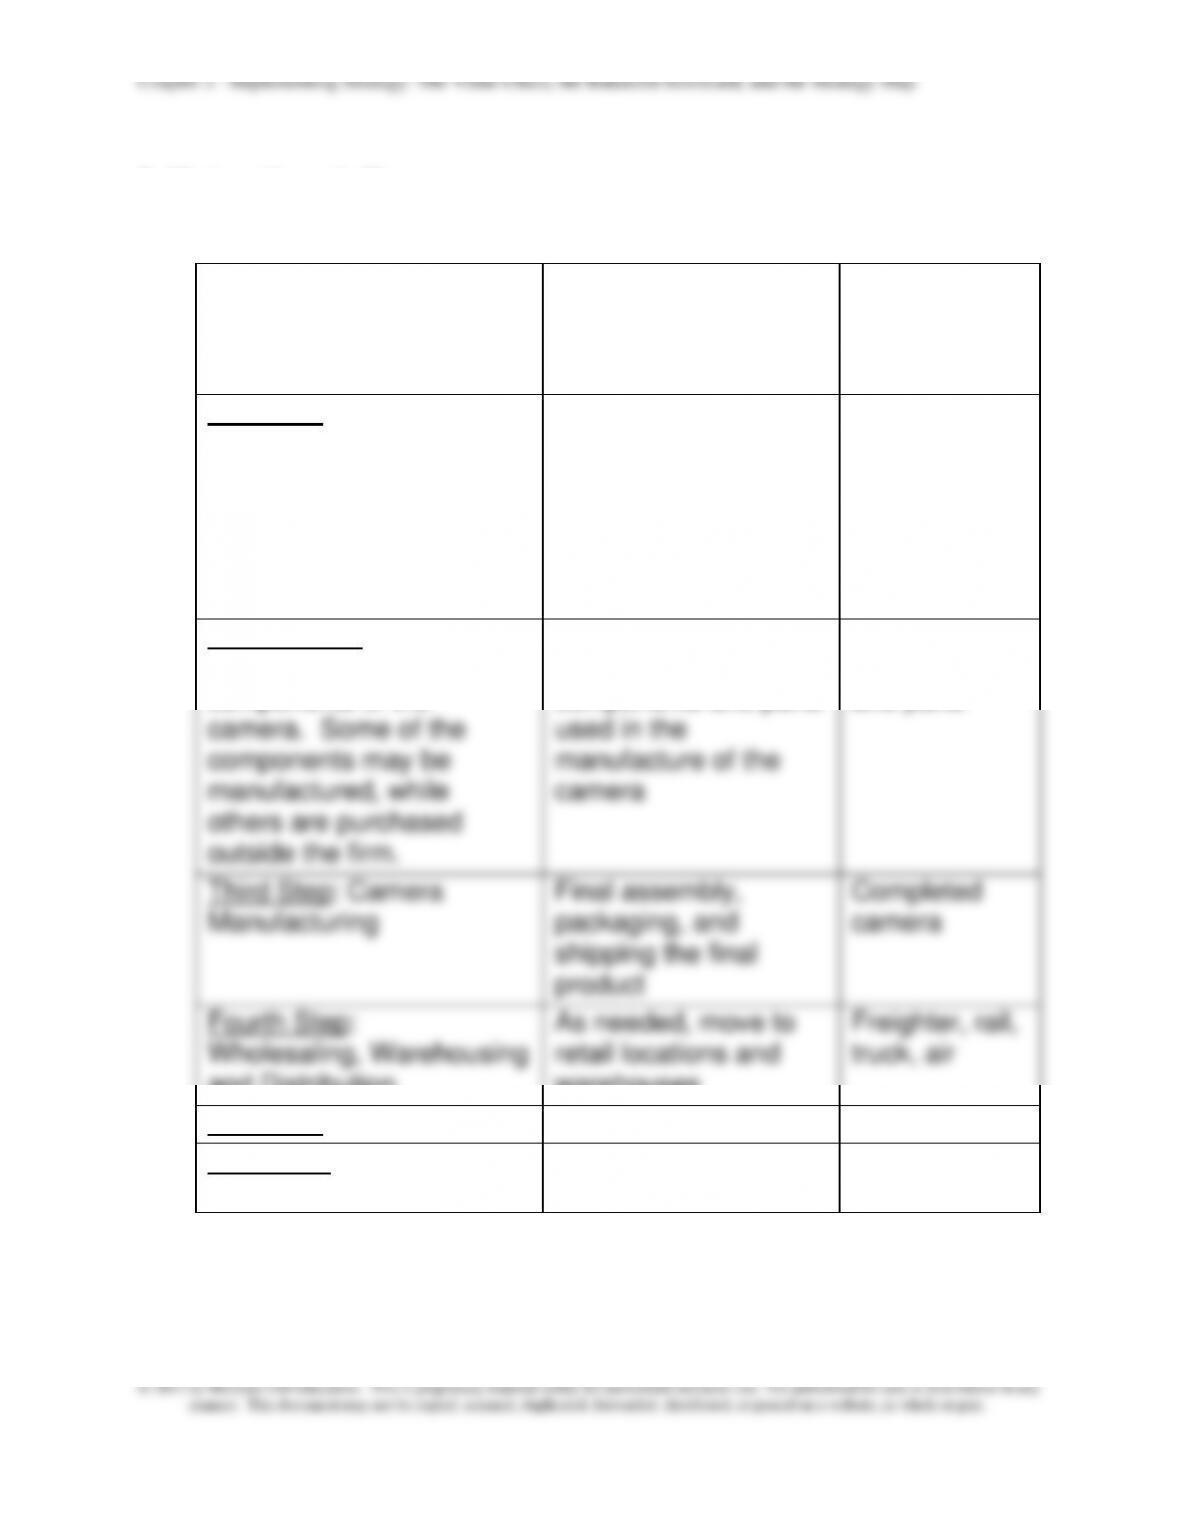
2. A value chain for Olympus Camera Company follows:
STEPS IN THE VALUE
CHAIN
ACTIVITIES AT
EACH STEP OF THE
VALUE CHAIN
EXPECTED
OUTPUT OF
EACH
ACTIVITY
First Step: Acquire raw
materials
Purchase from
appropriate vendors;
maintain effective
long-term relationships
with the vendors;
objectives: flexibility,
low cost, and quality.
High quality,
low cost parts
and materials
Second Step: Assemble
materials and parts into
components of the
camera. Some of the
components may be
manufactured, while
others are purchased
outside the firm.
Raw materials are
converted to
components and parts
used in the
manufacture of the
camera
Desired
components
and parts
Third Step: Camera
Manufacturing
Final assembly,
packaging, and
shipping the final
product
Completed
camera
Fourth Step:
Wholesaling, Warehousing
and Distribution
As needed, move to
retail locations and
warehouses
Freighter, rail,
truck, air
Fifth Step: Retail Sales
Retail sale
Sixth Step: Customer
Service
Process returns,
inquiries and repairs
Chapter 2: Implementing Strategy: The Value Chain, the Balanced Scorecard, and the Strategy Map
2-38
2-48 (continued -3)
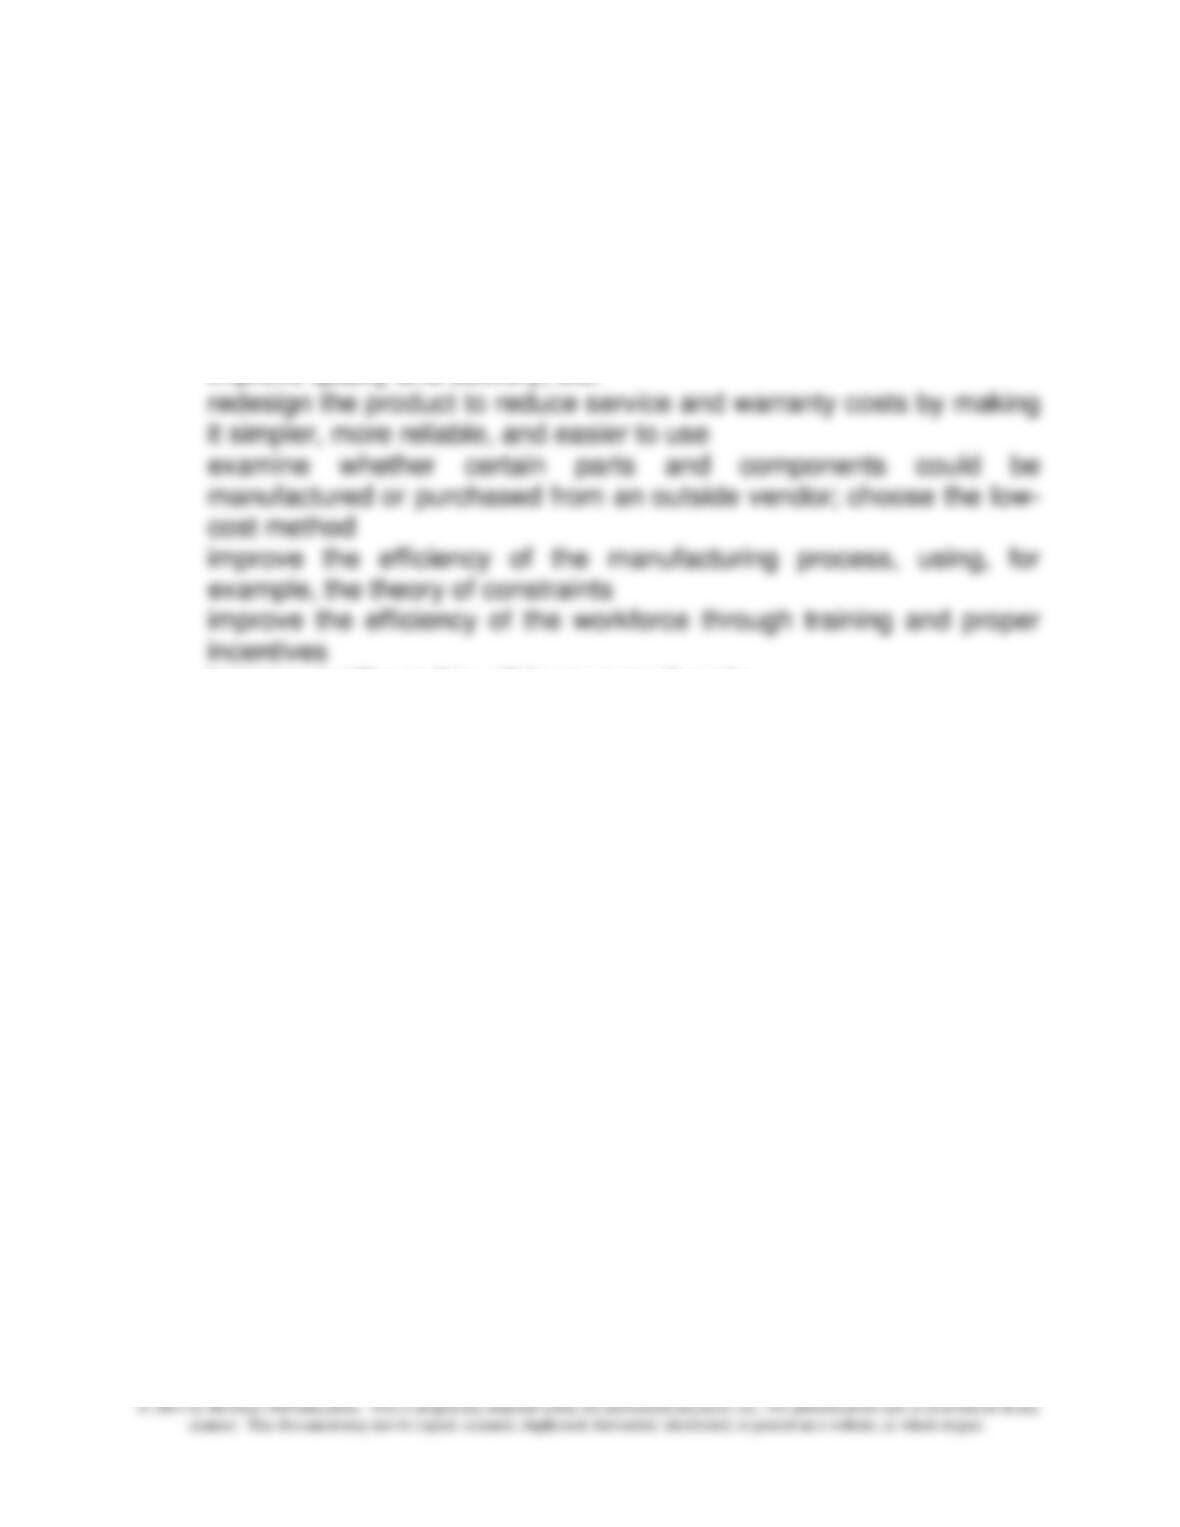
The opportunities for cost reduction/value enhancement include:
redesign to reduce materials cost and to speed the manufacturing
process
replace expensive materials with less expensive materials, e.g., metal
parts for plastic, effective vendor relationships to reduce costs,
improve quality and delivery, etc.
improve quality as this will lower overall costs
reduce the cost of distributing the product
reduce the complexity of the product, so that it will still meet the
desired functionality at the given price point
Chapter 2 – Implementing Strategy: The Value Chain, the Balanced Scorecard, and the Strategy Map
2-39
2-49 Strategic Analysis; The Balanced Scorecard, and Value-Chain
Analysis; The Packaging Industry (40-50 min)
1. Dana’s strategy had previously been primarily a cost-leadership
strategy, but with the new focus on high-end markets, the strategy
has changed to differentiation. Can Dana compete as effectively as a
differentiator as it can as a cost-leader? The change has required a
competitors in the new markets? How is competition in these new
markets likely to change over the coming months?
2-49 (continued -1)
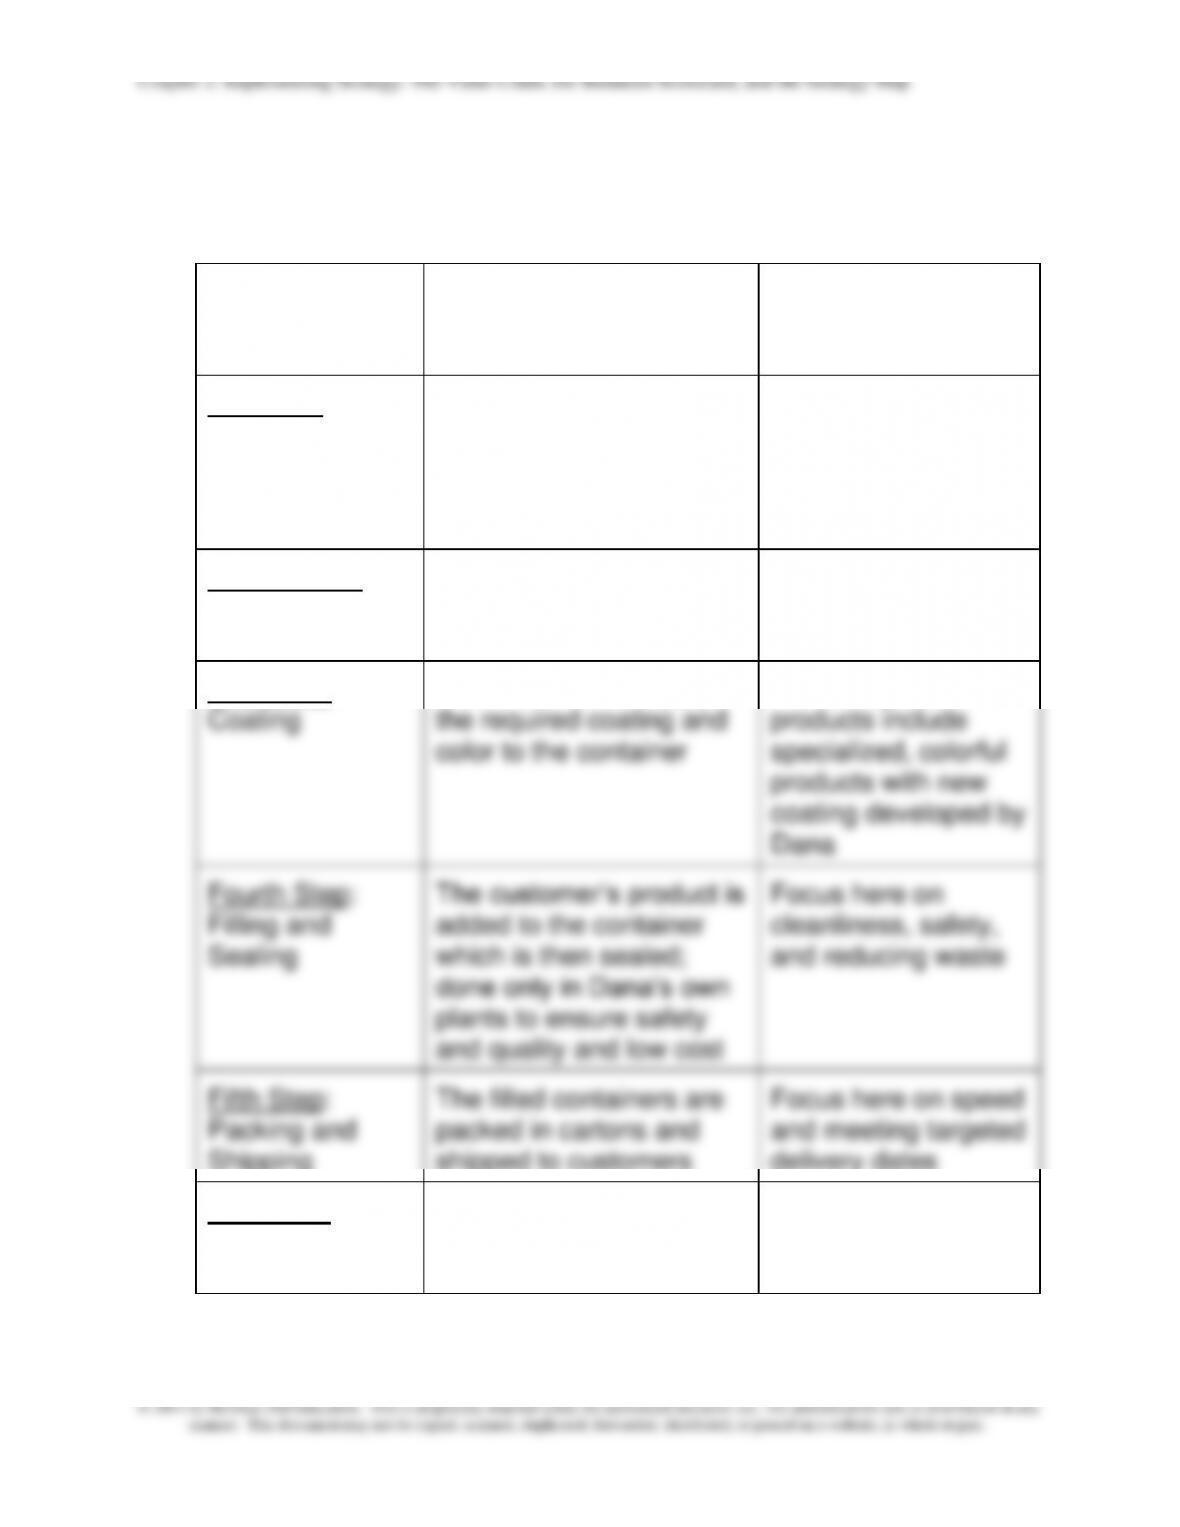
2. A value chain for Dana Packaging follows:
STEPS IN THE
VALUE CHAIN
ACTIVITIES AT EACH
STEP OF THE VALUE
CHAIN
EXPECTED
OUTPUT OF EACH
ACTIVITY
First Step:
Acquire the raw
materials, which
is primarily pulp
paper
Produced in Dana’s mills;
also purchased from
recycling operators
High quality, low cost
materials
Second Step:
Conversion
Converts the pulp into
paperboard
High quality
paperboard
Third Step:
Coating
When desired, to apply
the required coating and
color to the container
Increasing, Dana’s
products include
specialized, colorful
products with new
coating developed by
Dana
Fourth Step:
Filling and
Sealing
The customer’s product is
added to the container
which is then sealed;
done only in Dana’s own
plants to ensure safety
and quality and low cost
Focus here on
cleanliness, safety,
and reducing waste
Fifth Step:
Packing and
Shipping
The filled containers are
packed in cartons and
shipped to customers
Focus here on speed
and meeting targeted
delivery dates
Sixth Step:
Customer
Service
Process returns and
inquiries
2-41
2-49 (continued -2)
There are a number of opportunities for cost reduction/value
enhancement: The value-chain analysis should motivate and facilitate
make-or-buy types of analysis for each of the firm’s internal activities.
Identify activities which might be more cheaply and efficiently done
outside the company; for example, the coating process (which is now
occasionally outsourced) might be effectively outsourced to a greater
extent or entirely. The filling process is the most critical for Dana, as it
is the step where the customer’s product is handled. For strategic
weaknesses and strengths, and perhaps opportunities for
improvement.
Use the value chain to evaluate vendor relationships; are any
suppliers causing internal processing problems because of quality
problems or late delivery, etc.?
Use the value chain to identify the key cost drivers in the
business; for example, it is likely that costs in the coating activity have
increased significantly because of Dana’s move into the more colorful
and innovative types of packaging; has the manufacturing process
been changed to facilitate the increase in setups and product variety?
Chapter 2: Implementing Strategy: The Value Chain, the Balanced Scorecard, and the Strategy Map
2-42
© 2013 by McGraw-Hill Education. This is proprietary material solely for authorized instructor use. Not authorized for sale or distribution in any
manner. This document may not be copied, scanned, duplicated, forwarded, distributed, or posted on a website, in whole or part.
Identify those customers for which the cost of service and
delivery is unusually high due to the care with which the material
must be handled or to the weight, or distance, etc. Make sure that
these costs are recaptured in the pricing of the products, or
alternatively, the firm might seek more profitable customers.
3. Critical Success Factors for Dana might include:
Financial:
profit by product line
cycle time
production run time
Innovation and Learning:
training hours
productivity (learning) changes
number of new features/products developed
Chapter 2 – Implementing Strategy: The Value Chain, the Balanced Scorecard, and the Strategy Map
2-43
2-50 Strategy Requirements Under the Baldrige Quality Award
Program (30 min)
1. The Baldrige Award Program has a strong emphasis on strategy as
evidenced by the emphasis on strategic planning. This topic is given 85
process.
The second section, titled “Strategy Deployment,” asks the
organization to explain how it implements strategy. The topics from this
chapter are relevant in this regard.
2. The Baldrige Program should be a good process for a firm not only in
developing and revising its strategy, but also in strategy implementation.
In particular, each of the four parts of the seventh category, business
scorecard.
Chapter 2: Implementing Strategy: The Value Chain, the Balanced Scorecard, and the Strategy Map
2-44
2-51 Strategy; Value Chain (40-50 min)
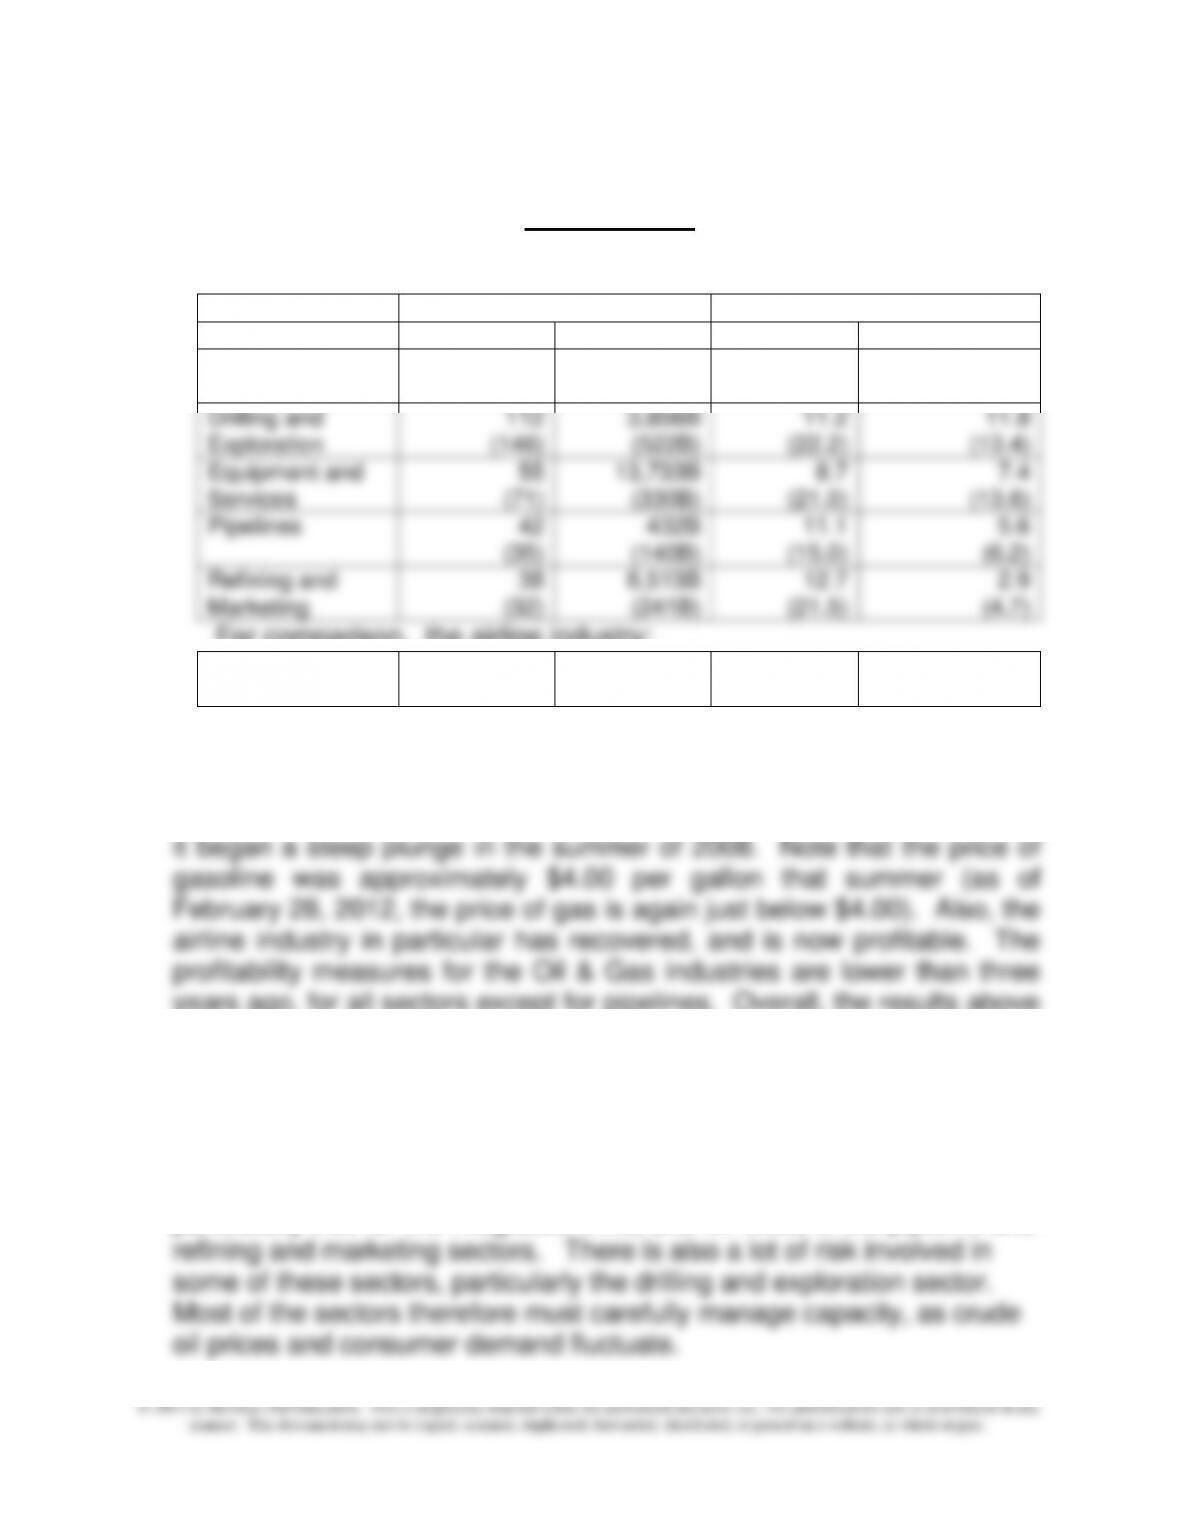
1. The following data is for July 25, 2011 (and August 26, 2008), for
public companies in the sectors of the industry.
Measures of Size
Measures of Profitability
Sector
No. of Firms
Market Cap
ROE
Profit margin
Integrated Oil
and Gas
16
(10)
40,833B
(1,608B)
15.0%
(27.3)
6.5%
(8.7)
Drilling and
Exploration
112
(146)
3,856B
(522B)
11.2
(22.2)
11.8
(13.4)
Equipment and
Services
55
(71)
13,733B
(330B)
8.7
(21.0)
7.4
(13.6)
Pipelines
42
(35)
432B
(140B)
11.1
(15.0)
5.6
(6.2)
Refining and
Marketing
38
(32)
8,513B
(241B)
12.7
(21.5)
2.9
(4.7)
For comparison, the airline industry:
Major Airlines
12
(9)
681.2
(16.8B)
40.5%
(0)
2.2%
(-15.5)
Some key observations regarding the above information: (1) market
capitalization has increased substantially for both the Oil & Gas and
airline industries, as the stock market has recovered considerably since
years ago, for all sectors except for pipelines. Overall, the results above
show that the oil and gas industry is profitable in each of its sectors.
The largest firms are the integrated oil and gas producers where there is
the bulk of the market cap.
2. All of the sectors in the industry value chain are very capital intensive – it
requires a lot of investment to enter and stay in the business. This is
particularly true for the integrated firms, and for those in the pipeline and
Chapter 2 – Implementing Strategy: The Value Chain, the Balanced Scorecard, and the Strategy Map
2-45
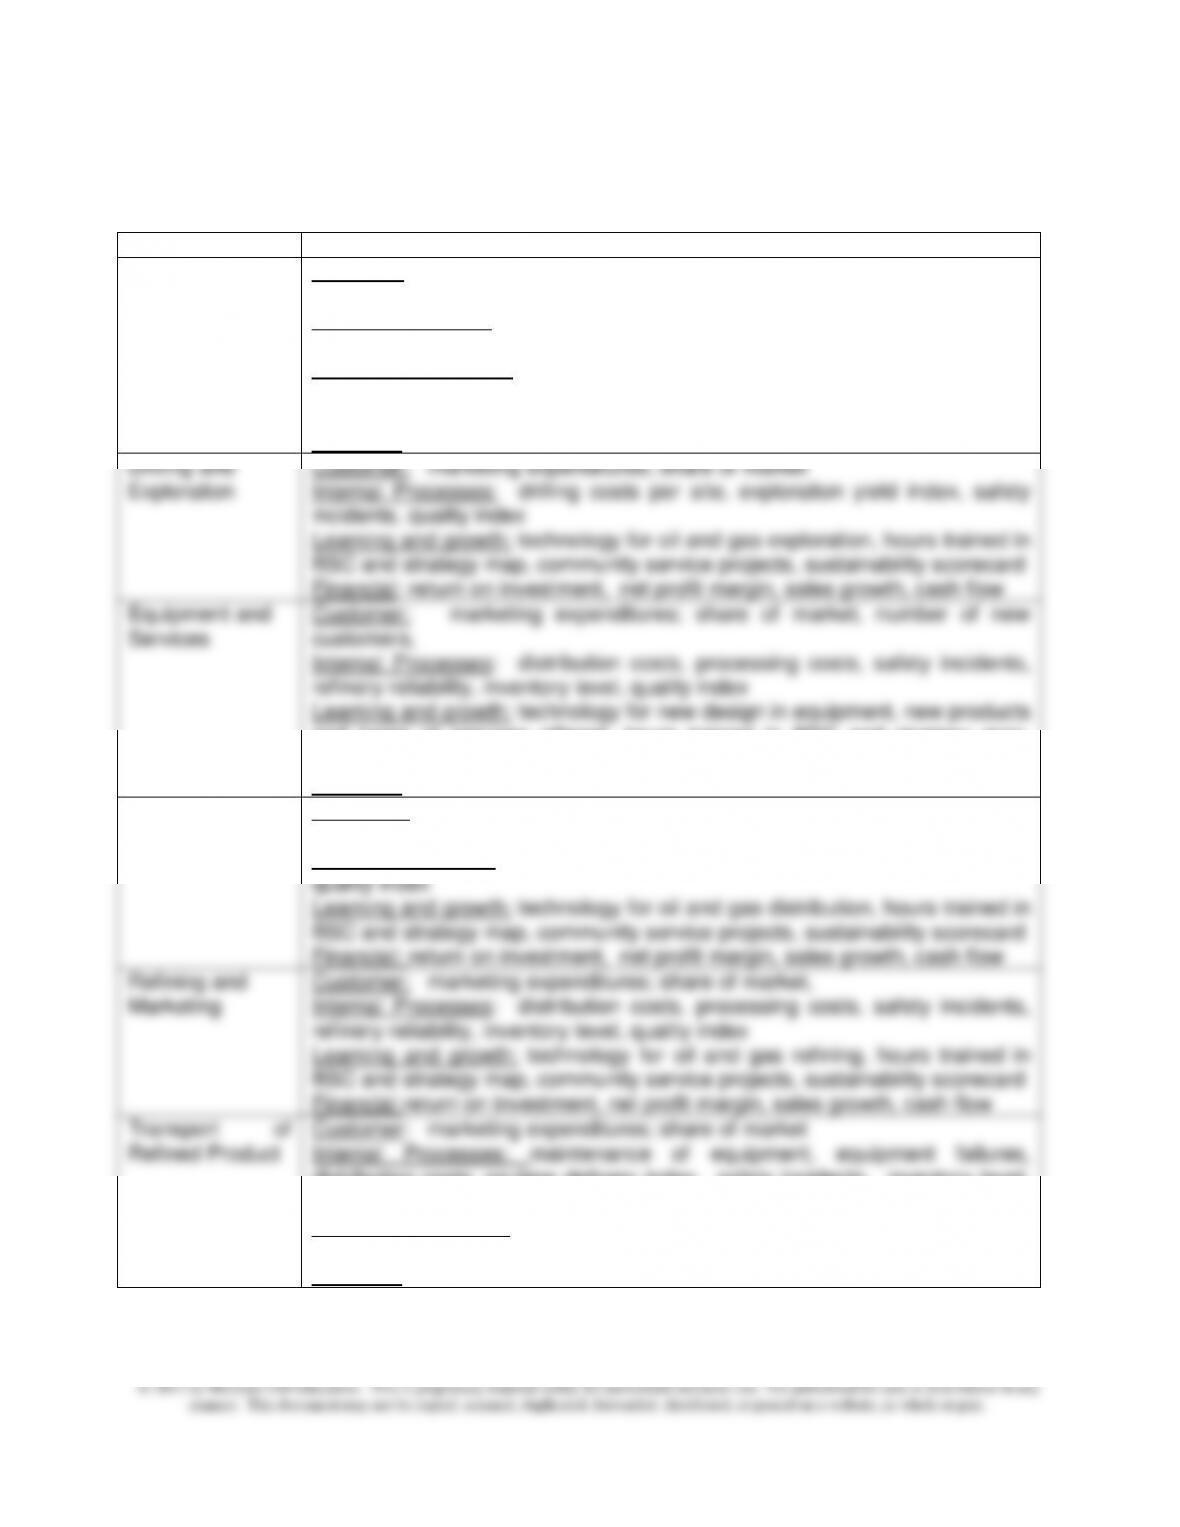
2-51 (continued -1)
Critical Success Factors
Integrated Oil
and Gas
Customer: marketing expenditures; share of market, customer mix and
profitability
Internal Processes: distribution costs, processing costs, safety incidents,
refinery reliability, inventory level, quality index
Learning and growth: technology for oil and gas exploration, refining and
distribution, hours trained in BSC and strategy map, community service
projects, sustainability scorecard
Financial: return on investment, net profit margin, sales growth, cash flow
Drilling and
Exploration
Customer: marketing expenditures; share of market
Internal Processes: drilling costs per site, exploration yield index, safety
incidents, quality index
Learning and growth: technology for oil and gas exploration, hours trained in
BSC and strategy map, community service projects, sustainability scorecard
Financial: return on investment, net profit margin, sales growth, cash flow
Equipment and
Services
Customer: marketing expenditures; share of market, number of new
customers,
Internal Processes: distribution costs, processing costs, safety incidents,
refinery reliability, inventory level, quality index
Learning and growth: technology for new design in equipment, new products
and types of services offered, hours trained in BSC and strategy map,
community service projects, sustainability scorecard
Financial: return on investment, net profit margin, sales growth, cash flow
Pipelines
Customer: marketing expenditures; share of market, pipeline interruption
incidents
Internal Processes: distribution costs, maintenance costs, safety incidents,
quality index
Learning and growth: technology for oil and gas distribution, hours trained in
BSC and strategy map, community service projects, sustainability scorecard
Financial: return on investment, net profit margin, sales growth, cash flow
Refining and
Marketing
Customer: marketing expenditures; share of market,
Internal Processes: distribution costs, processing costs, safety incidents,
refinery reliability, inventory level, quality index
Learning and growth: technology for oil and gas refining, hours trained in
BSC and strategy map, community service projects, sustainability scorecard
Financial return on investment, net profit margin, sales growth, cash flow
Transport of
Refined Product
Customer: marketing expenditures; share of market
Internal Processes: maintenance of equipment, equipment failures,
distribution costs, on-time delivery index, safety incidents, inventory level,
quality index
Learning and growth: hours trained in BSC and strategy map, community
service projects, sustainability scorecard
Financial: net profit margin, sales growth, cash flow