Unlock document.
This document is partially blurred.
Unlock all pages and 1 million more documents.
Get Access
Chapter 19 - Strategic Performance Measurement: Investment Centers
19-1
CHAPTER 19: STRATEGIC PERFORMANCE MEASUREMENT:
INVESTMENT CENTERS
QUESTIONS
19-1 Investment centers are commonly used when there are a number of business
units to be compared, and/or when top management intends to evaluate the
economic performance of the business unit relative to alternative investments. By
definition, managers of these business units exercise control over revenues,
19-2 Return on investment (ROI) is the ratio of some measure of “profit” to some
measure of “invested capital” for the business unit.
19-3 The primary measurement issues for ROI are:
1. The effect of accounting policies, which affect the determination of “income.”
2. Other measurement issues for income, which include the handling of non-
recurring items in the income statement, differences in the effect of income
19-4 The primary advantages of using return on investment (ROI) as a performance
indicator are:
The primary limitations of return on investment (ROI) as a performance indicator
are:
1. It has an excessive short-term focus.
Chapter 19 - Strategic Performance Measurement: Investment Centers
19-2
19-5 We can enhance the ROI measure’s usefulness by making it the product of two
ratios:
ROI = (Profit ÷ Sales) × (Sales ÷ Assets)
ROI = ROS × AT
Return on sales (ROS) is the firm’s profit per sales dollar and it measures the unit
manager’s ability to control expenses and increase revenues to improve
increased sales from a given level of investment in assets. Together, the two
components of ROI tell a more complete story of the manager’s performance and
enhance top management’s ability to evaluate and compare the different units.
19-6 The key advantage of residual income (RI) is that it deals effectively with the
limitation of ROI: ROI has a disincentive for the managers of the most profitable
units to make new investments. With residual income, no matter how profitable
the unit, there is still an incentive for new profitable investment. In contrast, a key
limitation is that since RI is not a percentage, it suffers the same problem of using
19-7 Economic value added (EVA®) is a profitability measure that approximates the
“economic earnings” of an investment center. Operationally, we define EVA® as
business unit’s income after-tax cash earnings and after deducting an imputed
charge of the level of invested capital in the business unit. On the surface, RI and
EVA® look confusingly similar. There is a major difference, however. Residual
income (RI) is calculated entirely using reported accounting data, for income and
Chapter 19 - Strategic Performance Measurement: Investment Centers
19-3
the value added to (or destroyed by) each strategic investment unit during a
given period. As such, EVA® is one approach to what we call “Value-Based
Management.”
19-8 The three most widely accepted methods are: (1) the comparable uncontrolled
price method, (2) the resale price method, and (3) the cost-plus method. The
comparable controlled price method establishes an arm’s length price by using
the sales prices of similar products made by unrelated firms. The resale price
method is based on determining an appropriate markup, where the markup is
19-9 The “arm’s-length” standard says that transfer prices should be set so they reflect
the price that would have been set by unrelated parties acting independently. It is
19-10 Expropriation happens when a foreign government takes ownership and control
of assets the domestic investor has invested in that country. When there is a
significant risk of expropriation, the domestic firm can take appropriate actions
Chapter 19 - Strategic Performance Measurement: Investment Centers
19-4
BRIEF EXERCISES
19-11 ROI = Return on Sales × Asset Turnover
19-12 ROI = (Profit ÷ Sales) × (Sales ÷ Assets)
19-13
Return on Sales (ROS) = Profit ÷ Sales
= $100,000 ÷ $500,000
= 20%
Asset Turnover (AT) = Sales ÷ Assets
Chapter 19 - Strategic Performance Measurement: Investment Centers
19-5
19-14
NBV ROI = Profit ÷ NBV of Assets
=$2,000,000 ÷ $10,000,000
= 20%
GBV ROI = Profit ÷ GBV of Assets
19-15 Residual Income (RI) = Income − (Required Rate of Return × NBV of average
assets)
19-16 Residual Income (RI) = Income – (Required Rate of Return × NBV of average
assets)
$100,000 = Income – (10% × $500,000)
19-17 ROI = Return on sales (ROS) × Asset Turnover (AT)
19-18 Mattress Sets:
ROI = (Profit ÷ Sales) × (Sales ÷ Assets)
10% = (Profit ÷ $50,000) × 5.0
Chapter 19 - Strategic Performance Measurement: Investment Centers
19-6
Bed Frames:
ROI = (Profit ÷ Sales) × (Sales ÷ Assets)
19-19 Return on Sales (ROS) = ($1,000 + $1,250) ÷ ($50,000 + $25,000)
19-20 Residual Income (RI) = Income – (Required rate of return × NBV of assets)
Chapter 19 - Strategic Performance Measurement: Investment Centers
19-7
EXERCISES
19-21 Return on Investment (ROI); Comparison of Three Investment
Centers (Divisions) (15 minutes)
Answers shown in bold:
X Y Z
Sales $1,500,000 $ 750,000 $3,750,000
Income $150,000 $75,000 $18,750
Investment (assets) $600,000 $7,500,000 $2,500,000
Chapter 19 - Strategic Performance Measurement: Investment Centers
19-8
19-22 ROI; Different Measures for Total Assets (20-25 minutes)
Chapter 19 - Strategic Performance Measurement: Investment Centers
19-9
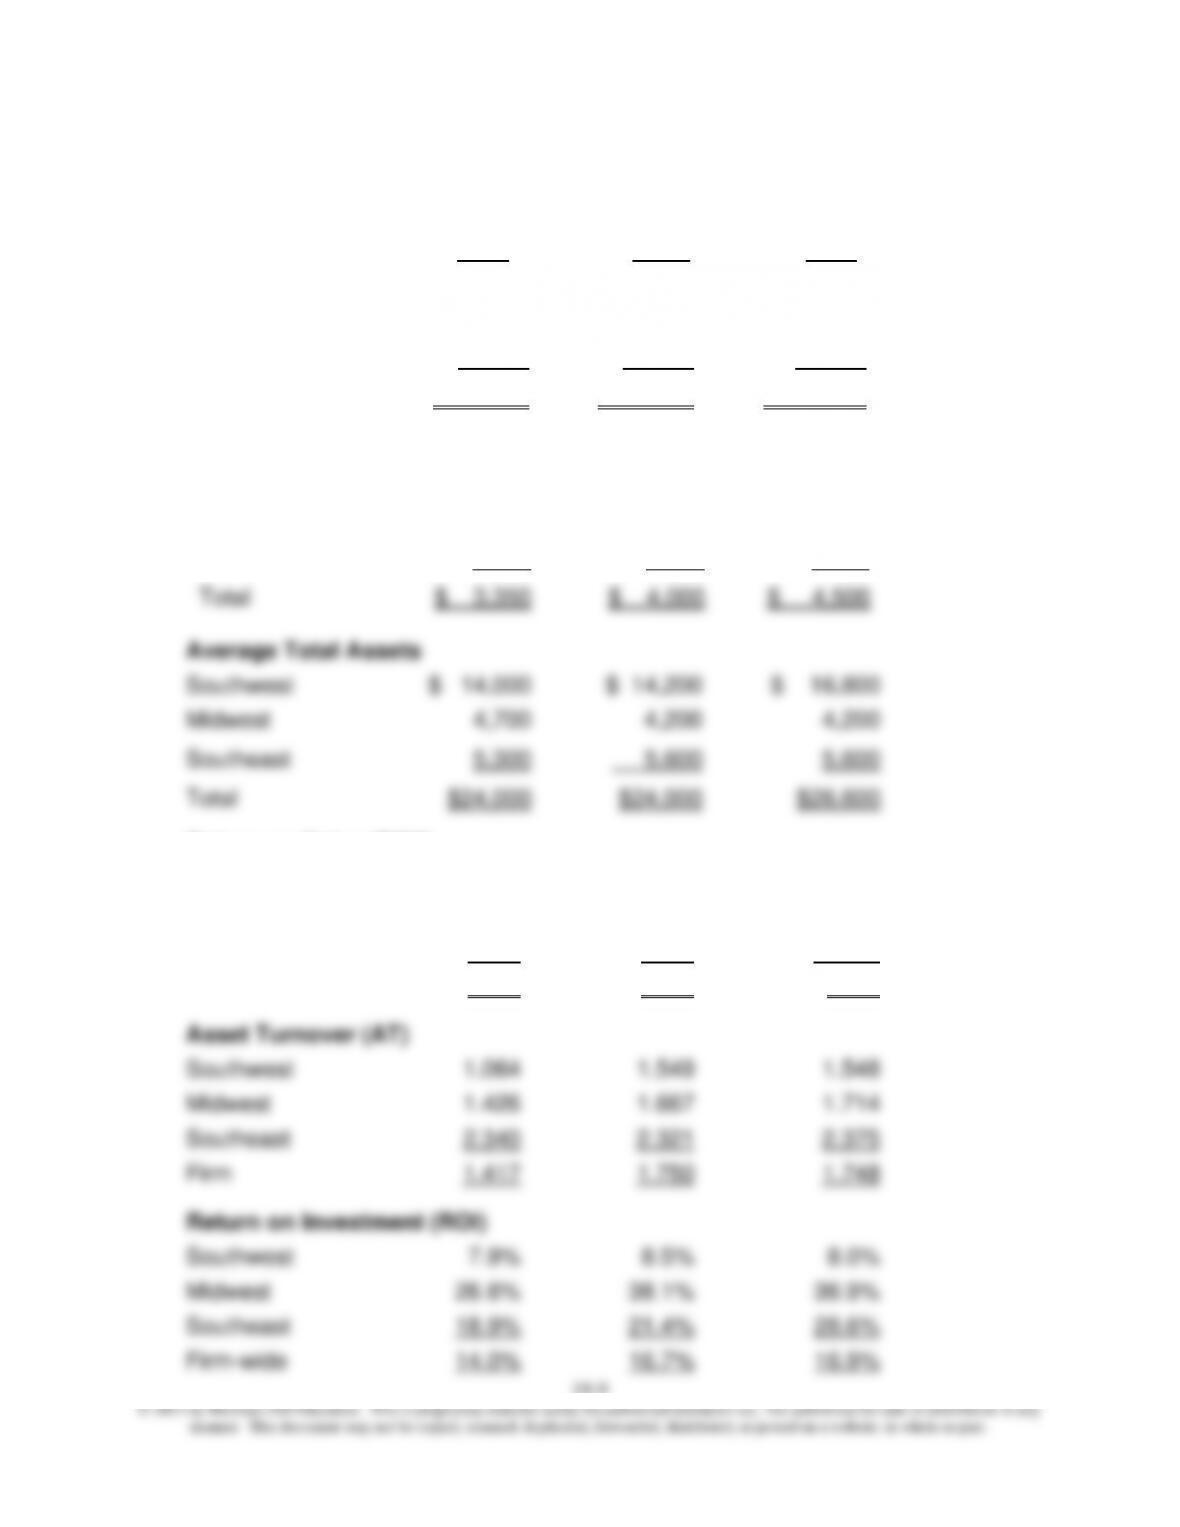
19-23 ROI; Return on Sales (ROS) and Asset Turnover (20-25 minutes)
Revenue
2013
2014 2015
Southwest
$ 14,900
$ 22,000
$ 26,000
Midwest
6,700
7,000
7,200
Southeast
12,400
13,000
13,300
Total
$ 34,000
$ 42,000
$ 46,500
Net Operating Income
Southwest
$ 1,100
$ 1,200
$ 1,350
Midwest
1,250
1,600
1,550
Southeast
1,000
1,200
1,600
Total
$ 3,350
$ 4,000
$ 4,500
Average Total Assets
Southwest
$ 14,000
$ 14,200
$ 16,800
Midwest
4,700
4,200
4,200
Southeast
5,300
5,600
5,600
Total
$24,000
$24,000
$26,600
Return on Sales (ROS)
Southwest
7.4%
5.5%
5.4%
Midwest
18.7%
20.8%
22.1%
Southeast
8.1%
9.4%
12.0%
Firm
9.9%
9.5%
9.7%
Asset Turnover (AT)
Southwest
1.064
1.549
1.548
Midwest
1.426
1.667
1.714
Southeast
2.340
2.321
2.375
Firm
1.417
1.750
1.748
Return on Investment (ROI)
Southwest
7.9%
8.5%
8.0%
Midwest
26.6%
38.1%
36.9%
Southeast
18.9%
21.4%
28.6%
Firm-wide
14.0%
16.7%
16.9%
Chapter 19 - Strategic Performance Measurement: Investment Centers
19-10
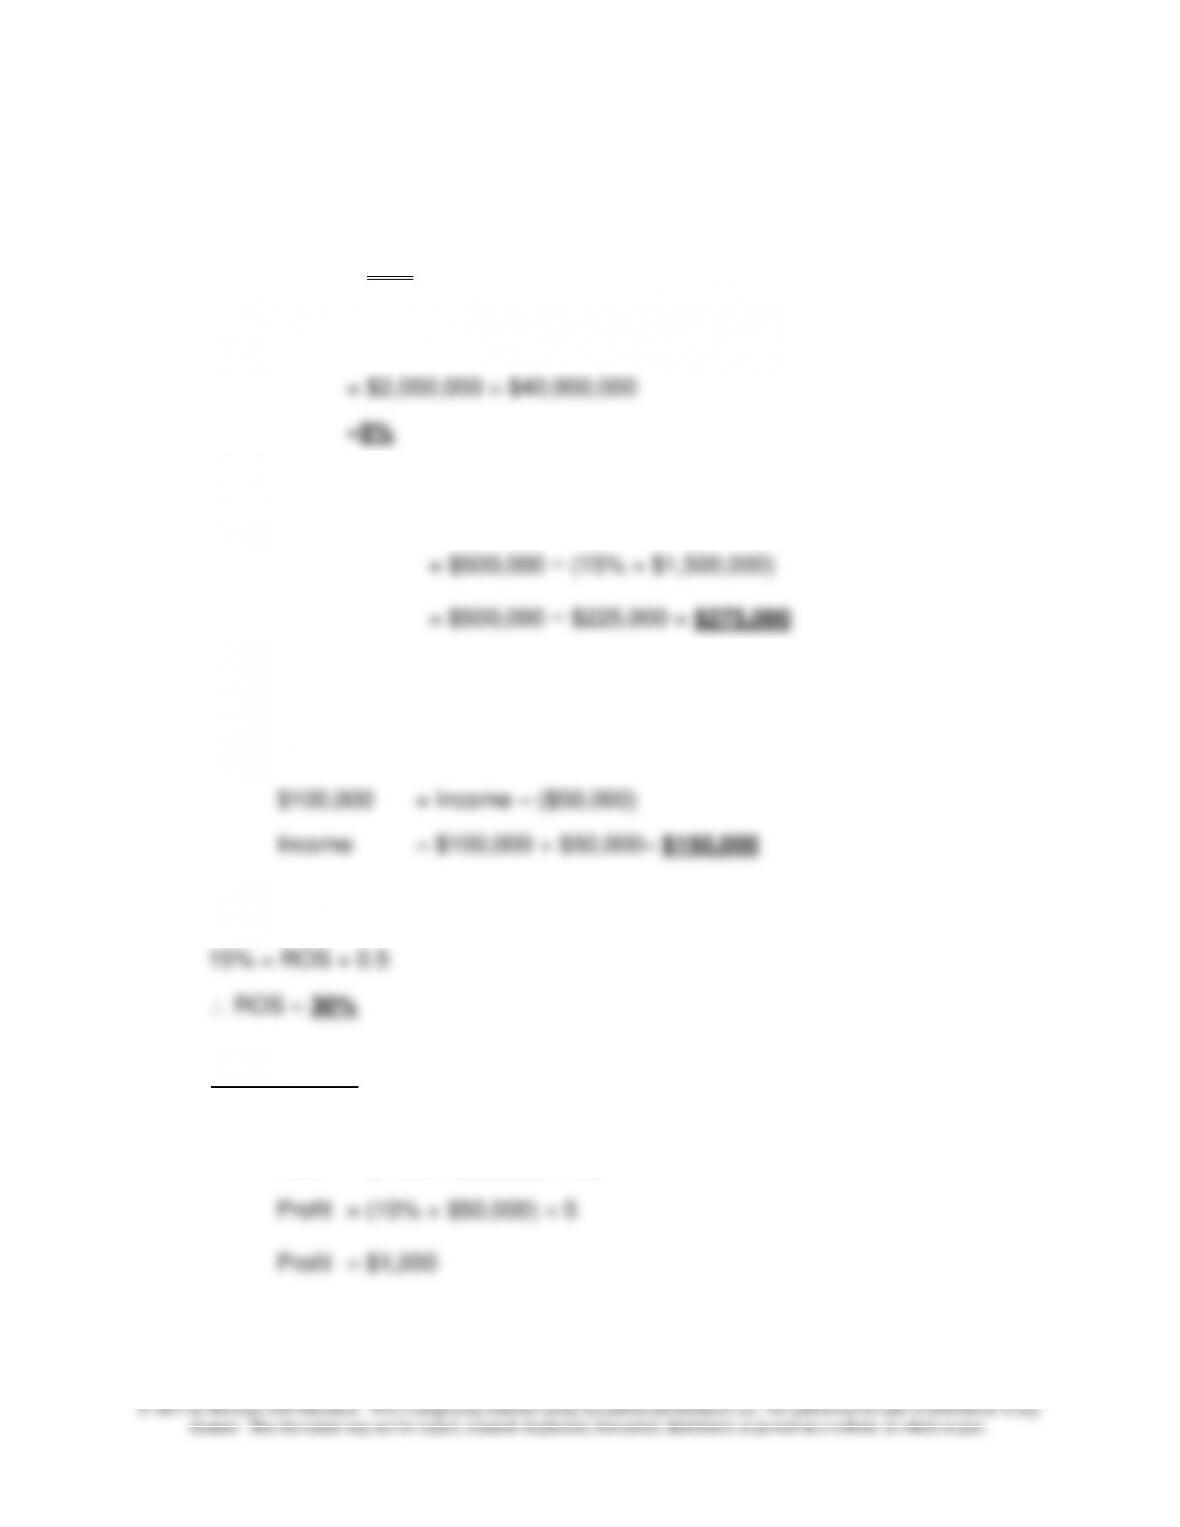
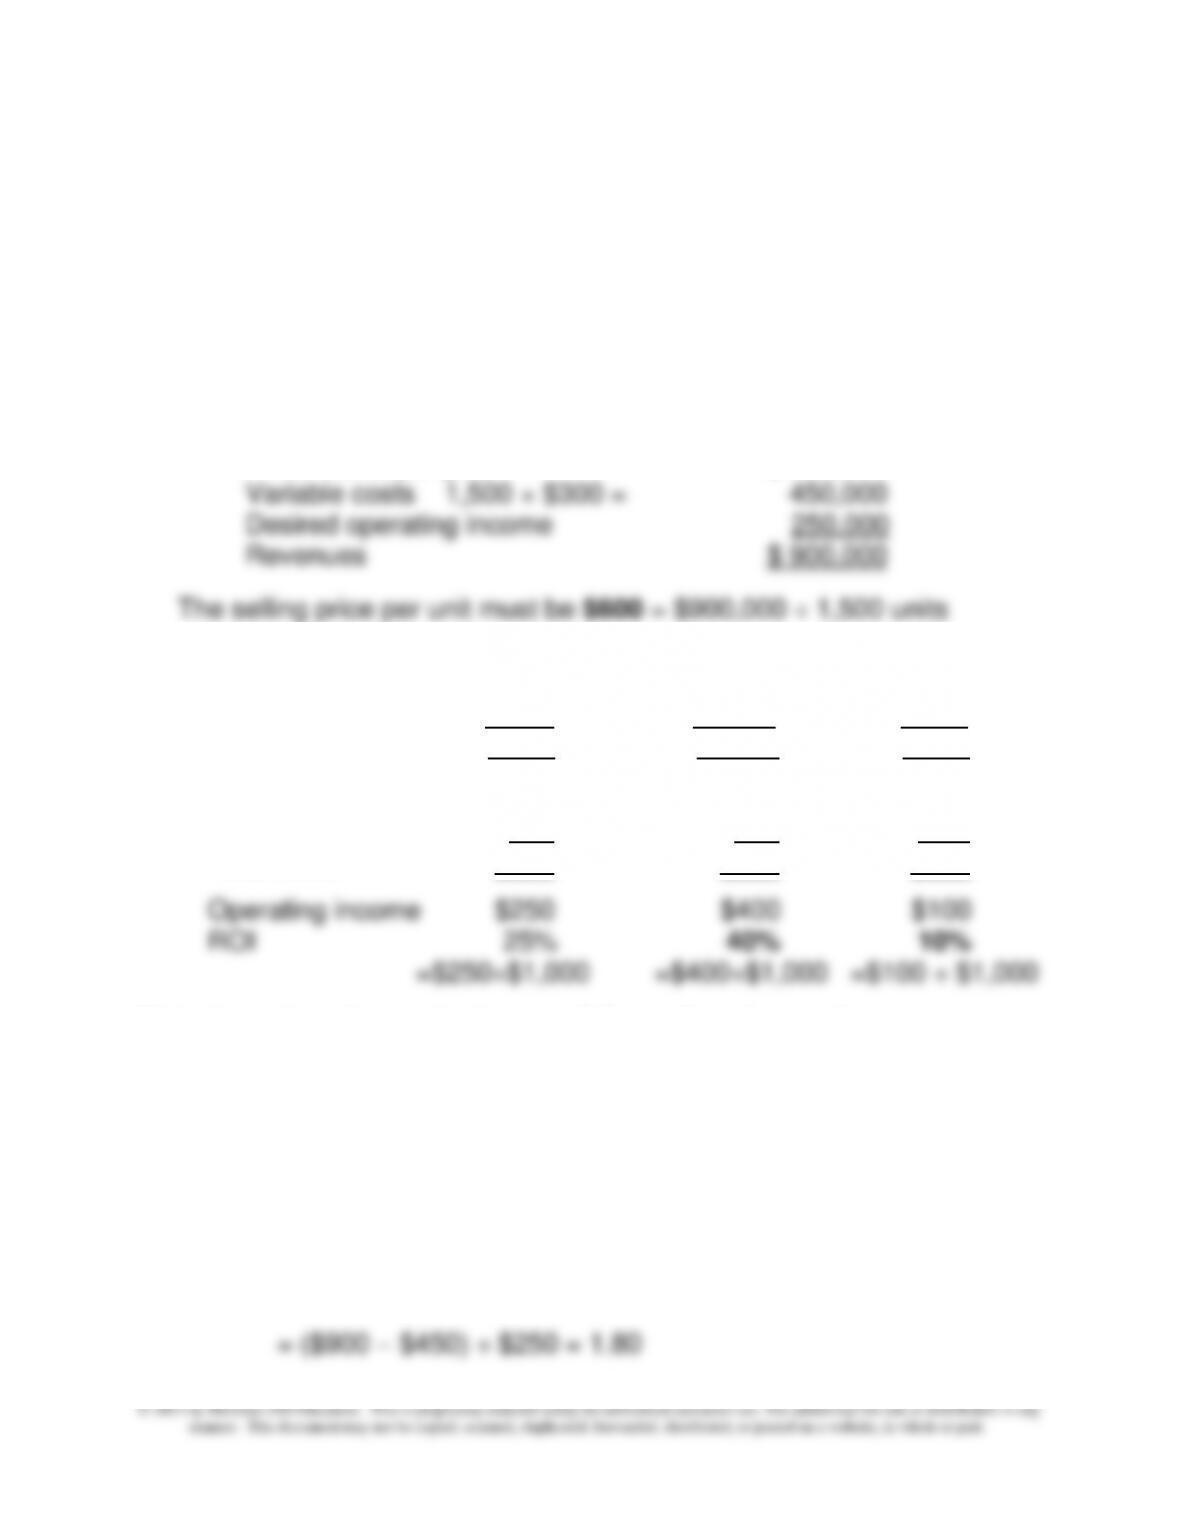
19-24 Target Sales Price; Return on Investment (ROI) (20-30 minutes)
1. Return on Investment = Operating Income ÷ Investment (avg. total
assets)
25% = X ÷ $1,000,000
Target Operating Income = $250,000
Target revenues, calculated as follows:
Fixed costs, per year $ 200,000
2. Data are in thousands:
Units 1,500 2,000 1,000
Revenues ($600/unit) $ 900 $1,200 $ 600
Variable costs $450 $600 $300
Fixed costs 200 200 200
Total costs $650 $800 $500
Note how the change in income follows the change in revenues, as
predicted by operating leverage, which is defined and explained in Chapter
9. Degree of operating leverage (DOL) multiplied times the percentage
change in sales gives the percentage change in operating income. Thus,
the greater the DOL, the larger the effect on income and ROI of a given
percentage change in sales. This exercise provides an opportunity to
review the relationship between volume and profit, as covered in Chapter 9.
See the illustration below:
DOL = contribution margin ÷ operating income
Chapter 19 - Strategic Performance Measurement: Investment Centers
19-11
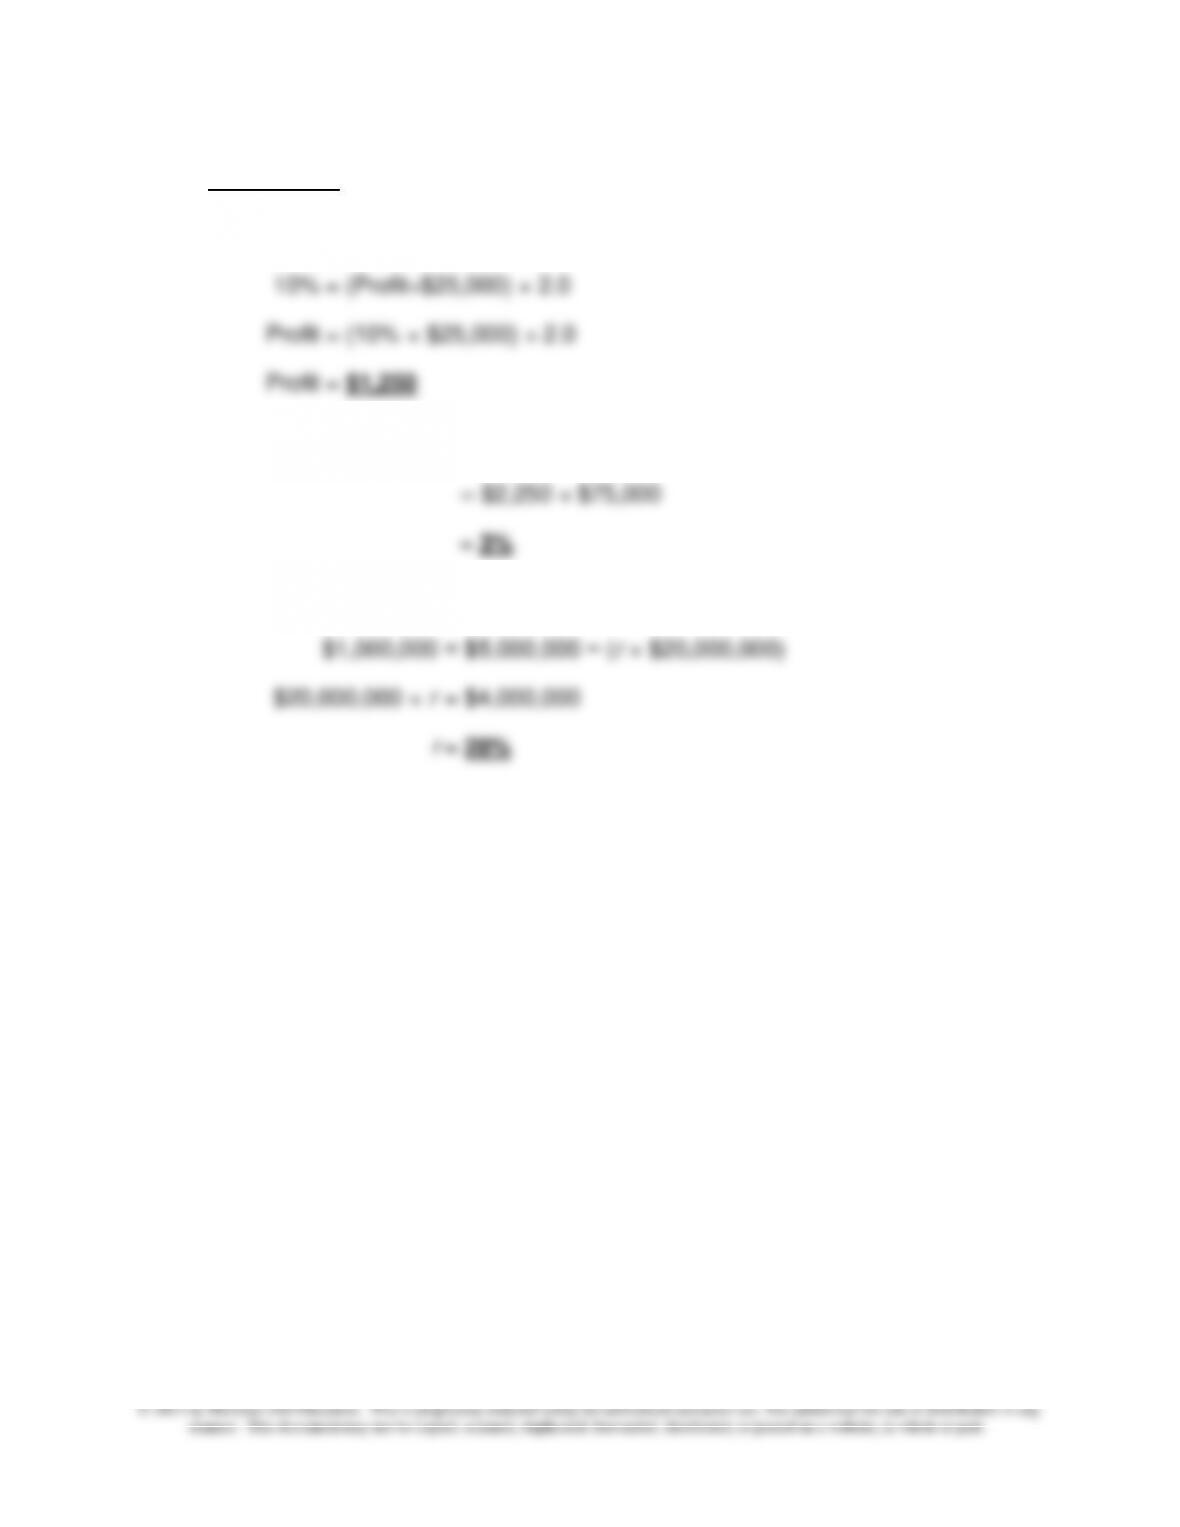
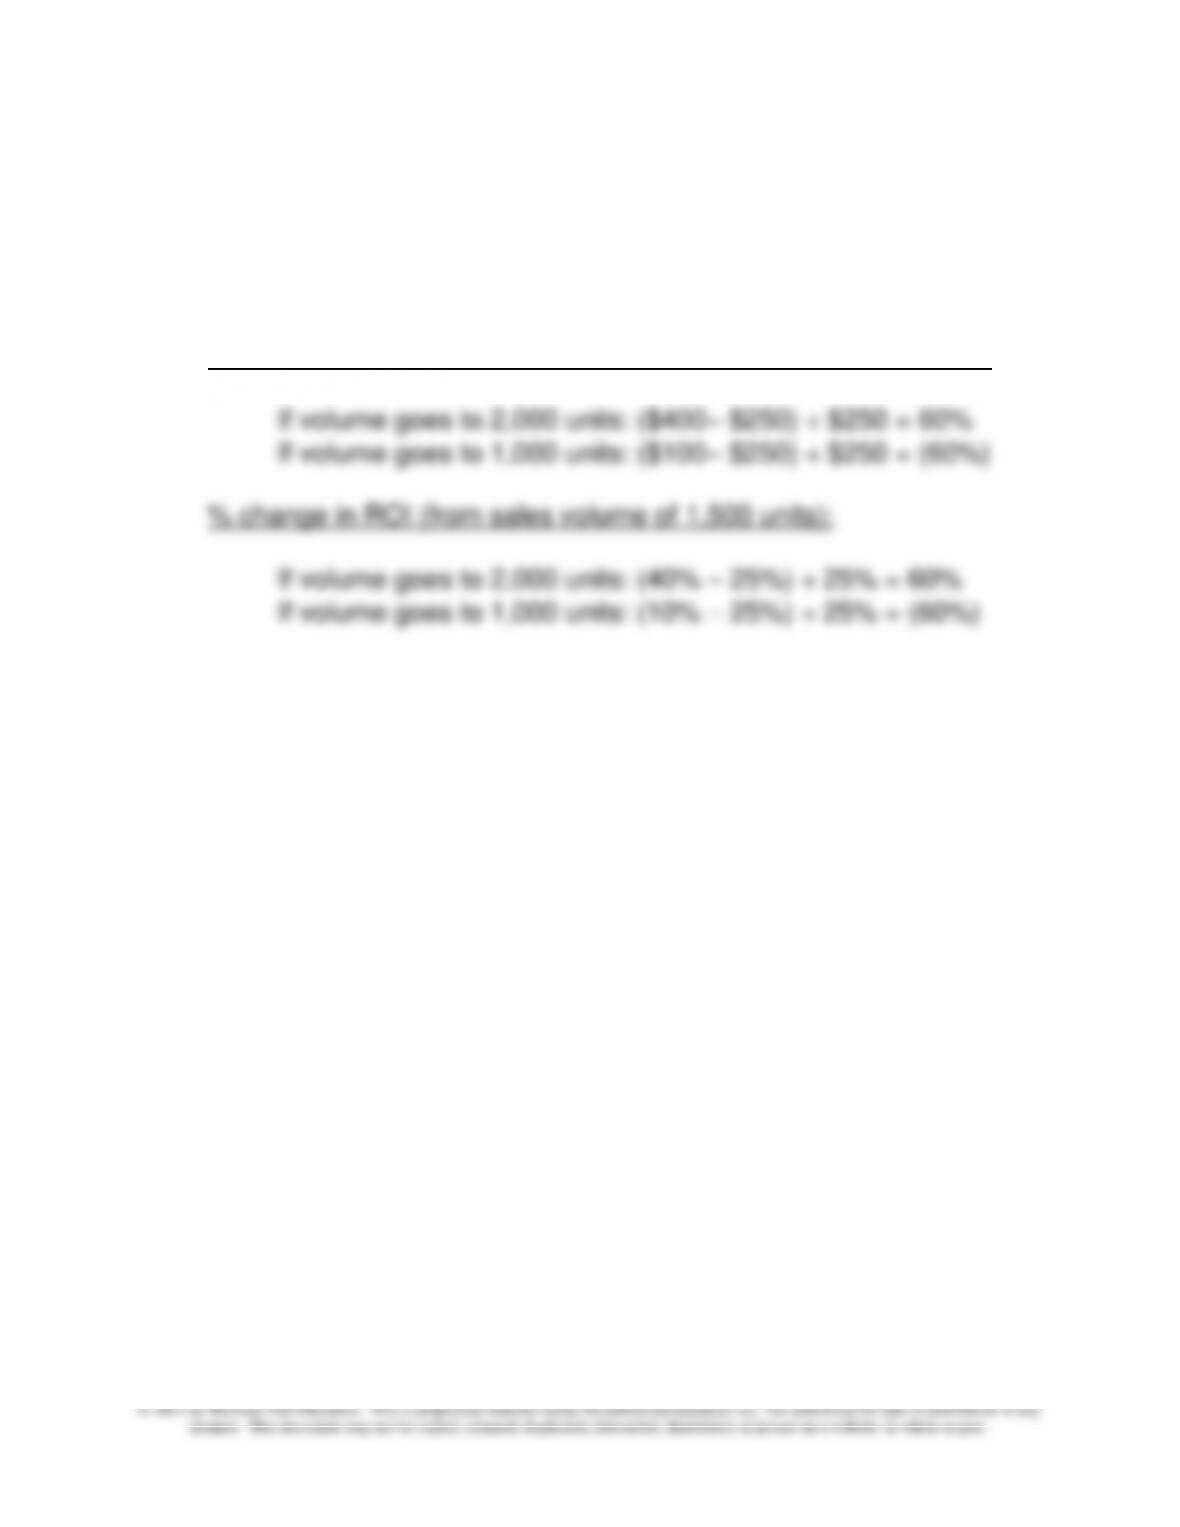
19-24 (continued)
% change in operating income = DOL × % change in revenues
= 1.80 × 33.3333% = 60%
% change in operating income (from sales volume of 1,500 units):
Also:
25% ROI × (1 + 0.60) = 40% ROI
And
25% ROI × (1 − 0.60) = 10% ROI
Chapter 19 - Strategic Performance Measurement: Investment Centers
19-12
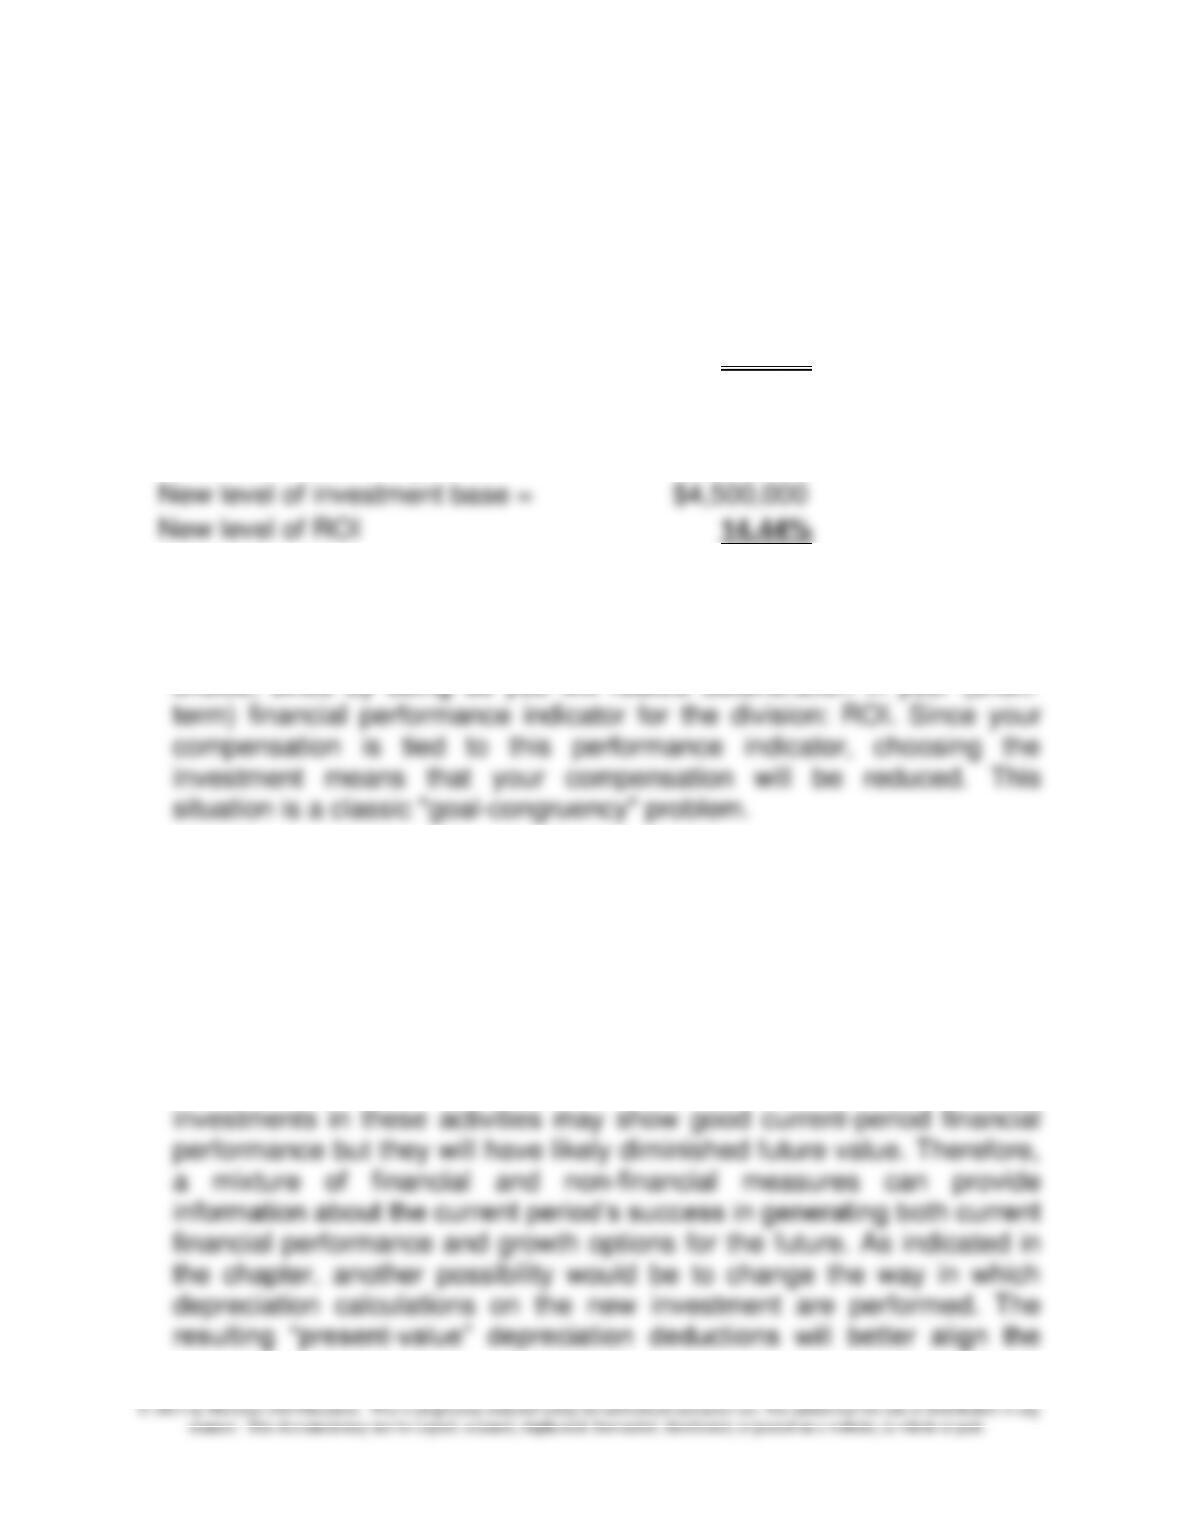
19-25 ROI, Goal-Congruency Issues (30 Minutes)
1. Current ROI of the Division:
Current level of operating income =
$600,000
Current level of investment base =
$4,000,000
Current level of ROI =
15.00%
2. ROI after new investment:
New level of operating income =
$650,000
New level of investment base =
$4,500,000
New level of ROI
14.44%
3. Probably not. While the proposed project may, in an economic sense,
benefit the company as a whole (i.e., it adds to shareholder wealth),
there is little incentive for you (as divisional manager) to make this
choice, since by doing so you will realize deterioration in your (short-
4. A variety of changes are possible. For example, the manager could
receive a flat bonus upon achieving a target ROI or target residual
income (RI). Another alternative is to base the manager’s compensation
on a combination of financial and nonfinancial measures. Current-period
actions that decrease the current period’s financial performance may be
creating future value. Such actions include investments in research and
development, employee training, new distribution channels, and
customer service. Conversely, companies that decrease their
Chapter 19 - Strategic Performance Measurement: Investment Centers
19-13
investment decision model with the model used subsequently to
evaluate financial performance. Finally, as also discussed in the text, for
19-25 (Continued)
19-26 Return on Investment (ROI) and Residual Income (RI) (20 minutes)
1. A quick inspection of the data shows mortgage loans with a higher ROI
to be more successful. But see 2, below.
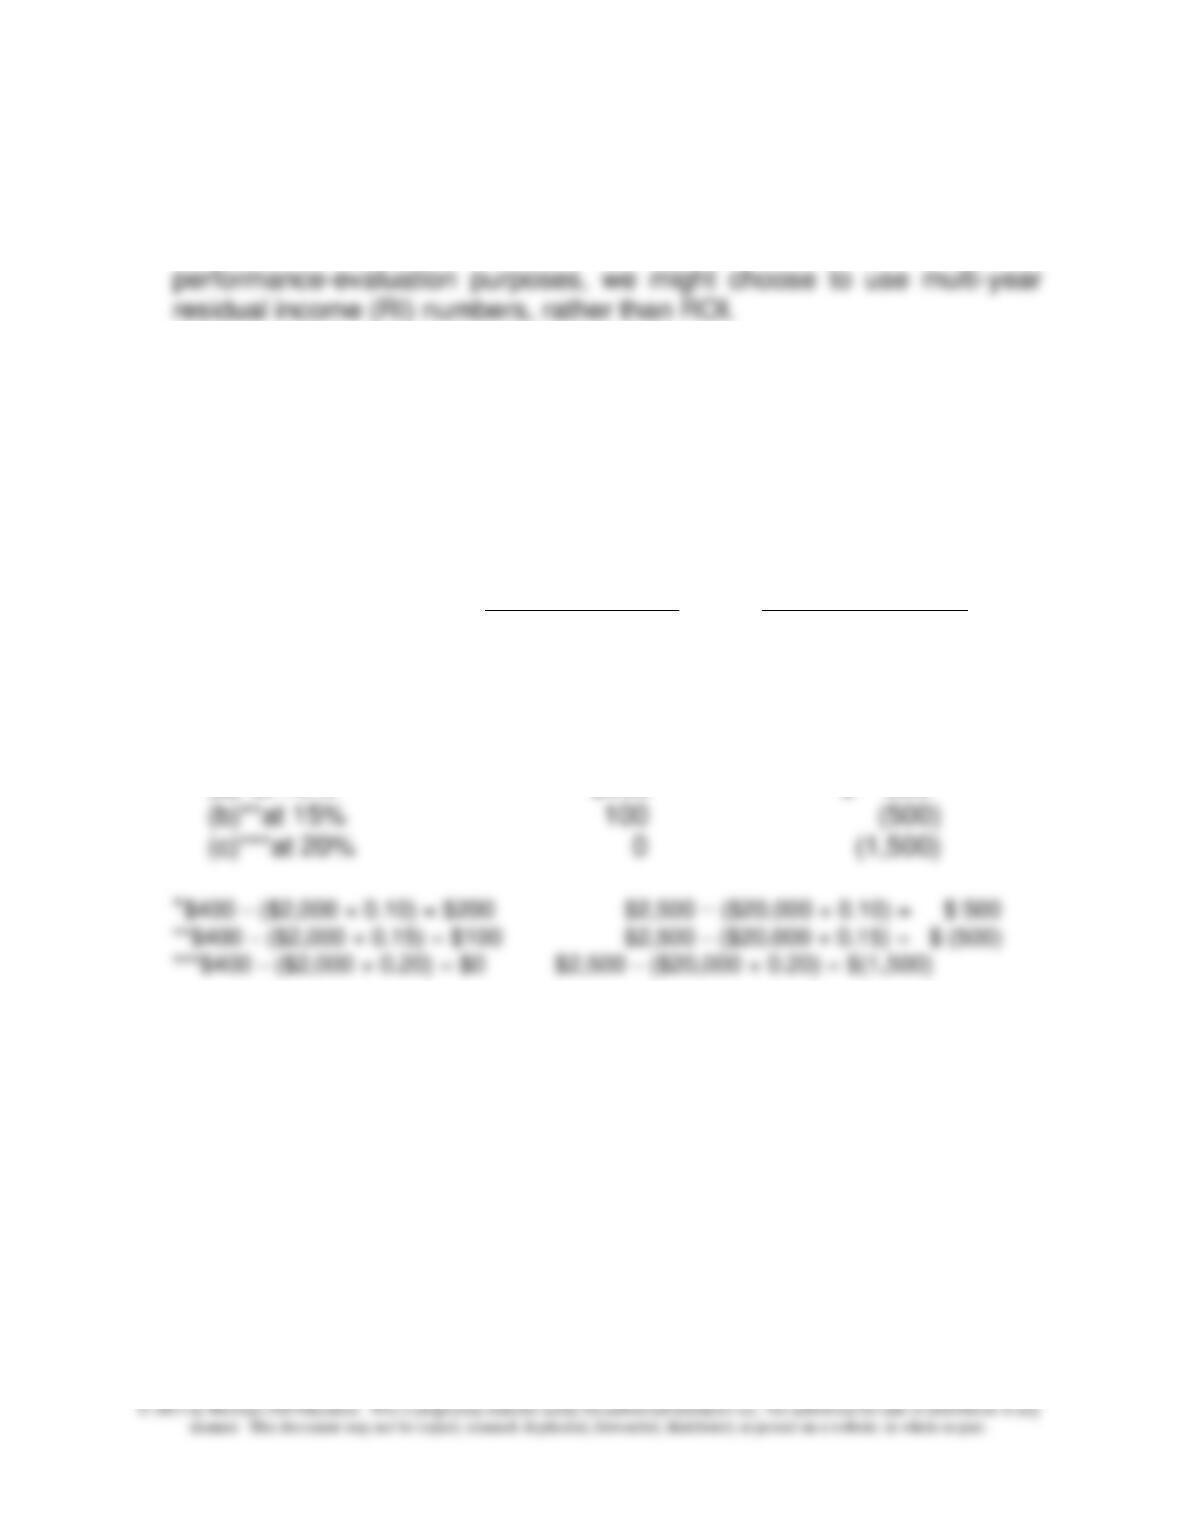
2. Mortgage Loans Consumer Loans
Average Total Assets $ 2,000 $20,000
Operating Income 400 2,500
Return on Investment (ROI) 20% 12.5%
Residual Income (RI):
(a)*at 10% $200 $ 500
There is no simple answer to which is more successful in terms of
residual income (RI). Consumer Loans is more successful at low rates,
while Mortgage Loans is more successful at high rates. This reflects an
important limitation of RI: larger divisions (Consumer Loans in this case)
are favored when the desired return used to determine RI is relatively
low.

Chapter 19 - Strategic Performance Measurement: Investment Centers
19-14
19-27 ROI, Residual Income (RI), and EVA® (20-30 minutes)
1, 2, and 3:
Intangibles’
Operating
Average
Value of NBV Plus
Effect on
Region
Income
Total Assets
Intangibles Intangibles
Net Income
Soap Products
$3,250,000
$60,000,000
$1,500,000
$61,500,000
$1,000,000
Skin Lotions
2,750,000
33,000,000
8,000,000
41,000,000
6,000,000
Hair Products
5,000,000
55,000,000
1,000,000
56,000,000
700,000
Desired Rate of Return
5.00%
Cost of Capital
4.00%
RETURN ON INVESTMENT (ROI)
Soap Products
5.42%
= $3,250,000 ÷ $60,000,000
Skin Lotions
8.33%
= $2,750,000 ÷ $33,000,000
Hair Products
9.09%
= $5,000,000 ÷ $55,000,000
RESIDUAL INCOME (RI)
Soap Products
$ 250,000
=$3,250,000 – (0.05 × $60,000,000)
Skin Lotions
$1,100,000
=$2,750,000 – (0.05 × $33,000,000)
Hair Products
$2,250,000
=$5,000,000 – (0.05 × $55,000,000)
EVA®
Soap Products
$1,790,000
=$3,250,000 + $1,000,000 – (0.04 × $61,500,000)
Skin Lotions
$7,110,000
=$2,750,000 + $6,000,000 – (0.04 × $41,000,000)
Hair Products
$3,460,000
=$5,000,000 + $ 700,000 – (0.04 × $56,000,000)
The three methods produce somewhat different results. Under ROI, the
skin lotion and hair products divisions have similar performance. Under
residual income (RI) the hair products division becomes the most profitable,
in part because it is the largest division. Using EVA®, the skin lotion
division is the most profitable. Note that the skin lotions division has the
largest amount of intangible assets, and for this reason has the highest
performance under EVA®.
Chapter 19 - Strategic Performance Measurement: Investment Centers
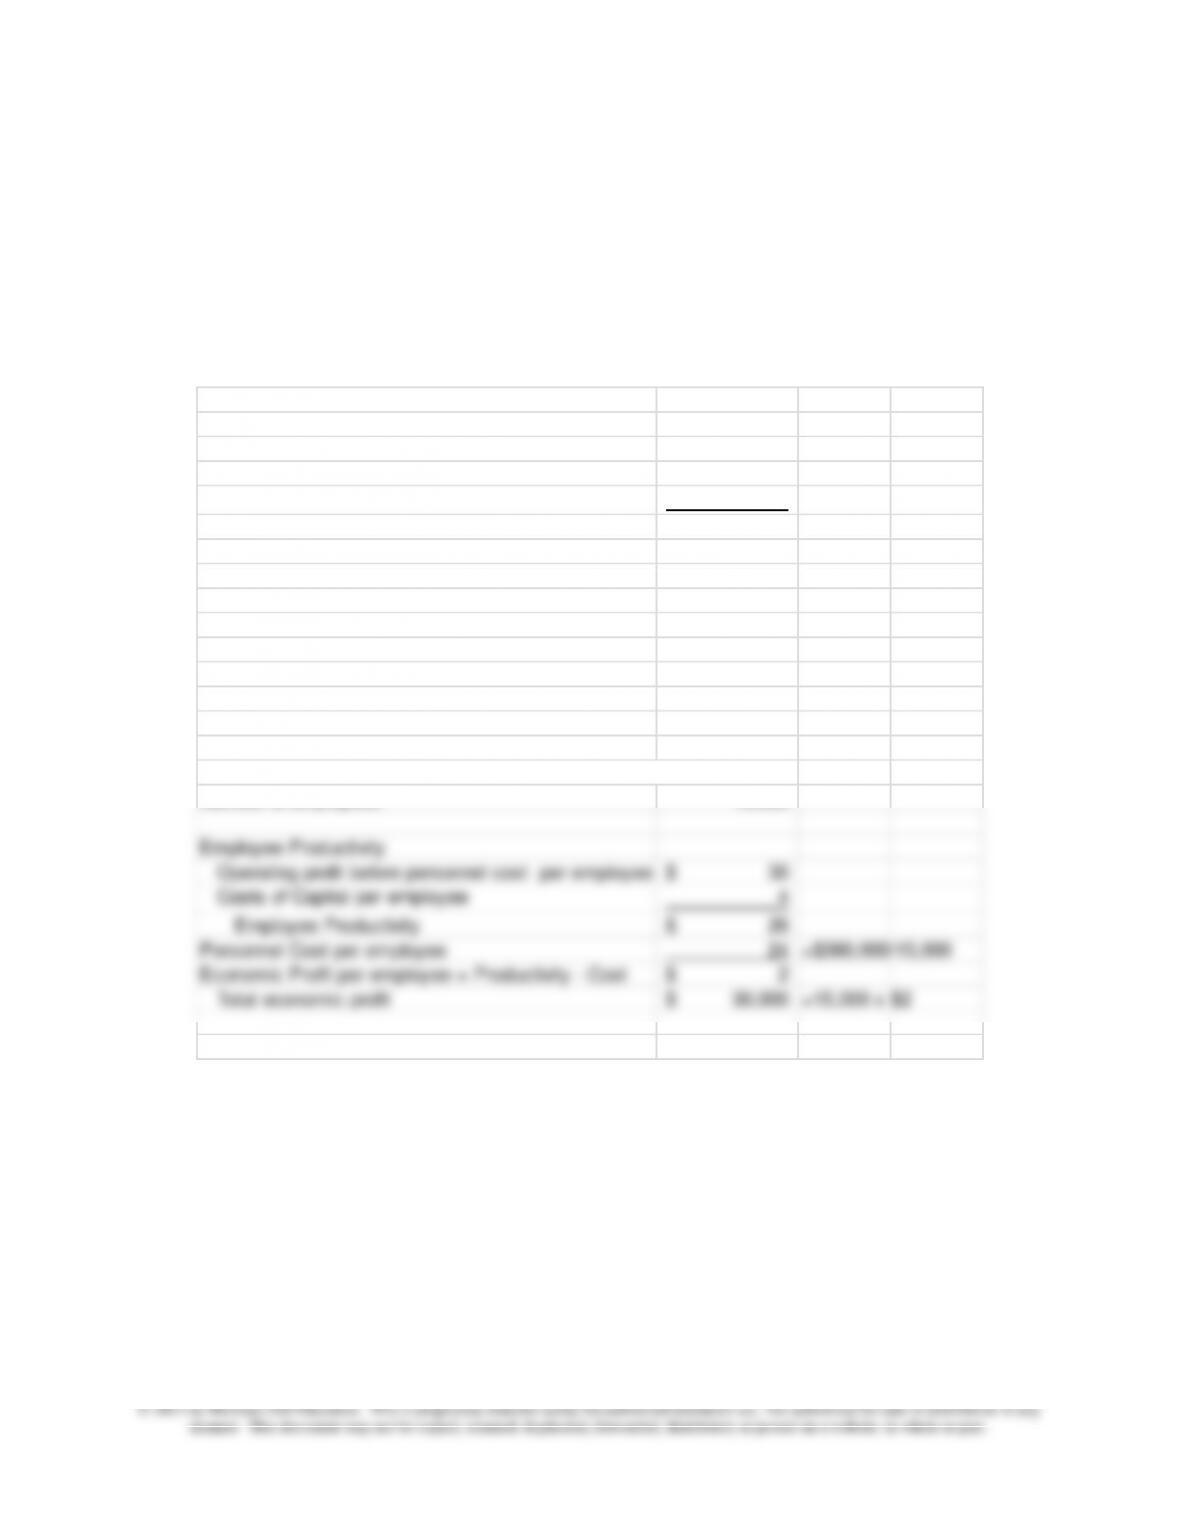
19-28 Economic Profit and Employee Productivity; Service Industries (25-
30 minutes)
Productivity is $26,000 per employee, and the cost per employee is
$24,000. The economic profit per employee is therefore $2,000, or a total
of $30 million.
Part 1: Economic Profit
Revenue 600,000$
Operating Costs
Personnel Costs 360,000
Other Costs 150,000
Operating Profit 90,000$
Operating Profit before Personnel Costs 450,000$
Investment 1,000,000$
Cost of Capital,rate 0.06
Cost of Capital, amount 60,000$
Economic Profit = Operating profit - cost of capital 30,000$
Part 2: Economic Profit Calculated Using Employee Productivity
Number of employees 15,000
Employee Productivity
Operating profit before personnel cost per employee 30$
Costs of Capital per employee 4
Employee Productivity 26$
Personnel Cost per employee 24
=$360,000/15,000
Economic Profit per employee = Productivity - Cost 2$
Total economic profit 30,000$ =15,000 x $2
Revenue per employee 40$


