Unlock document.
This document is partially blurred.
Unlock all pages and 1 million more documents.
Get Access
Chapter 19 - Strategic Performance Measurement: Investment Centers
19-61
in terms of presenting an estimate of the amount of "capital"
employed during the period.
19-47 (Continued-2)
(2) LIFO Reserve: the entire amount of the LIFO reserve is added as an
adjustment. This adjustment brings the inventory amount from LIFO
to FIFO (i.e., current-cost) basis.
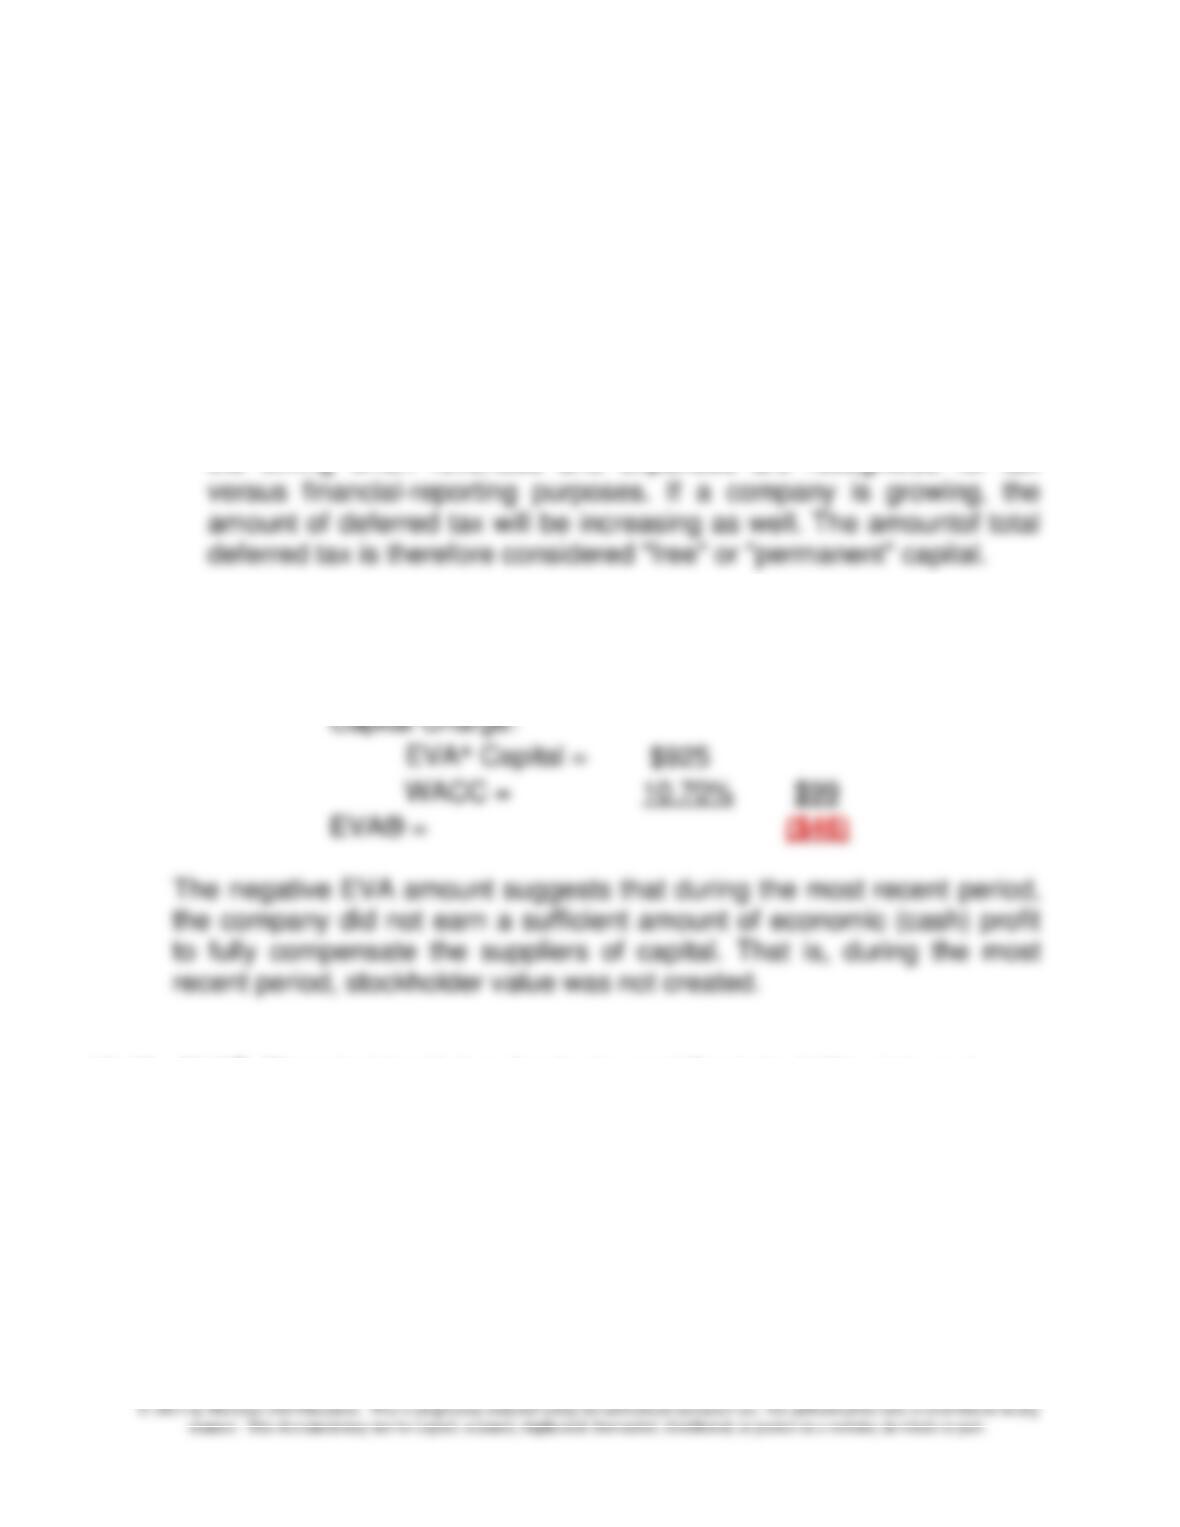
(3) Deferred Income Tax: deferred income tax arises from a difference in
the timing when revenues and expenses are recognized for tax
3. EVA®:
EVA® NOPAT =
$53
Capital Charge:
EVA® Capital =
$925
WACC =
10.70%
$99
EVA® =
($46)
The negative EVA amount suggests that during the most recent period,
the company did not earn a sufficient amount of economic (cash) profit
to fully compensate the suppliers of capital. That is, during the most
recent period, stockholder value was not created.
19-48 EVA®, Shareholder Value Analysis, and Sustainability; Internet-
Based Research (90 Minutes, including search time)
1. Economic Value Added (EVA®) is essentially a measure of economic
profit during a period. EVA® for a given period can be estimated as
follows:
EVA® = NOPAT – Imputed Charge for the Use of Capital (Assets)
During the Period

Chapter 19 - Strategic Performance Measurement: Investment Centers
19-62
= NOPAT – (k × Average Invested Capital)
= After-tax cash operating income, after depreciation – (k ×
Average Invested Capital)
= Revenues – Cash Operating Costs – Depreciation – Cash
Taxes on Operating Income
where: k = cost of capital (e.g., weighted-average cost of capital), and
Capital = Economic Capital = Cash Contributed by Suppliers of
Funds to the Business Unit (or firm as a whole)
Notice that relative to an accounting-based approach to income
determination (which is based on accrual concepts), EVA® is attempts
to measure economic profit for a period (i.e., the amount of value
added to the firm during a period). On the surface, the EVA® formula
looks similar to residual income (RI). However, RI relies on accounting-
based estimates of both income and capital, while EVA® is based on
economic concepts for these variables. Put another way, the EVA®
calculation begins with accounting-based measures, then adjusts
these to better approximate the amount of economic earnings (or,
value added) during a period.
2. The key here is to view the constituent parts of EVA® as a guide for
evaluating the contribution of sustainability-related initiatives (programs,
projects, etc.) to shareholder value, as follows:
EVA® = Shareholder Value Added = NOPAT – Capital Charge
19-48 (Continued-1)
Thus, shareholder value can be increased either by increasing NOPAT
or by decreasing the imputed capital charge. In turn, NOPAT can be
increased in essentially two ways, each of which provides a basis for
assessing the contribution of an investment project (such as a
sustainability initiative):

Chapter 19 - Strategic Performance Measurement: Investment Centers
19-63
• growth initiatives that increase revenues (e.g., product/process
The imputed capital charge is a function of both the amount of capital
employed and the cost of capital (risk, or discount rate). Thus, the
charge for capital employed can be reduced (thereby increasing EVA®,
everything else held constant) either through better/more efficient
utilization of assets (e.g., through process simplification or through
supply chain streaming) or by reducing the discount rate (investments in
social and/or environmental projects tend to reduce social and/or
political risk, thereby reducing the discount rate).
3. Student responses to this requirement will differ. In his book Making
Sustainability Work: Best Practices in Managing and Measuring
Corporate Social, Environmental, and Economic Impacts (San
Francisco, CA: Berrett-Koehler Publishers, Inc.), Marc Epstein offers (p.
141) the following two examples:
a. DuPont uses a metric called “shareholder value added per pound of
production” or SVA/lb. SVA is defined as “shareholder value created
above the cost of capital. A company increases SVA by adding
material, knowledge, or both. SVA/lb. emphasizes the addition of
knowledge, rather than material. DuPont has used this metric to
evaluate its business units and set goals to increase its SVA/lb.
based on those evaluations.
19-48 (Continued-2)
b. Georgia-Pacific used shareholder value analysis to align the
company’s goals of creating shareholder value and environmental
responsibility (critically important for a forest-products company).
The EH&S department at Georgia-Pacific, as well as individual
environmental projects, has been evaluated using shareholder value
analysis. Included in each environmental project evaluation is an
assessment of the project’s impact on revenues, operating costs (such
Chapter 19 - Strategic Performance Measurement: Investment Centers
19-64
as consulting fees, fines, and administrative costs), and capital costs.
Using shareholder analysis, Georgia-Pacific has been able to identify
environmental investments that create financial and stakeholder value
for the company.
4. The purpose of this question is to motivate students to think more
broadly (e.g., in terms of strategic performance measurement systems)
that could be used to support corporate sustainability initiatives. Implicit
in the discussion is the role of the management accountant in the design
of such systems.
Students will likely already have been exposed to the Balanced
Scorecard (BSC) as one example of a strategic management system
(or, a strategic performance measurement system). Thus, they might
metrics. Alternatively, students may recommend that a fifth performance
perspective/dimension be added to an organization’s BSC:
sustainability. This new dimension would include social and
environmental performance indicators that link with the other four
dimensions of the BSC. This alternative approach would highlight the
importance of social and environmental responsibility as a core
corporate objective.
In Making Sustainability Work: Best Practices in Managing and
Measuring Corporate Social, Environmental, and Economic Impacts
19-48 (Continued-3)
(San Francisco, CA: Berrett-Koehler Publishers, Inc.), Marc Epstein
suggests (p. 138) the following reasons why companies would choose to
establish a separate BSC perspective for sustainability:
1. Social and environmental responsibility is seen as a core to the
strategy of the organization, creating competitive advantage (through
factors such as corporate image, reputation, and product
Chapter 19 - Strategic Performance Measurement: Investment Centers
19-65
© 2013 by McGraw-Hill Education. This is proprietary material solely for authorized instructor use. Not authorized for sale or distribution in any
manner. This document may not be copied, scanned, duplicated, forwarded, distributed, or posted on a website, in whole or part.
differentiation), as opposed to being seen as a means to improve
operational efficiency.
2. The fifth perspective becomes a tool to focus the attention of
managers on social and environmental responsibility as a core
about these issues and objectives.
3. When a company has high-profile or high-impact social and
environmental issues, a fifth perspective on the BSC helps to highlight
4. When the resource allocation to social and environmental
responsibilities is relatively large, companies may want to highlight
the link between the use of those resources and company strategy.
In the course of their information search, students may have encountered
reference to the BSC that Nike developed to help identify the reason for
Chapter 19 - Strategic Performance Measurement: Investment Centers
19-66
19-49 General Transfer-Pricing Rule; Goal Congruence (30-40 Minutes)
1. Using the general guideline presented in the chapter, the minimum price
at which the Transmission Division (i.e., the producer) would sell
standard transmissions to the Auto Division (i.e., the buyer) is $900 per
unit, the incremental costs. The Transmission Division currently has idle
sense that it induces the correct decision from the standpoint of the
company as a whole.
2. Transferring products internally at incremental cost has the following
properties:
a. Achieves goal congruence? Yes, as described in requirement 1
above.
b. Useful for evaluating division performance? No, because this transfer
price does not cover or exceed full costs. By transferring at
Transmission Division has little incentive to control costs.
d. Preserves division autonomy? No. Because it is rule-based, the
Transmission Division has no say in the setting of the transfer price.
3. If the two divisions were to negotiate a transfer price, the range of
possible transfer prices will be between $900 and $1,250 per unit. The
Transmission Division has excess capacity that it can use to supply
Chapter 19 - Strategic Performance Measurement: Investment Centers
19-67
19-49 (Continued)
transmission. The Auto Division will be willing to buy units from the
Transmission Division only if the price does not exceed the external
$900 and $1,250 will depend on the bargaining strengths of the two
divisions. The negotiated transfer price has the following properties.
a. Achieves goal congruence? Yes, as described above.
b. Useful for evaluating division performance? Yes, because the transfer
price is the result of direct negotiations between the two divisions. Of
specified by headquarters on the basis of some rule (such as the
producing division’s incremental costs).
4. Neither method is perfect, but negotiated transfer pricing (requirement 3)
has more favorable properties than the cost-based transfer pricing
(requirement 2). Both transfer-pricing methods achieve goal
congruence, but negotiated transfer pricing facilitates the evaluation of
Chapter 19 - Strategic Performance Measurement: Investment Centers
19-68
19-50 Transfer-Pricing Methods (45-60 minutes)
1. a. The positive and negative motivational implications arising from
employing a negotiated transfer price system for goods exchanged
between divisions include the following:
Positive:
• Both the buying and selling divisions have participated in the
autonomy/independence of the divisions.
Negative:
• The result of a negotiated transfer price between divisions may not
b. The motivational problems which can arise from using actual full
(absorption) manufacturing costs as a transfer price include the
following.
• Full-cost transfer pricing is not suitable for a decentralized
structure where the autonomous divisions are measured on
fixed costs. This price reduction would optimize overall company
performance.
Chapter 19 - Strategic Performance Measurement: Investment Centers
19-69
19-50 (continued-1)
2. The motivational problems that could arise if Mylar Corporation decides
to change its transfer pricing policy to one that would apply uniformly to
all divisions, include the following:
• A change in policy may be interpreted by the divisional managers as
and bonuses.
3. The likely behavior of both buying and selling divisional managers, for
each of the following transfer pricing methods being considered by Mylar
Corporation, include the following:
a. Standard full manufacturing costs plus a markup.
• The selling divisions will be motivated to control costs because any
divisions will be unhappy.
b. Market selling price of the product being transferred.
• Creates a fair and equal chance for the buying and selling divisions
to make the most profit they can and should promote cost control,
willing to enter into the transaction.
19-70
19-50 (continued-2)
c. Outlay (out-of-pocket) costs incurred to the point of transfer plus
opportunity cost per unit.
• This method is the same as market price when there is an
established market price and the seller is at full capacity. At any
level below full capacity, the transfer price is the outlay cost only
realize for the product under the circumstances. This method
should promote overall goal congruence between managers and
the firm, should motivate managers, and should optimize overall
company profits.
Chapter 19 - Strategic Performance Measurement: Investment Centers
19-71
19-51 Transfer Pricing; Decision Making (30-45 minutes)
1. Division B has capacity to produce 62,500 units (50,000 ÷ 0.80).
Division A will require 25,000 units, which will limit B’s outside sales
to 37,500 units, a loss in outside sales of 12,500 units (50,000 −
37,500).
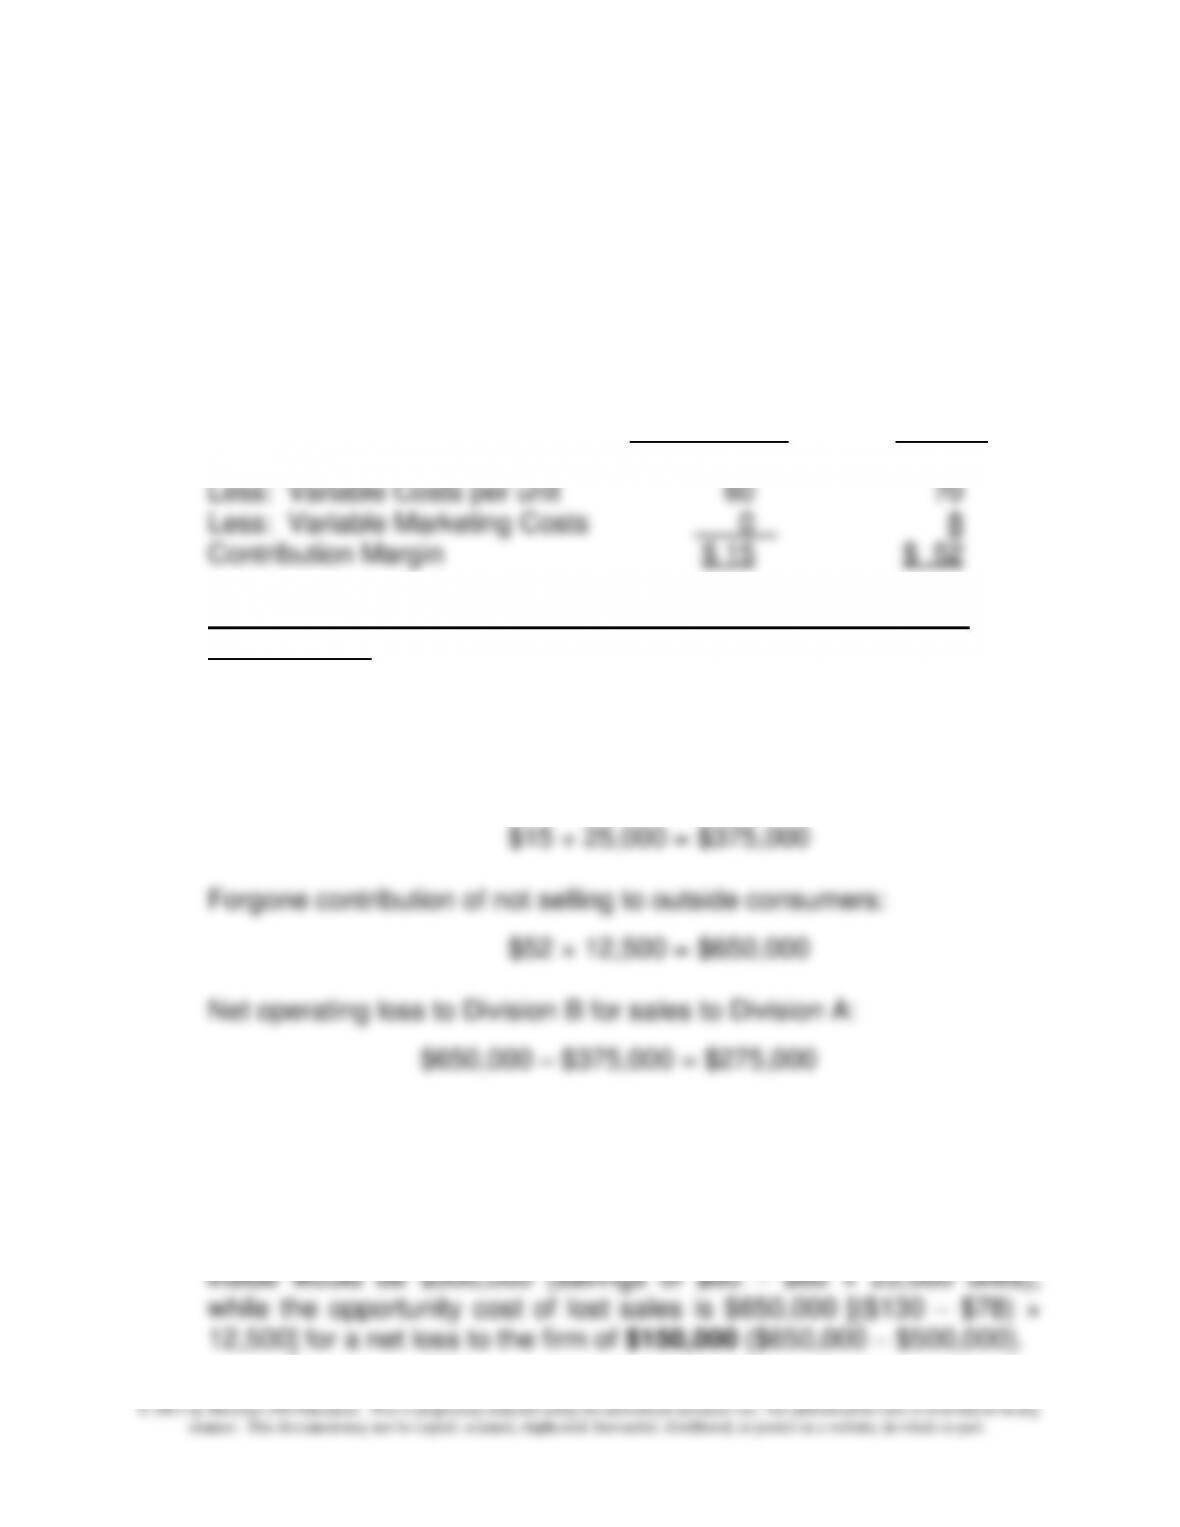
The contribution for each type of sale by Division B is:
To Division A Outside
Selling Price $ 75 $130
Determining the Best Decision (assuming Division A requires all
25,000 units):
The best decision in the interest of Division B is to not sell all 25,000
units to Division A:
Contribution for selling 25,000 units to Division A:
The Division B manager should reject the proposal because it
reduces Division B’s operating income by $275,000.
Also, the decision of Division B to not sell inside is in the best interest
of the firm as a whole. The savings to the firm of Division A buying
19-72
19-51 (continued)
If Partial Sales to Division A are OK:
Division B should sell as many units as possible (in this case 50,000
of total demand) to outside consumers. The remaining capacity (20%,
or 12,500 units) should be used to provide Division A with equipment.
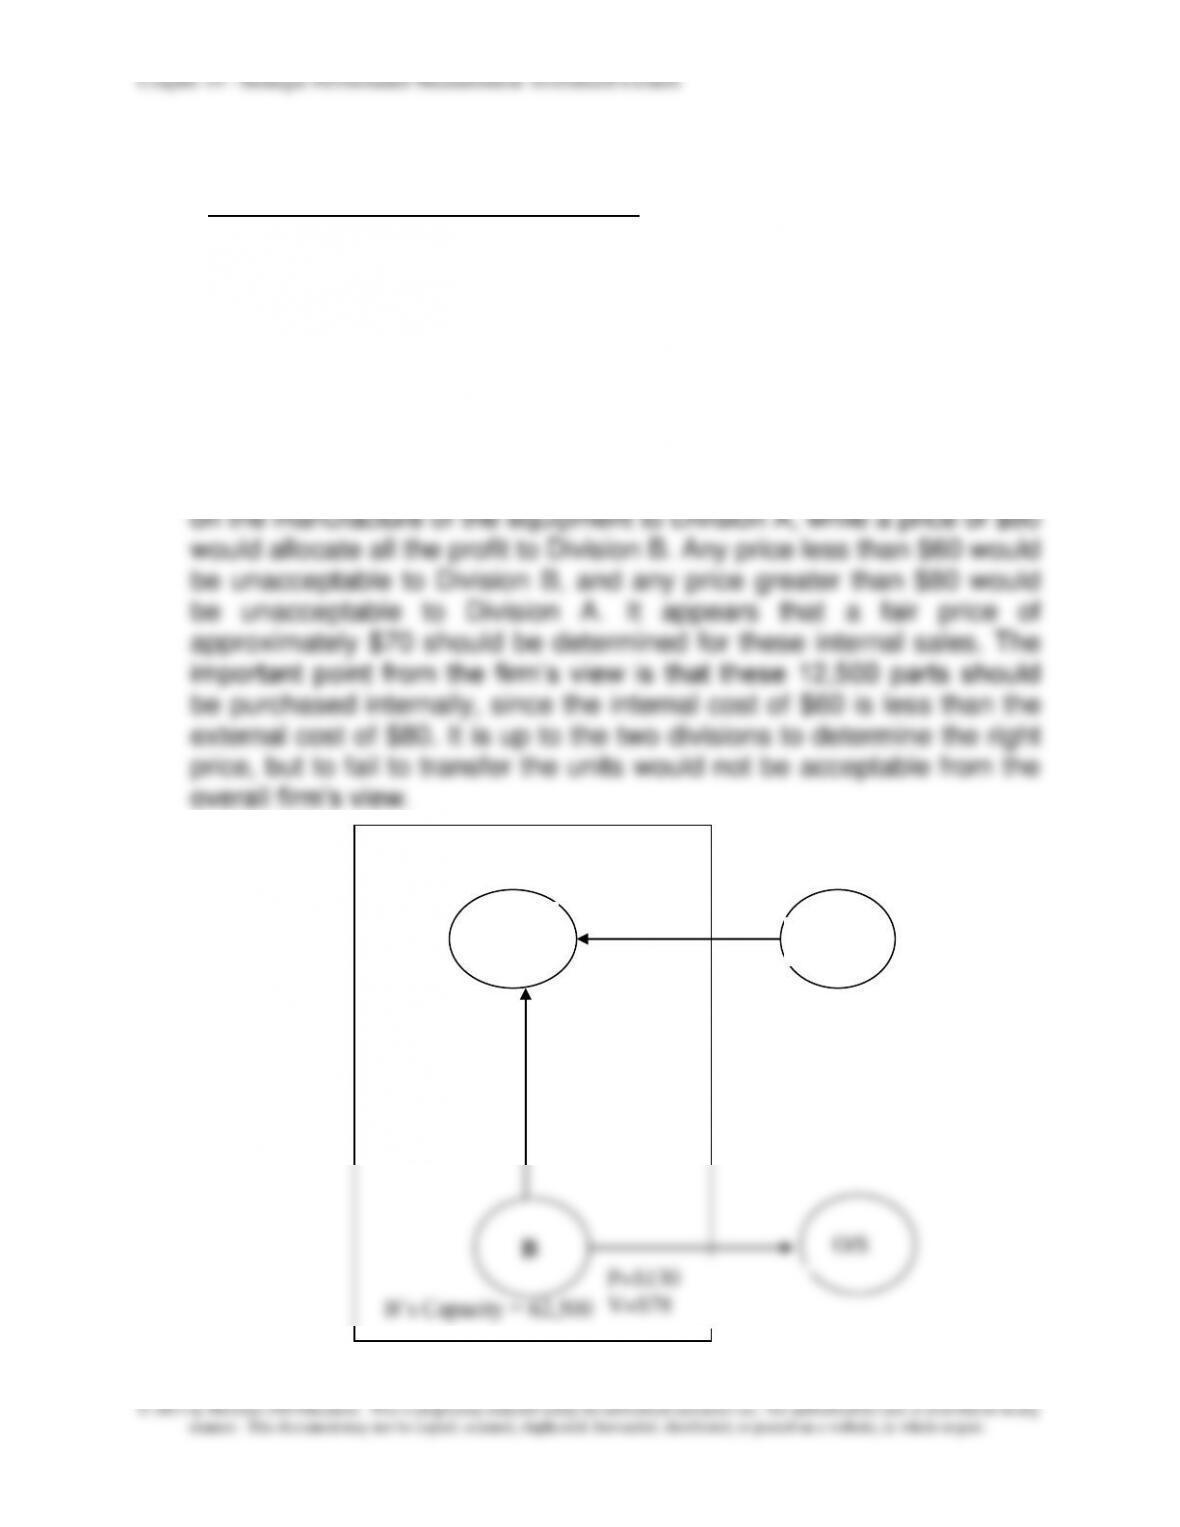
2. Assuming that Division B limits its sales to Division A to the excess
capacity of 12,500 units, the best transfer price should fall in the range
of $60 (Division B’s variable cost) and $80 (the outside purchase cost
to Division A). The two divisions should negotiate to determine the
desired price in this range. A price of $60 would allocate all the profit
A
B
O/S
O/S
P=$75 (what division A
wants)
V=$60
P=$130
V=$78
P=$80
B’s Capacity = 62,500
Chapter 19 - Strategic Performance Measurement: Investment Centers
19-73
19-52 Transfer Pricing; Strategy (30-45 minutes)
1. There are three options for the commercial division: buy from the
internal supplier (the industrial division), buy from Admiral Electric, or
buy from Advanced Micro. The analysis follows, from the perspective
of FMI:
Buy inside from the industrial division:
Cost to FMI (assuming the Industrial Division is at full capacity):
Ind. Div.’s variable cost: $155 × 5,000 $775,000
Buy from Admiral Electric: Cost to FMI is $210. The contribution on
sales to Admiral by the industrial division is ignored because these
sales are not contingent on the commercial division’s decision.
Buy from Advanced Micro:Cost to FMI: $200
Best decision for FMI: have the commercial division buy from
Advanced Micro, presuming the parts sold by Advanced Micro and
Admiral Electric are of equivalent quality and service. The cost is the
lowest, at $200.
The best transfer price, which would cause the buying division to
autonomously make the correct decision, would be to use the selling
division’s market price of $205.
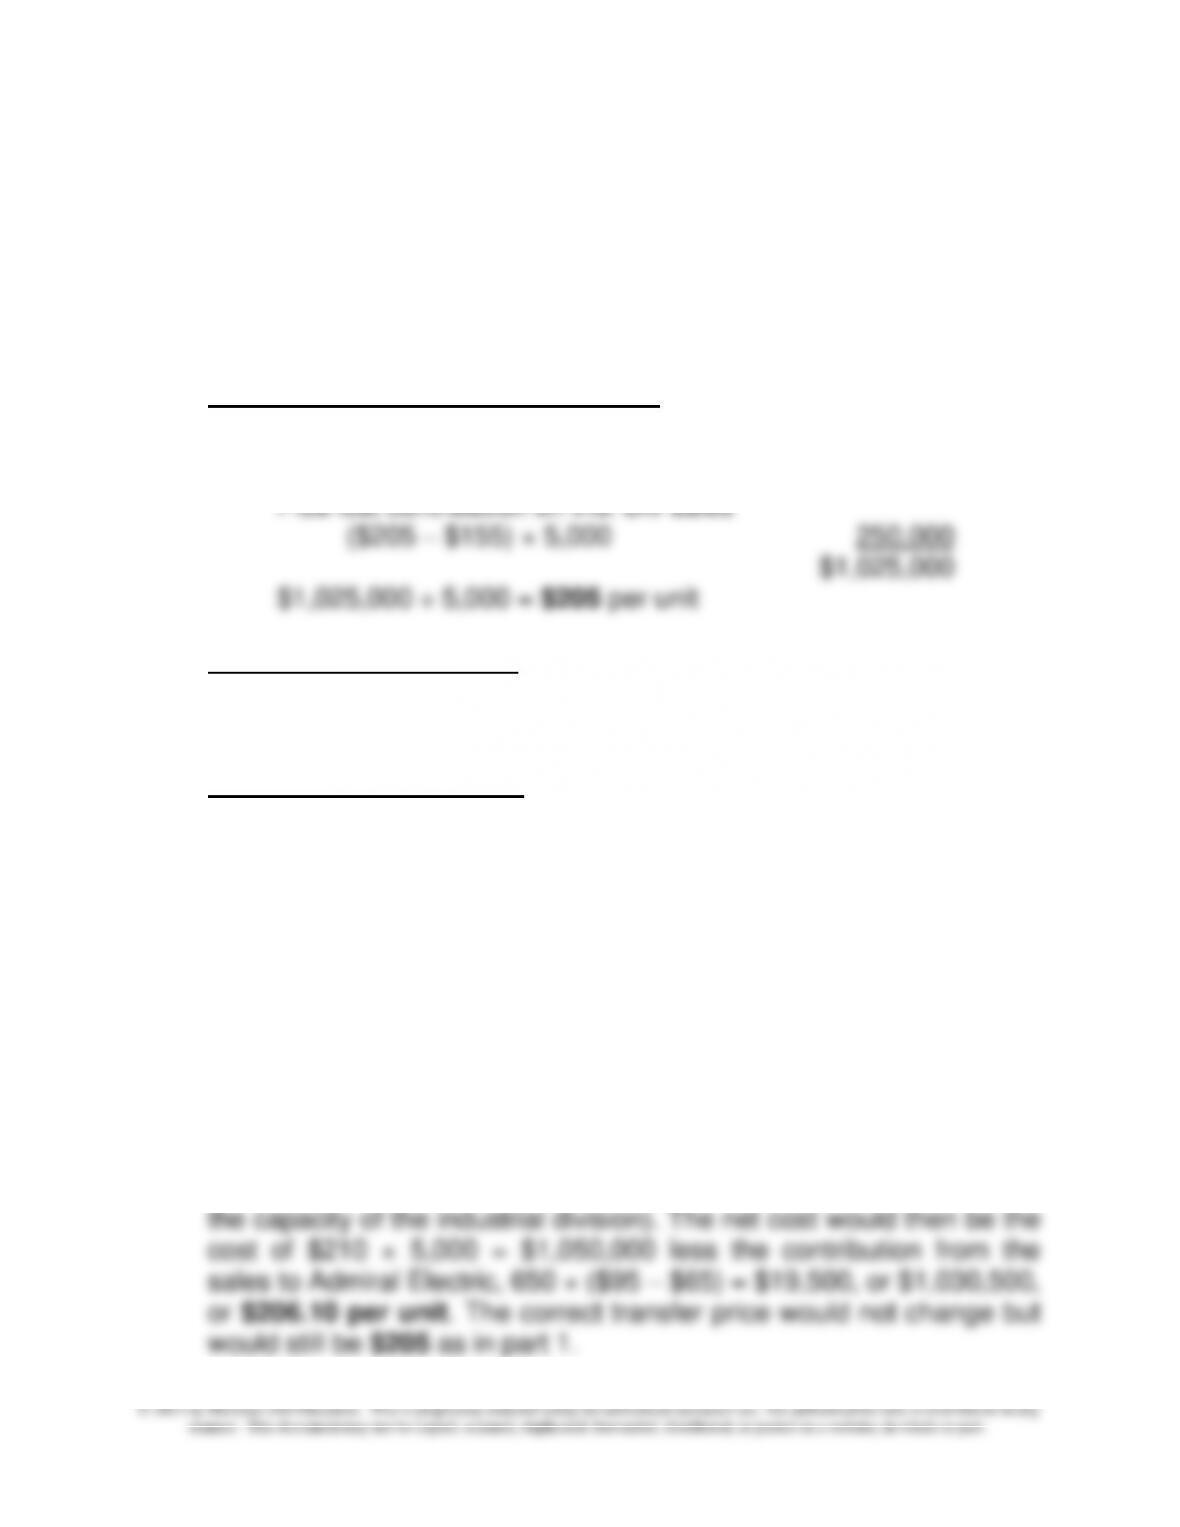
2. If the sales to Admiral Electric by the industrial division were
contingent on the commercial division’s decision, the relevant cost to
FMI would be the price of $210 × 5,000 units (amount needed over
Chapter 19 - Strategic Performance Measurement: Investment Centers
19-74
19-52 (continued)
3. The decision to have the commercial division buy outside to reduce
overall costs is also consistent with a strategy of decreasing the
reliance of the commercial division on products from the industrial
division. If top management is unsure about the growth potential of the
industrial division and has declined any new investments there,
perhaps the future holds capacity reduction or divestment of the
division’s decision. This is a positive statement about the quality of the
industrial division’s product and the quality of its relationship with
Admiral. Perhaps top management should rethink its long-term
strategy for the industrial division.
Chapter 19 - Strategic Performance Measurement: Investment Centers
19-75
19-53 Strategy; Strategic Performance Measurement; Transfer Pricing
(45-50 minutes)
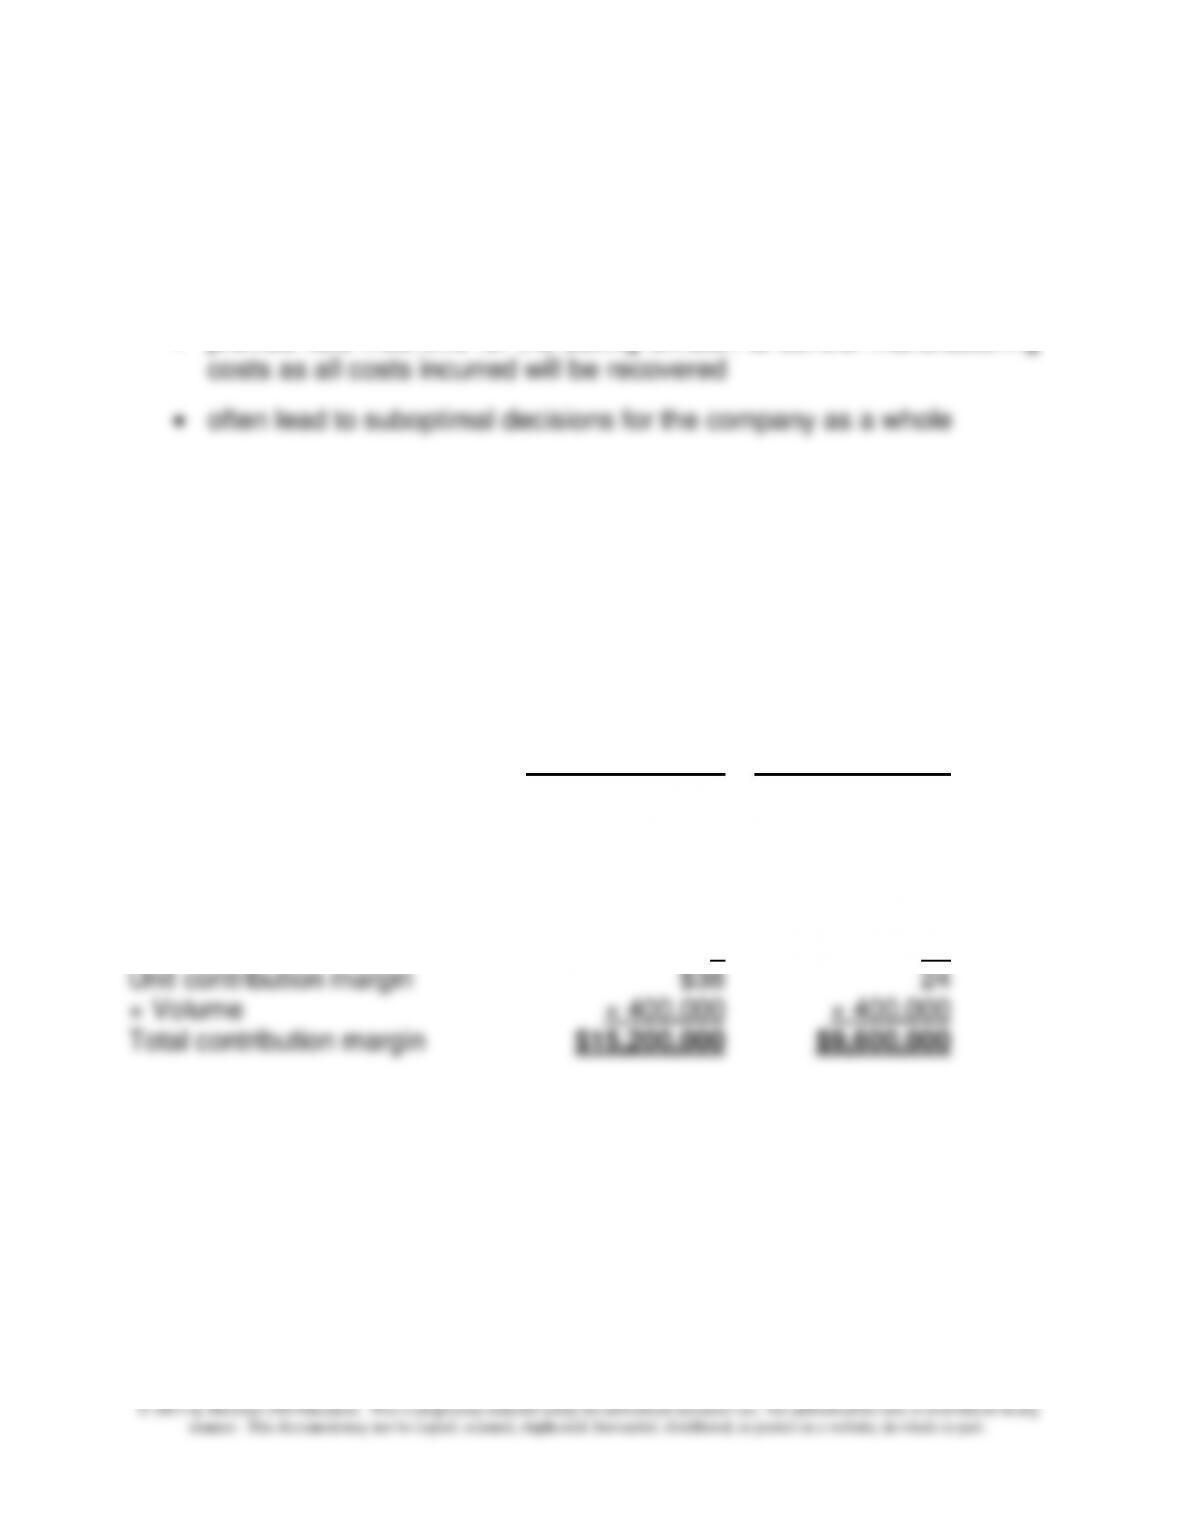
1. Transfer prices based on cost are not appropriate as a divisional
performance measure, and among the reasons are because they:
• provide little incentive for the selling division to control manufacturing
2.Using the market price as the transfer price the contribution margin for
both the Mining Division and the Metals Division for the year ended May
31, 2013 is as calculated below.
Ajax Consolidated Calculation of
Divisional Contribution Margin
For the Year Ended May 31, 2013
Mining Division
Metals Division
Selling Price
$90
$150
Less: Variable costs
Direct materials
12
6
Direct labor
16
20
Manufacturing overhead (1)
24
10
Transfer price
0
90
Unit contribution margin
$38
24
× Volume
× 400,000
× 400,000
Total contribution margin
$15,200,000
$9,600,000
Notes:
(1) Variable overhead = $32 × 75% = $24 for mining division;
Variable overhead = $25 × 40% = $10 for metals division
(2) The $5 variable selling cost that the Mining Division would incur for
sales on the open market should not be included as this is an
internal transfer.


