Chapter 19 – Strategic Performance Measurement: Investment Centers
19–42 Return on Investment (ROI); Strategy Map; Review of Chapter 18;
Correlation Analysis (60 minutes)
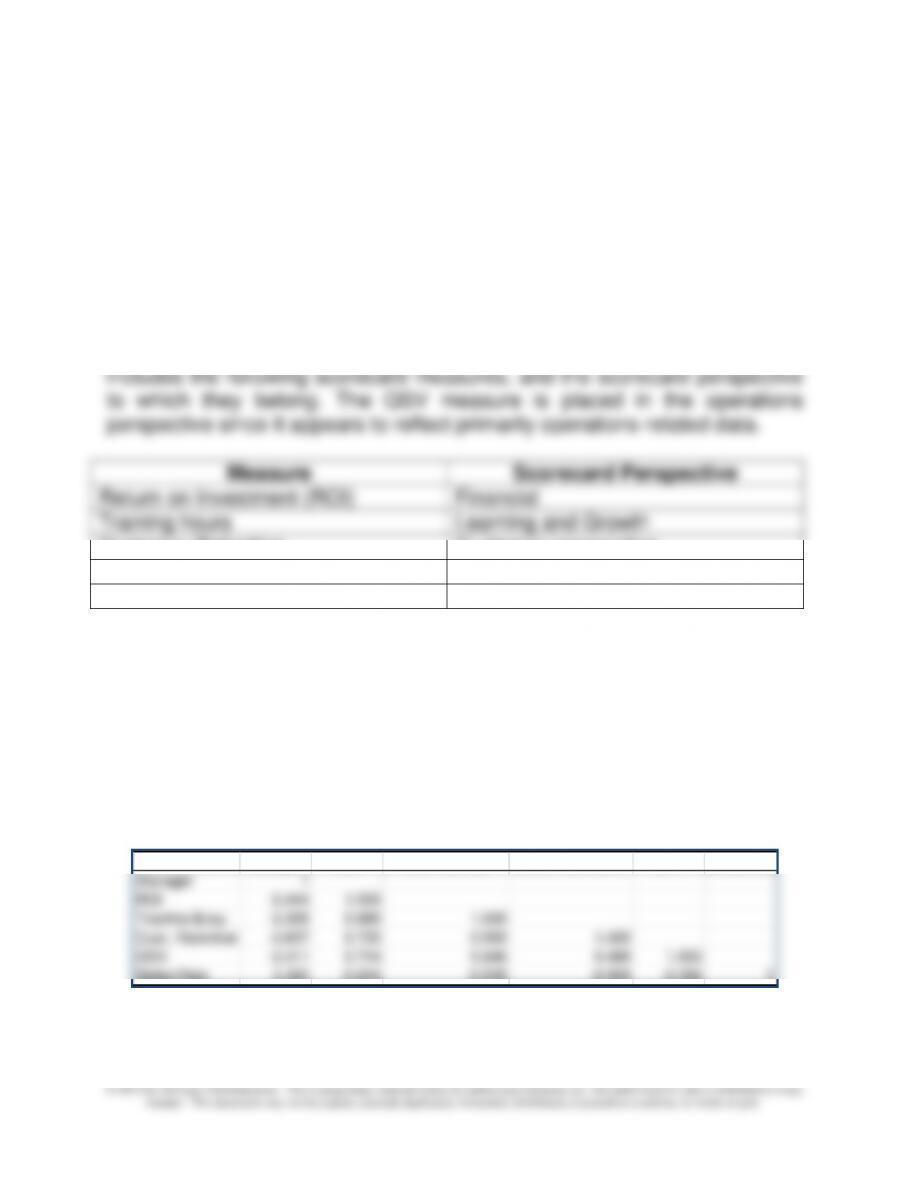
The objective of this problem is to have the student think of performance
evaluation in terms of the strategy map, as defined in Chapter 2 (and
illustrated in Exhibit 2.6). Moreover, the problem helps to show, using the
concept of the strategy map, that financial measures such as ROI are
linked to other measures in the balanced scorecard.
In addition to the ROI for each of the 15 units, the information provided
Chapter 19 – Strategic Performance Measurement: Investment Centers
19–47
19–42 (continued-1)
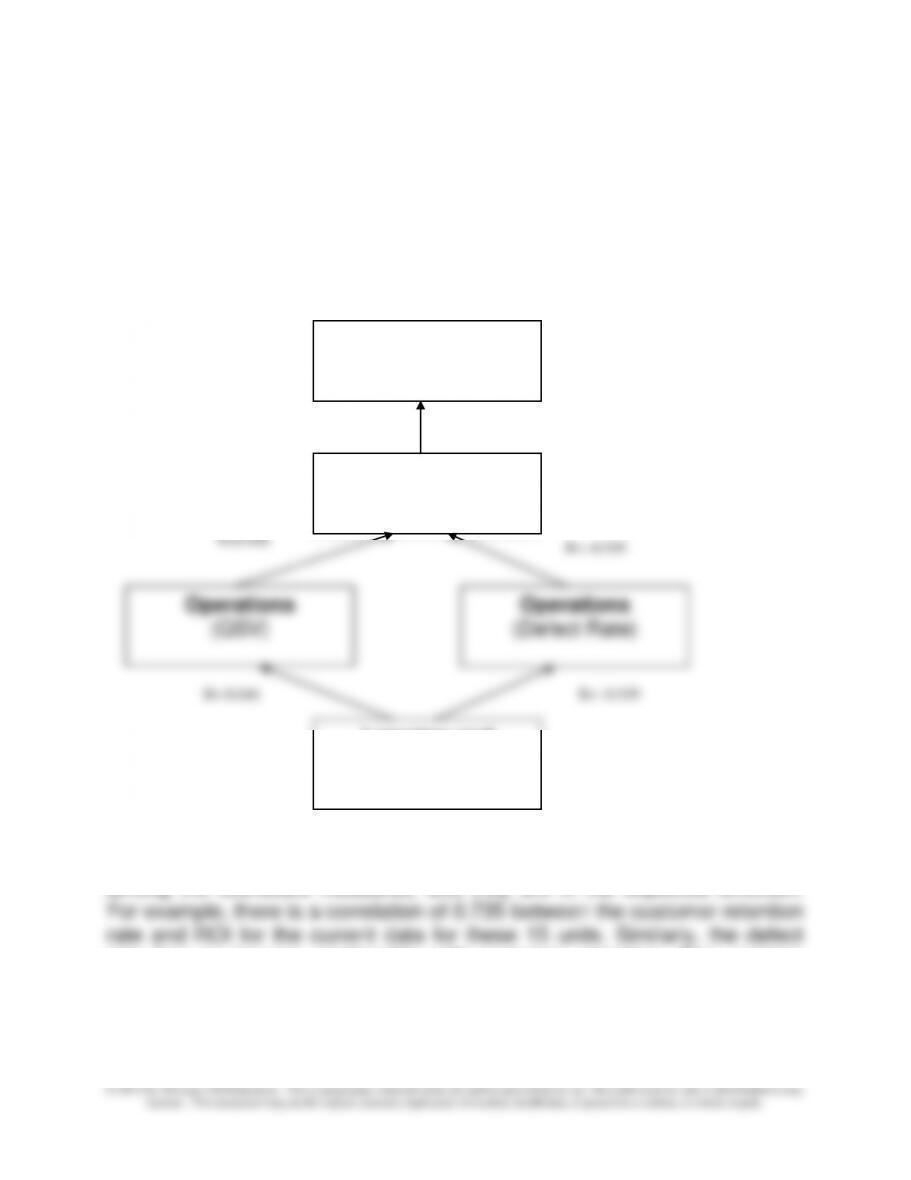
The strategy map (see text Exhibit 2.6) can be used to link these
scorecard measures in the following way. The correlation values (R) are
shown next to the related link in the strategy map. Note that there are two
measures and therefore two links in the operations perspective.
R= -0.539
R= 0.646
These correlations suggest that there is an important degree of correlation
among the scorecard measures, and they are in the expected direction.
rate has an inverse relationship with customer retention. Also, training
hours seems to have the desired effect of improving QSV and reducing the
defect rate.
Customer
(Retention rate)
Financial
(ROI)
Learning and
Growth
(Training Hours)
R = 0.735
R= -0.509
R=0.488
Chapter 19 – Strategic Performance Measurement: Investment Centers
19–42 (Continued-2)
The next step could be to ask why the effect of training on the defect rate is
not stronger, or why the QSV score does not have a stronger effect on
customer retention. Are these in fact the key scorecard measures, or are
there other measures that might be more important in influencing customer
retention and ROI?
2. There are a number of ways to determine the best and worst managers/
units. Some students choose a single measure as the dominant scorecard
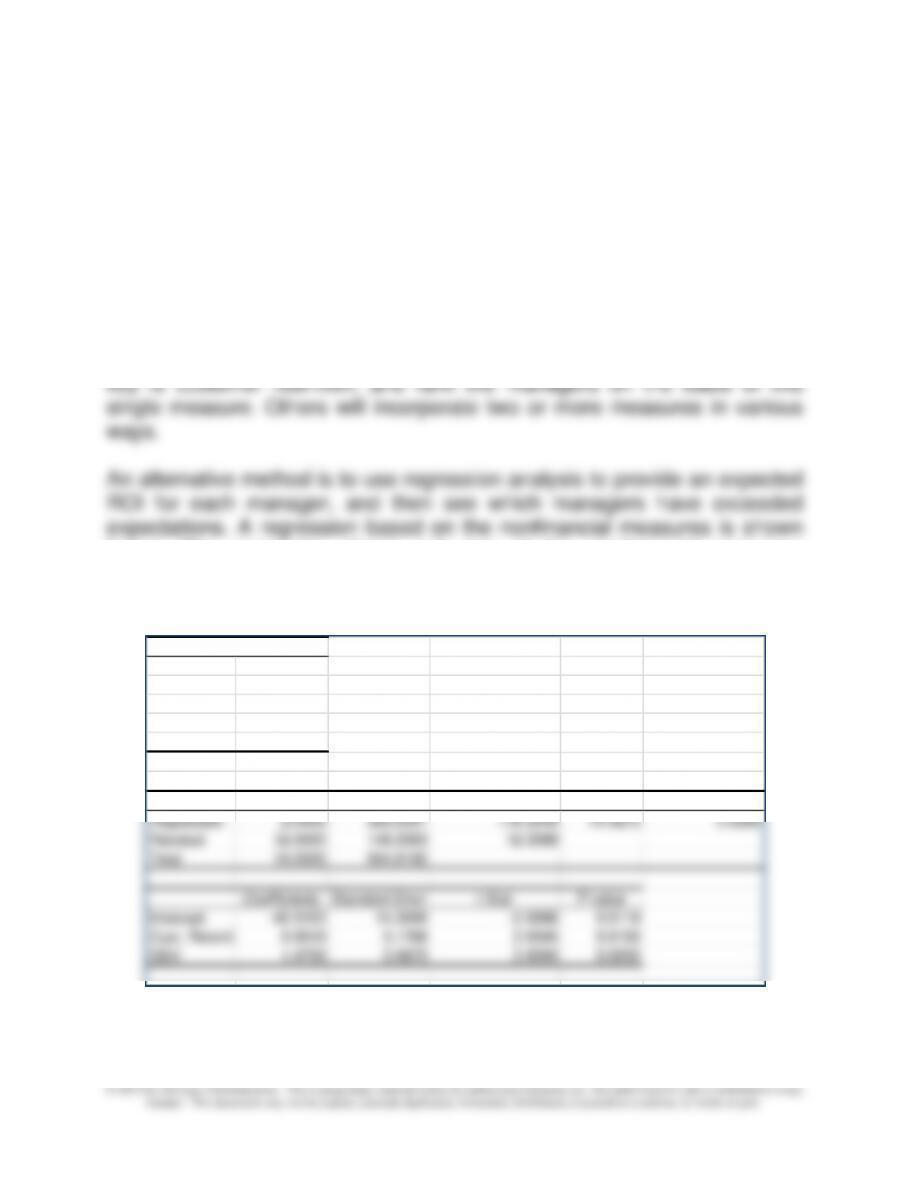
measure (such as ROI) and select on this basis. Others might say that the
below. The regression shows only two of the nonfinancial measures
(customer retention and QSV) because of the high multicollinearity among
the four measures.
Regression Statistics
Multiple R 0.8404
R Square 0.7063
Adjusted R S
0.6573
Standard Erro
3.5155
Observations 15
ANOVA
df SS MS F Significance F
Regression 2.0000 356.6097 178.3049 14.4273 0.0006
Residual 12.0000 148.3063 12.3589
Total 14.0000 504.9160
Coefficients Standard Error t Stat P-value
Intercept –42.5153 14.3689 –2.9588 0.0119
Cust. Retenti
0.5010 0.1768 2.8345 0.0150
QSV 1.4750 0.5673 2.6000 0.0232
Chapter 19 – Strategic Performance Measurement: Investment Centers
19–42 (continued-3)
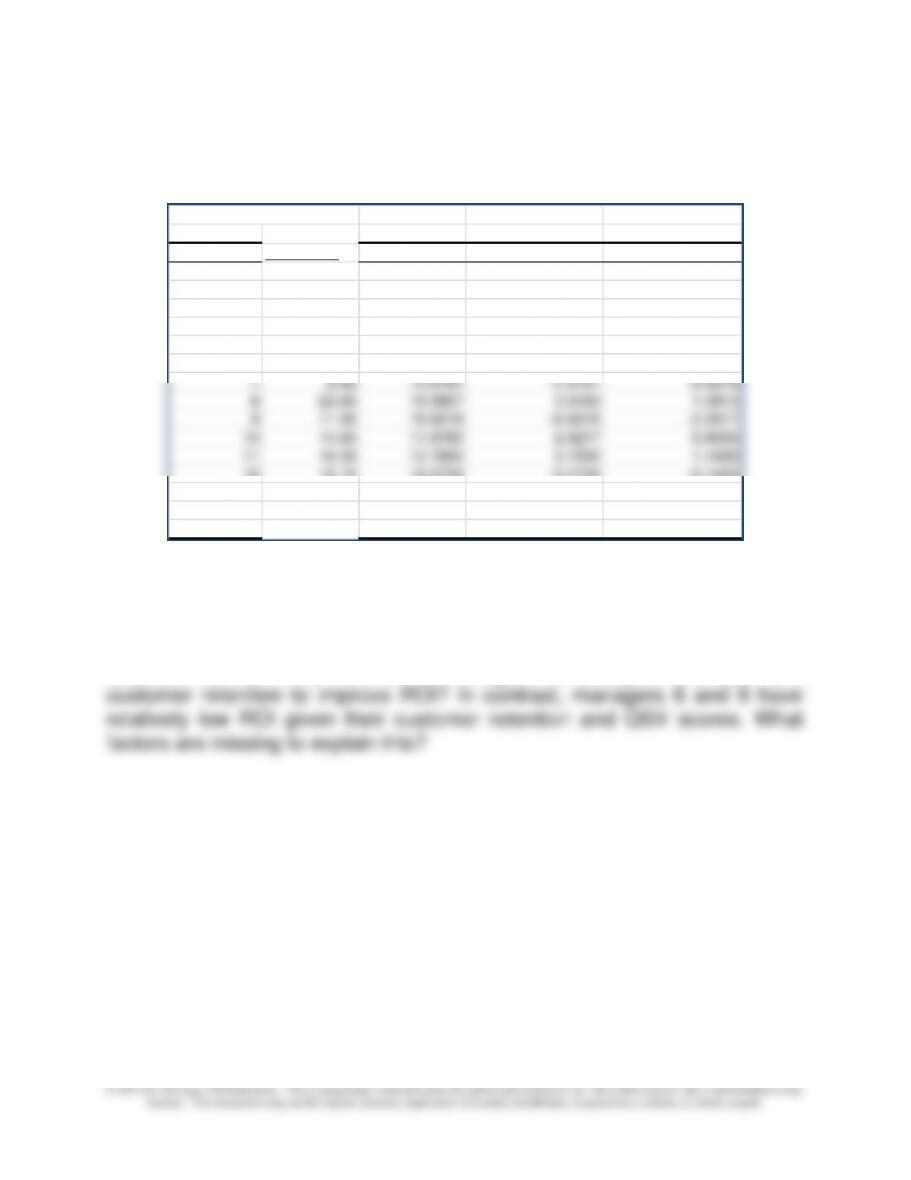
This regression has the following residual analysis:
Using this approach, and assuming that QSV and customer retention are
useful predictors of ROI, managers 1, 5, and 11 produced ROIs somewhat
higher than would have been expected given their QSV and customer
retention scores. What have these managers done beyond the QSV and
RESIDUAL OUTPUT
Manager Actual ROI Predicted ROI Residuals Standard Residuals
1 21.30 17.5617 3.7383 1.1486
2 15.40 18.4856 -3.0856 -0.9480
3 9.60 9.7738 -0.1738 -0.0534
4 12.40 13.0965 -0.6965 -0.2140
5 18.60 15.0786 3.5214 1.0819
6 4.50 8.8280 -4.3280 -1.3297
12 12.10 12.5734 -0.4734 -0.1455
13 6.20 3.5672 2.6328 0.8089
14 1.30 2.4649 -1.1649 -0.3579
15 9.70 10.6475 –0.9475 –0.2911
Chapter 19 – Strategic Performance Measurement: Investment Centers
19–50
19–43 Return on Investment (ROI); Residual Income (RI) (45 minutes)
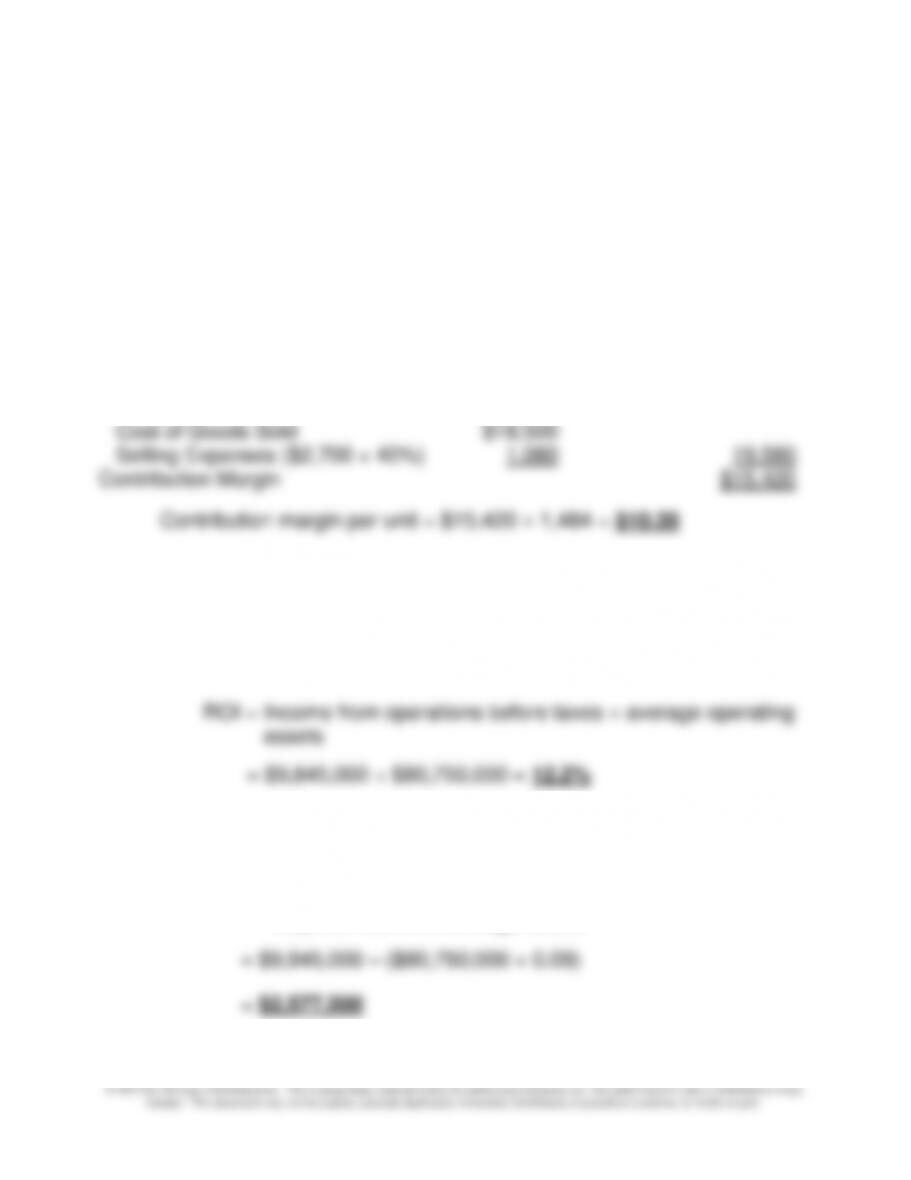
1. The calculation of the unit contribution margin for Reigis Steel Division,
assuming 1,484,000 units were produced and sold during the year
ended November 30, 2013 is presented below.
Reigis Steel Division
Operating Statement
For the Year Ended November 30, 2013
($000 omitted)
Sales Revenue
$35,000
Less Variable Costs
Cost of Goods Sold
$18,500
Selling Expenses ($2,700 × 40%)
1,080
19,580
Contribution Margin
$15,420
2. Calculations of selected performance measures for 2013 for Reigis Steel
Division are presented below
a. The pretax return on average investment in operating assets
employed is 12.2%, calculated as follows:
b. The calculation of residual income (RI) on the basis of average
operating assets employed is as follows:
RI = income from operations before taxes – minimum
required return on average assets

Chapter 19 – Strategic Performance Measurement: Investment Centers
19–51
19–43 (continued)
3. The management of Reigis Steel would have been more likely to accept
the contemplated capital acquisition if residual income (RI) were used as
the performance measure because the investment would have
investment that would lower the overall ROI (12.2% for 2013), even
though the return is higher than the required minimum, as this would
lower bonus rewards.
4. Reigis must be able to control all items related to profits and investment
if it is to be evaluated fairly as an investment center using either ROI or

Chapter 19 – Strategic Performance Measurement: Investment Centers
19–52
19-44 Calculating ROI and RI and Comparing Results (20-30 minutes)
1. a. ROI = Operating Income ÷ Average Assets
= $2,450,000 ÷ {[$15,000,000 + $15,000,000 ÷ 1.05] ÷ 2}
= $2,450,000 ÷ $14,642,857 = 16.73%
b. RI = Operating Income – (Investment × Min. rate of return)
2. In this case residual income (RI) provides the desired incentive for local
managers to make investments desired by top management. Delta
3. Like many organizations, Blackwood Industries should benefit from a
management control system which gives explicit attention to strategic
factors. The balanced scorecard (BSC) would be a useful approach to
accomplish this objective. The BSC considers not only financial
factors, but also non-financial factors such as progress with customer
relations, improvements in operations, and improvements in
capabilities of employees. The balanced scorecard would thus be a
Chapter 19 – Strategic Performance Measurement: Investment Centers
19–53
19–45 Residual Income (RI), Performance Evaluation Time Horizon (45-60 Minutes)
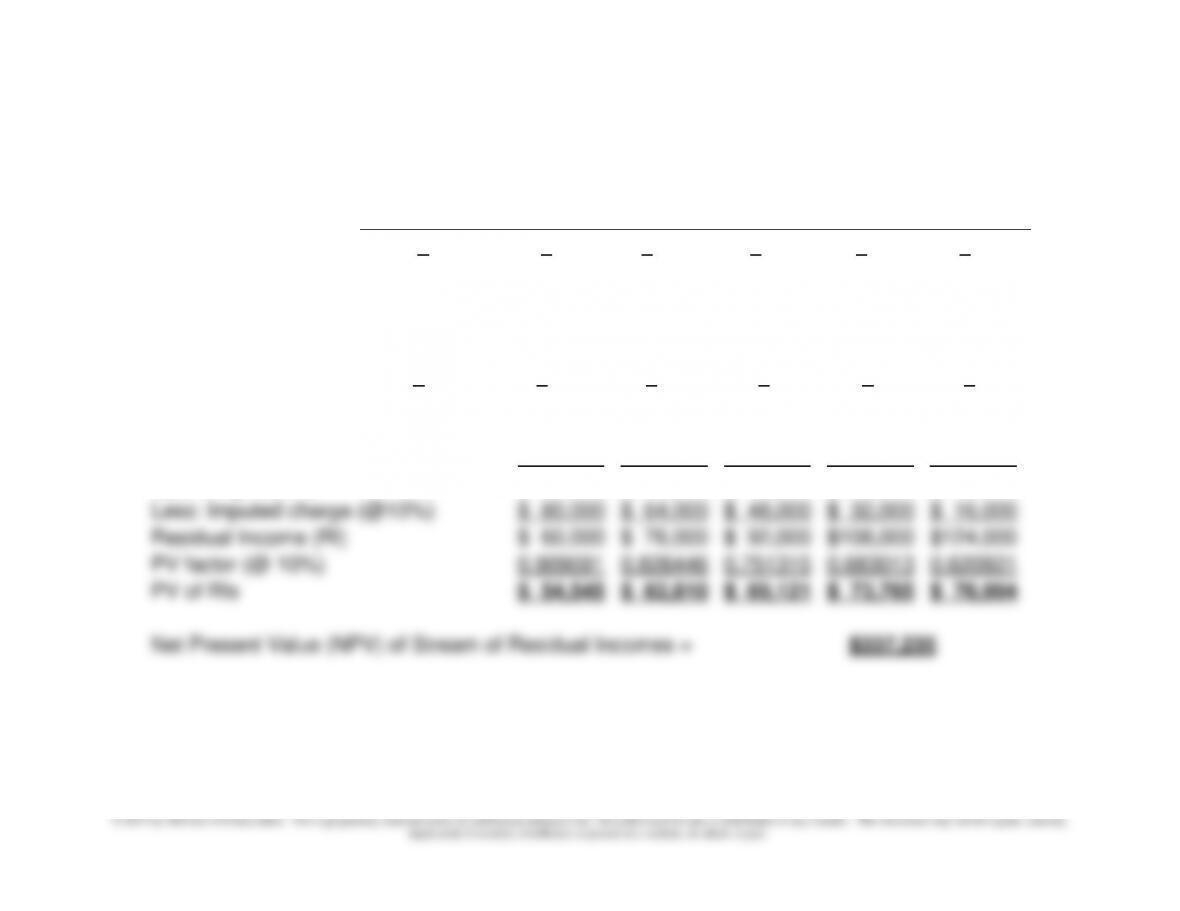
1. Estimated NPV of cash flows and estimated NPV of Residual Incomes (RI):
Time Period (Year)
0
1
2
3
4
5
Depreciation Expense =
$160,000
$160,000
$160,000
$160,000
$160,000
Beg.–of-Year NBV of asset =
$800,000
$640,000
$480,000
$320,000
$160,000
Time Period (Year)
0
1
2
3
4
5
Residual Incomes (RI):
Cash Inflow
$300,000
$300,000
$300,000
$300,000
$300,000
Less: Depreciation (SL)
$160,000
$160,000
$160,000
$160,000
$160,000
Operating Income
$140,000
$140,000
$140,000
$140,000
$140,000
Less: Imputed charge (@10%)
$ 80,000
$ 64,000
$ 48,000
$ 32,000
$ 16,000
Residual Income (RI)
$ 60,000
$ 76,000
$ 92,000
$108,000
$124,000
PV factor (@ 10%)
0.909091
0.826446
0.751315
0.683013
0.620921
PV of RIs
$ 54,545
$ 62,810
$ 69,121
$ 73,765
$ 76,994
Net Present Value (NPV) of Stream of Residual Incomes =
$337,235
Chapter 19 – Strategic Performance Measurement: Investment Centers
19–54
19-45 (Continued)
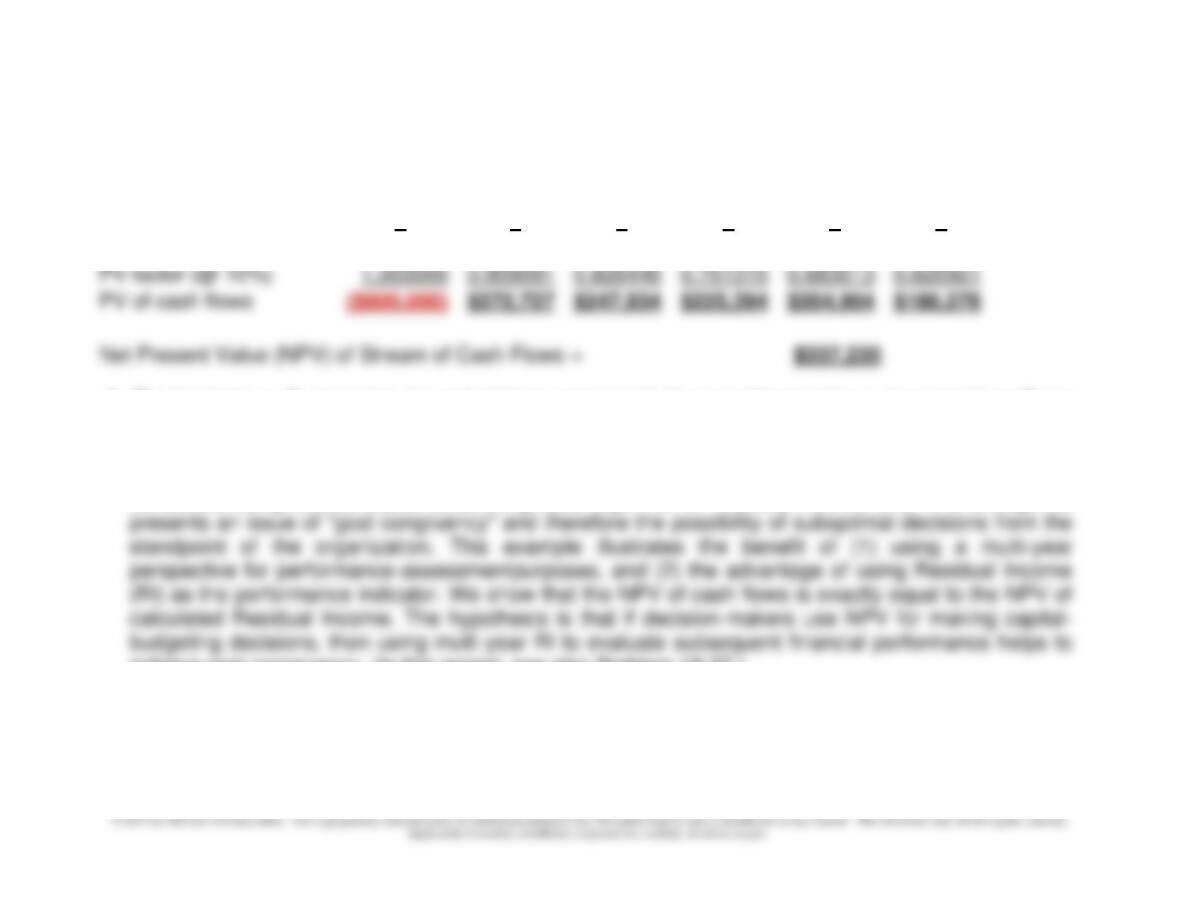
Time Period (Year)
0
1
2
3
4
5
Cash Flow
($800,000)
$300,000
$300,000
$300,000
$300,000
$300,000
PV factor (@ 10%)
1.000000
0.909091
0.826446
0.751315
0.683013
0.620921
PV of cash flows
($800,000)
$272,727
$247,934
$225,394
$204,904
$186,276
Net Present Value (NPV) of Stream of Cash Flows =
$337,235
2. The basic issue illustrated in the calculations presented above in (1) pertains to the incentive effects
of financial performance metrics, such as ROI and Residual Income (RI). We know from Chapter 12
that long-term investment decisions are typically made on the basis of a discounted cash flow (DCF)
basis. On the other hand, it is more typical that subsequentfinancial analysis of investment projects is
conducted using accrual-based accounting data, e.g., ROI or Residual Income (RI). This divergence
achieve goal congruency. (In this regard, see also Problem 19-37.)

Chapter 19 – Strategic Performance Measurement: Investment Centers
19–55
19–46 EVA® NOPAT and EVA® Capital; Operating Approach (45-60
Minutes)
Students should understand that EVA® is an approximation of an
entity’s true (i.e., “economic”) profits for a period. This measure of
profitability is defined as the difference between the entity’sNOPAT (net
operating profit after tax) and an imputed capital charge. NOPAT is
supposed to approximate the entity’s actual cash yield generated for
investors from recurring business activities during the period. The
amount of capital employed is supposed to represent the cash that
investors have put at risk in the firm, and upon which they expect an
appropriate return.To estimate both NOPAT and the amount of capital
for a period, the analyst begins with reported financial statement
amounts and then makes adjustments. These adjustments, in the
parlance ofEVA®, are collectively referred to as “equity equivalent
adjustments.”
The Operating Approach to NOPAT estimation starts by deducting
operating expenses—including depreciation—from sales. Next, equity-
equivalent (EE) reserve adjustments are made. Interest expense,
because it is a financing charge,is ignored, but other (operating) income
is added to get pretax economic profits, or Net OperatingProfit Before
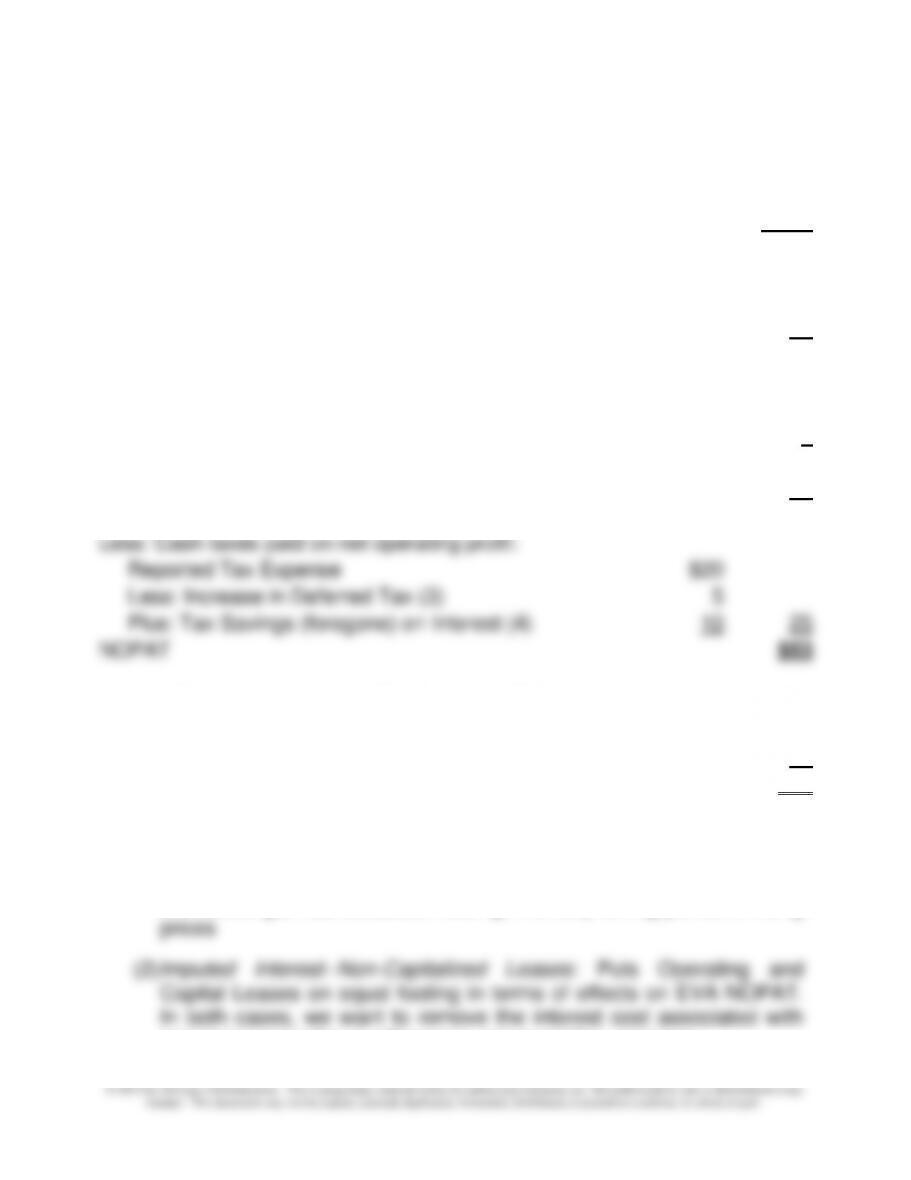
1. EVA®NOPAT—Operating Approach (see next page):
Chapter 19 – Strategic Performance Measurement: Investment Centers
19–56
19–46(Continued-1)
Net Sales
$2,000
Less: CGS
1,670
Gross Margin
$ 330
Less: S,G,& A Expenses
185
Less: Depreciation Expense
35
Less: Other (cash) operating expenses
50
$60
Adjustments:
Increase in LIFO reserve (1)
2
Imputed Interest—Non-capitalized leases (2)
4
Net Operating Profit
$66
Plus: Other Operating Income
12
NOPBT
$78
Less: Cash taxes paid on net operating profit:
Reported Tax Expense
$20
Less: Increase in Deferred Tax (3)
5
Plus: Tax Savings (foregone) on Interest (4)
10
25
NOPAT
$53
Interest Expense to Calculate Tax Savings (@40%):
Reported interest expense
$22
Imputed interest on non-cap. Leases
$4
Total interest (financing) expense
$26
Rationale for EE Adjustments made:
(1) LIFO Reserve: brings into earnings the current-period effect of
unrealized gain attributableto holding inventory during period of rising
leases because this is a financing, not operating, expense.
Chapter 19 – Strategic Performance Measurement: Investment Centers
19–57
19–46 (Continued-2)
(3) Increase in Deferred Taxes: If the Deferred Tax liability increases
during a period, itimplies that cash taxes paid during the year <
shield (tax savings) from NOPAT income as well.
2. EVA® Capital—Operating Approach:
Reported Current Assets (CA)
$510
Plus: LIFO Reserve (1)
10
Adjusted CA
$520
Less: NIBCLS:
Accounts Payable
$150
Income Tax Payable
20
Other Current Liabilities
200
370
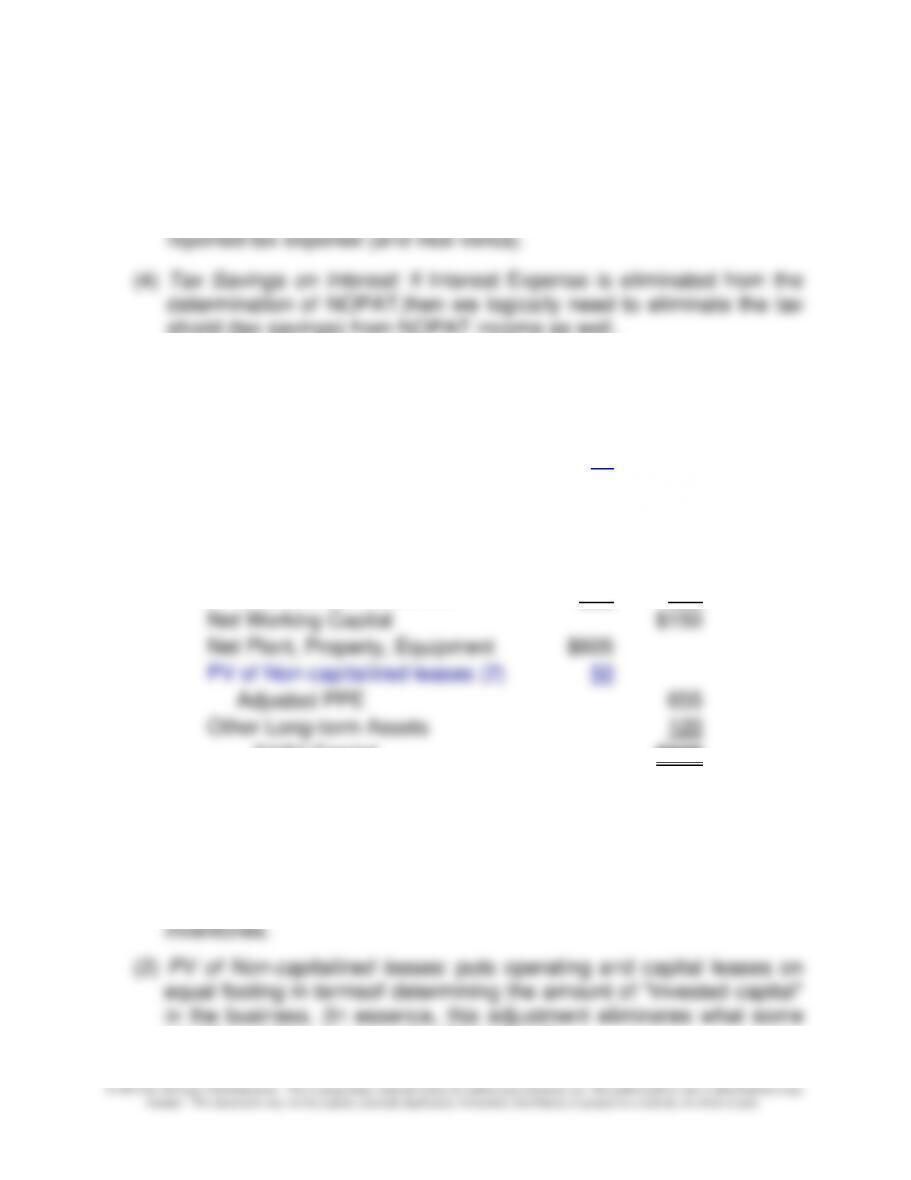
Net Working Capital
$150
Net Plant, Property, Equipment
$605
PV of Non-capitalized leases (2)
50
Adjusted PPE
655
Other Long-term Assets
120
EVA® Capital
$925
Rationale for Adjustments Made:
(1) LIFO Reserve: this adjustment converts the balance-sheet inventory
amount from a LIFO to a FIFO cost basis. In so doing, the resulting
amount better approximates the current replacement cost of
would consider an accounting “distortion.”)

Chapter 19 – Strategic Performance Measurement: Investment Centers
19–58
19–46 (Continued-3)
3. EVA® estimate—Operating Approach:
EVA® NOPAT =
$53
Capital Charge:
EVA® Capital =
$925
WACC =
10.70%
$99
EVA® =
($46)

Chapter 19 – Strategic Performance Measurement: Investment Centers
19–59
19-47 EVA® NOPAT and EVA® Capital; Financing Approach (45-60
Minutes)
1. Students should understand that EVA® is an approximation of an
entity’s true (i.e., “economic”) profits for a period. This measure of
profitability is defined as the difference between the entity’sNOPAT (net
operating profits after tax) and an imputed capital charge. NOPAT is
supposed to approximate the entity’s actual cash yield generated for
investors from recurring business activities during the period. The
amount of capital employed is supposed to represent the cash that
investors have put at risk in the firm, and upon which they expect an
appropriate return.To estimate both NOPAT and the amount of capital
for a period, the analyst begins with reportedfinancial-statement
amounts and then makes adjustments. These adjustments, in the
parlance ofEVA®, are collectively referred to as “equity equivalent
adjustments.”
The financing approach to estimating EVA® NOPAT begins with the
reported amount of income available to common shareholders. To this
amount, adjustments are made to eliminate financingeffects (distortions)
and accounting distortions (such as LIFO reserve adjustments and
adjustmentsregarding Deferred Income Taxes). The financing approach
to estimating EVA capital consists of adding together interest-bearing
debt + equity in the firm.
1. EVA® NOPAT—Financing Approach:
Income available to common
$30
Plus: Equity-Equivalent (EE) Adjustments:
Increase in Deferred Tax account (1)
$5
Increased in LIFO Reserve (2)
2
7
Adjusted Income to Common
$37
Financing Adjustments:
Reported Interest Expense
$22
Imputed Interest—Leases (3)
4
$26
Tax Savings (Foregone) on Interest (4)
10
Interest Expense after Income Tax Effects
16
EVA® NOPAT
$53
Chapter 19 – Strategic Performance Measurement: Investment Centers
19–60
19–47 (Continued-1)
Rationale for above (EE) adjustments:
(1) Change in Deferred Tax account: this adjustment converts reported
tax expense to approximate the amount of cash tax expense
(2) Increase in LIFO reserve: this adjustment converts LIFO (i.e., “old”)
operating, activity, its net effect (after-tax) needs to be removed
from reported earnings.
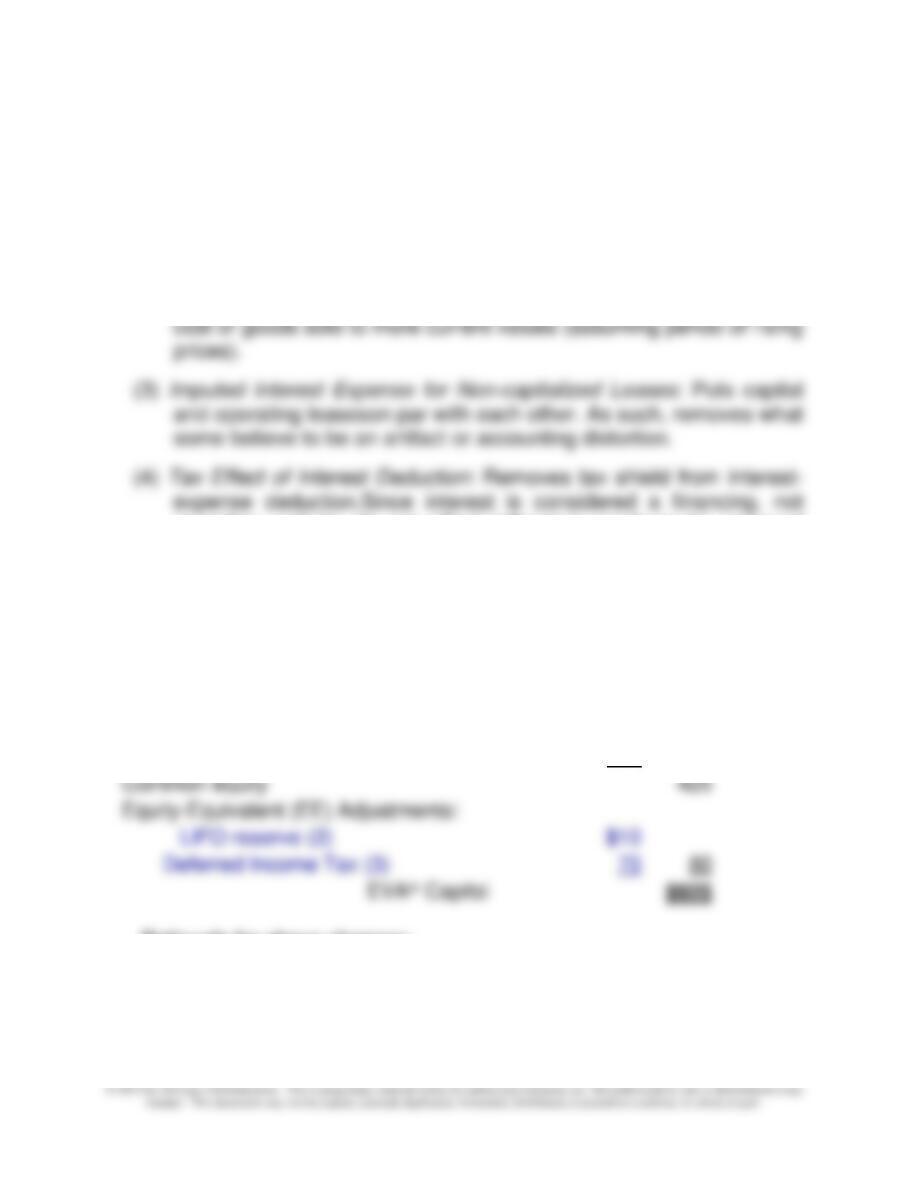
2. EVA® Capital—Financing Approach:
Total debt + leases:
Short-term Interest-bearing debt (10%)
$100
Long-term Interest-bearing debt (8%)
150
PV of non-capitalized leases (1)
50
Other long-term liabilities
120
$420
Common equity
425
Equity-Equivalent (EE) Adjustments:
LIFO reserve (2)
$10
Deferred Income Tax (3)
70
80
EVA® Capital
$925
Rationale for above changes:
(1) PV of non-capitalized leases: this adjustment is needed to bring
consistency betweenthe treatment of capital and operating leases,