Chapter 19 – Strategic Performance Measurement: Investment Centers
19–31
Totals
$1,500,000
$1,000,000
$500,000
$500,000
$0
19–36 (Continued-3)
c. Using NBV as the investment base and DDB depreciation (per
requirement 4(1) above):
Year
Income
Prior to
Deprec.
Depreciation
Charge
Operating
Income
After
Depreciation
Less:
Imputed
Capital
Charge
Residual
Income
1
$300,000
$400,000
($100,000)
$90,000
($190,000)
2
$300,000
$240,000
$60,000
$70,000
($10,000)
3
$300,000
$144,000
$156,000
$50,000
$106,000
4
$300,000
$108,000
$192,000
$30,000
$162,000
5
$300,000
$108,000
$192,000
$10,000
$182,000
Totals
$1,500,000
$1,000,000
$500,000
$250,000
$250,000
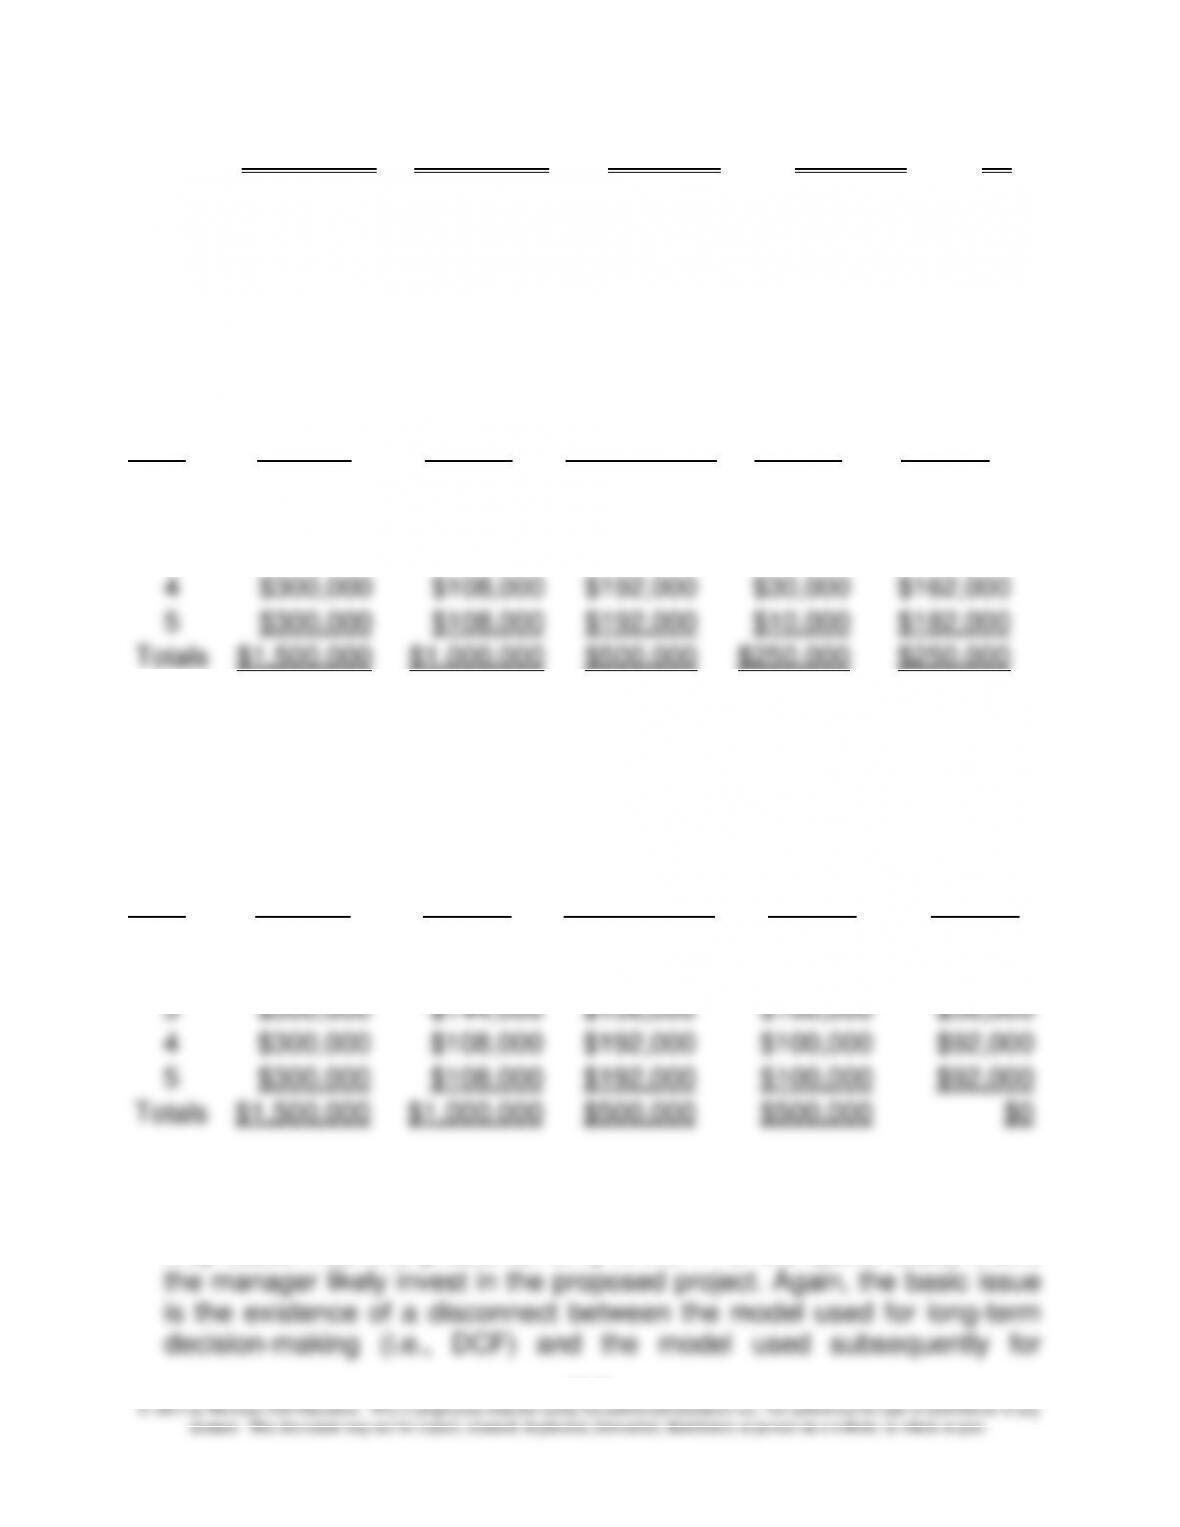
d. Using GBV as the investment base and DDB depreciation (per
requirement 4(2) above):
Year
Income
Prior to
Deprec.
Depreciation
Charge
Operating
Income
After
Depreciation
Less:
Imputed
Capital
Charge
Residual
Income
1
$300,000
$400,000
($100,000)
$100,000
($200,000)
2
$300,000
$240,000
$60,000
$100,000
($40,000)
3
$300,000
$144,000
$156,000
$100,000
$56,000
4
$300,000
$108,000
$192,000
$100,000
$92,000
5
$300,000
$108,000
$192,000
$100,000
$92,000
Totals
$1,500,000
$1,000,000
$500,000
$500,000
$0
As shown by the results above, the use of accounting (i.e., accrual–
based) earnings numbers into the calculation of ROI introduces bias and
may cause incentive problems. Only in the 1st of the above cases would

Chapter 19 – Strategic Performance Measurement: Investment Centers
19–32
assessing financial performance. One possibility, as discussed in the
text, would be to use “present-value” depreciation as a way to achieve
convergence between the two models. Another important lesson is the
19–36 (Continued-4)
need to supplement financial analysis with non-financial information
when making long-term investments and subsequently evaluating actual
performance.
An Excel file solution for this assignment is embedded (below) into this
Word solution file. To access the Excel file solution, place the cursor
anywhere over the object, right-click, choose “Worksheet Object,” then
choose “open.”
Pr. 19-36.xlsx
19–33
© 2013 by McGraw-Hill Education. This is proprietary material solely for authorized instructor use. Not authorized for sale or distribution in any
manner. This document may not be copied, scanned, duplicated, forwarded, distributed, or posted on a website, in whole or part.
19–37 ROI, Present-Value Depreciation; Spreadsheet Application (60
Minutes)
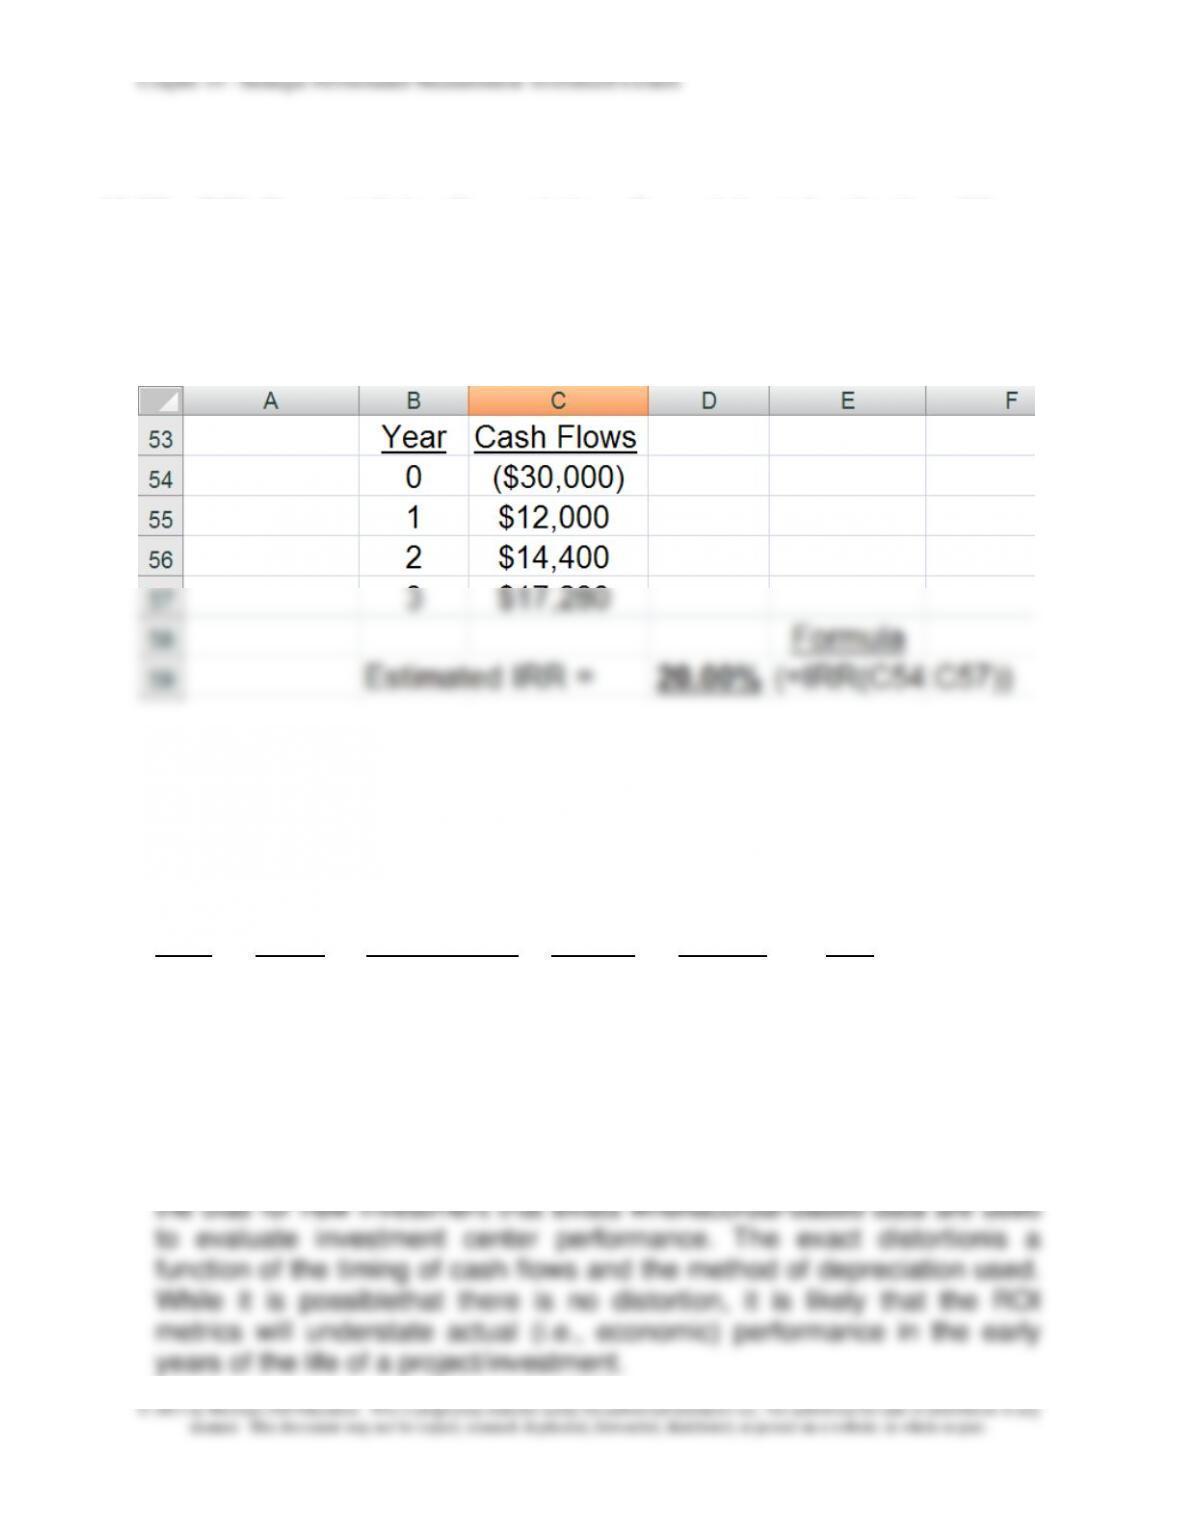
1. Determining the IRR of the proposed investment (using the built-in
function in Excel):
2. Year-by-Year Accounting Rate of Return (SL depreciation);
Investment measured as beginning-of-year book value
BOY
Book
SL
Cash
Operating
Year
Value
Depreciation
Inflows
Income
ROI
0
1
$30,000
$10,000
$12,000
$2,000
6.67%
2
$20,000
$10,000
$14,400
$4,400
22.00%
3
$10,000
$10,000
$17,280
$7,280
72.80%
Given the required rate of return for this company (15%), this project will
appear unsatisfactoryin Year 1. The point of this example is to illustrate

Chapter 19 – Strategic Performance Measurement: Investment Centers
19–34
19–37 (Continued-1)
3. Year-by-Year ROI, Present-Value Depreciation:
PV of Cash
Decrease
Cash
Inflows (@
in PV of
Year
Flows
20%)
the Asset
0
($30,000)
$30,000
1
$12,000
$24,000
$6,000
2
$14,400
$14,400
$9,600
3
$17,280
$0
$14,400
BOY Book
PV
Cash
Operating
Year
Value
Depreciation
Inflows
Income
ROI
1
$30,000
$6,000
$12,000
$6,000
20.00%
2
$24,000
$9,600
$14,400
$4,800
20.00%
3
$14,400
$14,400
$17,280
$2,880
20.00%
Summary:The use of present-value (i.e., “economic”) depreciation
reduces the negative incentive effects illustrated above in part 2.
4. Estimated Year-by-Year Residual Income (RI), Present-Value
Depreciation:
Year
1
2
3
Cash Inflows
$12,000
$14,400
$17,280
Present Value
Depreciation
$6,000
$9,600
$14,400
Imputed Capital Charge:
$30,000 × 0.10 =
$3,000
$24,000 × 0.10 =
$2,400
$14,400 × 0.10 =
$1,440
Residual Income (RI) =
$3,000
$2,400
$1,440

Chapter 19 – Strategic Performance Measurement: Investment Centers
19–35
19–37 (Continued-2)
Using the built-in function (NPV) in Excel, we estimate the following:
Estimated NPV of RIs, at 10% =
$5,793
Estimated NPV of Investment, at 10% =
$5,793
Summary: For an economically desirable project (as in the case here:
IRR > 10%), the RI for each year of a project’s life will be positive so
long as present-value depreciation is used in the calculations. That is, if
PV depreciation is used, then the RI each year will be > $0 when we
accept an economically desirable investment. The use of RI(with PV
depreciation) for assessing financial performance is analogous to the
use of NPV for capital budgeting purposes, as illustrated above. This
brings together the twomodels: one for making the investment decision
(NPV), and the other for evaluating subsequent performance (RI, with
PV depreciation).
An Excel file solution for this assignment is embedded (below) into this
Word solution file. To access the Excel file solution, place the cursor
anywhere over the object, right-click, choose “Worksheet Object,” then
choose “open.”
Pr. 19-37.xlsx

Chapter 19 – Strategic Performance Measurement: Investment Centers
19–36
19–38 Return on Customer; Review of Chapter 5 (15-20 minutes)
ROC for Customer X:
ROC = $25,000 + ($75,000 – $150,000)
$150,000
ROC for Customer Z:
While there are currently more profits on customer X sales, the future is
much more promising for customer Z. The CLV for customer Z has
increase by $50,000, while the CLV for customer X has fallen by $75,000.
The ROC measure can be used to target sales manager’s attention to
important changes in customer values. In this case, perhaps rewards are
in order for the sales people who have developed customer Z, and some
attention should be directed to correcting an unfavorable change in the
expected sales profits from customer X; are we losing X as a customer, or
has there been an unfavorable change in the sales mix to this customer,…
Source: Don Peppers and Martha Rogers, Return on Customer,
Doubleday, New York, 2005.

Chapter 19 – Strategic Performance Measurement: Investment Centers
19–37
19–39 Research Assignment, Strategy (60 minutes, including reading time)
1. As the authors note on page 123 of their article, “Globalization has left
only one true path to profitabilityfor firms operating in high-wage,
developed nations: to base their competitive strategy on exceptional
human capital management (HCM).” In the past, these same firms may
have been able to secure sustainable competitive advantage by
managing their financial or physical capital. Performance-measurement
systems for managing such assets are well-developed and key to
traditional managementaccounting and control systems. The
2. The overall purpose of the framework proposed by the authors is to
establish empirical linkagesbetween “people” (or, the quality of HCM)
and organizational performance (e.g., sales revenue, factory safety,
student scores on standardized tests, or stock-market returns).
Conceptually, the authors aretrying to model key HCM drivers of
organizational performance. These drivers fall into the followingfive
used to rate theorganization on the range of HCM practices across the
five major categories.
From the standpoint of a management accounting and control system,
the key imperative is tofocus, for the given organization, on the most
important HCM drivers of organizational success. This requires a
statistical analysis between HCM scores over time (or across

Chapter 19 – Strategic Performance Measurement: Investment Centers
19–38
organizational units) and keyorganizational outcomes (such as
employee commitment or financial performance). Such analysis can
19–39 (Continued-1)
take various forms, from the simple (e.g., looking for statistically
significant differences betweenorganizational subunits) to the complex
(e.g., using nonlinear, multiple regression). Once the mostthe key
driver.
3. Examples:
Example #1—Improving Sales and Safety Performance at American
Standard Companies (manufacturer):survey data were gathered from
more than 300 corporate locations.
Drivers of Sales Performance: By analyzing survey scores across
different units, the company was able to determine that the following
three HCM factors were most highly correlated with sales
performance: executive and supervisory skills (both of which were in
the “Leadership Practices” category), information sharing (in the
“Knowledge Accessibility” category), and innovation (in the
“Learning Capacity” category).
Drivers of Plant Safety Performance: A similar study revealed a
relationship between certain HCM practices and accident rates.
Safer plants excelled in three major areas: (1) supervisory skills (in
the “Leadership Practices” category), (2) information sharing (in the
“Knowledge Accessibility”category), and (3) supporting employee
skill development (in the “Learning Capacity” category).
Chapter 19 – Strategic Performance Measurement: Investment Centers
19–39
19–39 (Continued-2)
Example #2—Improving Student Test Scores (public school system):
survey data in this case were collected from South Carolina’s Beaufort
County School District, which was realizing below-average scores on
state achievement tests taken by its students. The goal was to identify
and manage the HCM practices that had the most positive effect on
(mean) student performance scores.Cross-sectional data from various
school districts in the state indicated a positive relationship between total
Specific drivers of performance, uncovered during the statistical analysis
of results, included items such as teachers’ overall work culture, learning
culture, and the school’s ability to reinforce and retain talent.
Example #3—Increasing Stock Returns in Financial Services Firms: the
authors collected total HCMsurvey scores from 11 different publicly
traded financial services firms and correlated these scoreswith one-year
ahead stock-market performance (total returns) of these firms. This
Chapter 19 – Strategic Performance Measurement: Investment Centers
19–40
19–40 Research Assignment: Employee Wellness Programs;
Sustainability (60 minutes, including reading time)
1. On page 106 the authors define “workplace wellness” as “an organized,
employer-sponsored program that is designed to support employees
2. The following evidence regarding the ROI of employee wellness
programs is offered by the authors of the article:
a. For Johnson & Johnson, over the period 2002 to 2008, the ROI on
such expenditures is estimated as $2.71 to $1.00 ($2.71 of savings for
every dollar spent); in absolute terms, these cost savings are
estimated as $250 million.
reduction in health-related lost days of work, $1.5 million; 50%
reduction in workers compensation premiums.
3. What do the authors of this article cite as important non-financial
performance indicators associated with corporate wellness programs?
a. J&J: reduction in number of employees that smoke, 2/3.
b. For the participants in the program referenced above in 2b, 57% of
those classified as “high–risk” (in terms of blood pressure, % body fat,
e. Increased employee productivity (p. 109)
f. Increased employee morale (p. 109)
Chapter 19 – Strategic Performance Measurement: Investment Centers
19–41
19-40 (Continued-1)
g. See “Dashboard for Workplace Wellness Programs” (p. 111) for one
comprehensive model for capturing key benefits, both to employees
and to the company.
4. Six pillars of a successful, strategically integrated wellness program:
1. Multilevel Leadership (i.e., engaged leadership at multi levels,
including C-suite [e.g., Johnson & Johnson, MD Anderson Cancer
Center], middle management, wellness program managers, and
“wellness champions” [e.g., supermarket chain H-E-B]). Page 108:
testing and lifestyle surveys, development of signature wellness
programs, making such programs “fun” (examples: Healthwise,
Lowes, SAS), maintaining high standards (e.g., Comporium, SAS).
Chapter 19 – Strategic Performance Measurement: Investment Centers
19–42
19-40 (Continued-2)
4. Accessibility—Page 109: “Convenience matters.” Focus on
eliminating reasons why employees would not take advantage of
programs and facilities.
5. Partnerships—both internal (e.g., with the Finance function, to vet
Chapter 19 – Strategic Performance Measurement: Investment Centers
19–43
19–41 ROI and Sustainability; Internet-Based Research (time varies)
1. Alternative definitions are possible. In his book Making Sustainability
Work: Best Practices in Managing and Measuring Corporate Social,
Environmental, and Economic Impacts (San Francisco, CA: Berrett-
Koehler Publishers, Inc., 2008) Marc Epstein defines corporate
sustainability (p. 19) as the integration of corporate social,
environmental, and economic impacts into day–to-day management
financial performance.” (emphasis in original)
2. This question is designed to motivate a connection in the student’s mind
between the “corporate sustainability” movement (or at least philosophy)
and the design of management accounting systems. Ideally, students
should mention topics covered elsewhere in the course, e.g., activity–
based costing (ABC), life-cycle costing, financial performance measures
Alternatively, or in conjunction with the above point, the instructor can
offer to students the following statement from Epstein (2008, p. 51),
which highlights a leading role that management accounting can play in
terms of supporting corporate sustainability programs and initiatives:
“An effective performance evaluation system (is needed) to integrate
economic, environmental, and social objectives and (to) reward the
19–44
19–41 (Continued-1)
3. Student answers (based on individual internet searchers conducted)
should differ. The purpose of this question is to motivate discussion
regarding the financial benefits of sustainability projects and programs,
which benefits can be impounded in traditional decision models such as
ROI and NPV. Following are some “talking points” or sample responses:
a. financial benefits associated with product/process designs: reduction
in water and energy usage; decreased cost of waste handling and
d. avoidance of loss sales, loss market share, and other negative
reputation effects such as diminished brand value, customer boycotts,
or protests (again, while determining the precise value here is
Chapter 19 – Strategic Performance Measurement: Investment Centers
19–45
4. Again, student answers will differ here. The main point is to have
students think of a broader set of evaluation criteria—both financial and
non-financial in nature—in terms of evaluating corporate sustainability
projects and programs. Presented below is a set of sample responses.
a. risk (social, environmental, and political) reduction
19–41 (Continued-1)
e. listing on the Dow Jones Sustainability Group Indexes
(http://www.sustainability-index.com/), the FTSE4Good Index Series
(http://www.ftse.com/Indices/FTSE4Good_Index_Series/index.jsp),
MSCI ESG Indices, which (according the following website) “are
designed to help clients incorporate environmental, social and
governance (ESG) factors into their investment decisions”
(http://www.msci.com/products/indices/thematic/esg/), or the
AccountAbility ratings provided by AccountAbility
(http://www.accountability.org/) (these ratings are designed to
measure the extent to which companies have integrated sustainability
into their business practices—ratings are based on scores in six
categories: three external drivers (public disclosure, assurance, and
stakeholder engagement) and three internal drivers (governance,
strategic intent, and performance measurement).