Chapter 19 – Strategic Performance Measurement: Investment Centers
19–16
19–29 Return on Investment (ROI) for Innovative Companies (30-45
minutes, including reading time)
The objective of this assignment is to engage the class in a discussion of
the limitation of return on investment (ROI) in the specified context. A key
question arises: how have these companies developed their innovative
process and products? If internally developed, then current GAAP requires
that the cost of developing these innovations will not be shown on the
balance sheet and therefore total assets and equity will be understated,
and returns based on the balance sheet numbers could be overstated.
Alternatively, if the firm acquired the innovation through purchasing a
effective management.
Source: Jena McGregor, “The World’s Most Innovative Companies,”
Business Week, April 24, 2006, pp. 76.
Chapter 19 – Strategic Performance Measurement: Investment Centers
19–17
19-30 Transfer Pricing Issues (15 minutes)
In order to provide an incentive for a supplying division to reduce costs,
the transfer pricing agreement should provide an incentive, such as:
1. The cost-based transfer price will not be reduced as a result of the
cost reduction for a given period, say for a period of six months to
Chapter 19 – Strategic Performance Measurement: Investment Centers
19–18
19–31 General Transfer-Pricing Rule (45 Minutes)
1. Transfer prices represent the amount that one division (subunit) of an
organization charges another division (subunit) of the organization for
services and products transferred internally.
Transfer prices serve the following roles:
a) They provide price data (i.e., inputs) for evaluating the financial
performance of profit centers and investment centers. In the
absence of such price information regarding internal exchanges,
rather than externally.
c) They provide the basis for increasing after-tax cash flow by (within
limits allowed by law) helping to minimize income-taxes (and, in an
2. The general transfer-pricing rule presented in the chapter is consistent
with the definition of “relevant costs,” to which students were exposed in
Chapter 11 of the text. That is, one specification of “relevant costs” is:
Out–of-Pocket Costs + Opportunity Costs. This general transfer-pricing
rule will generally reveal when an internal transfer should take place,
Chapter 19 – Strategic Performance Measurement: Investment Centers
19–19
19-31 (Continued-1)
In the current situation, we have:
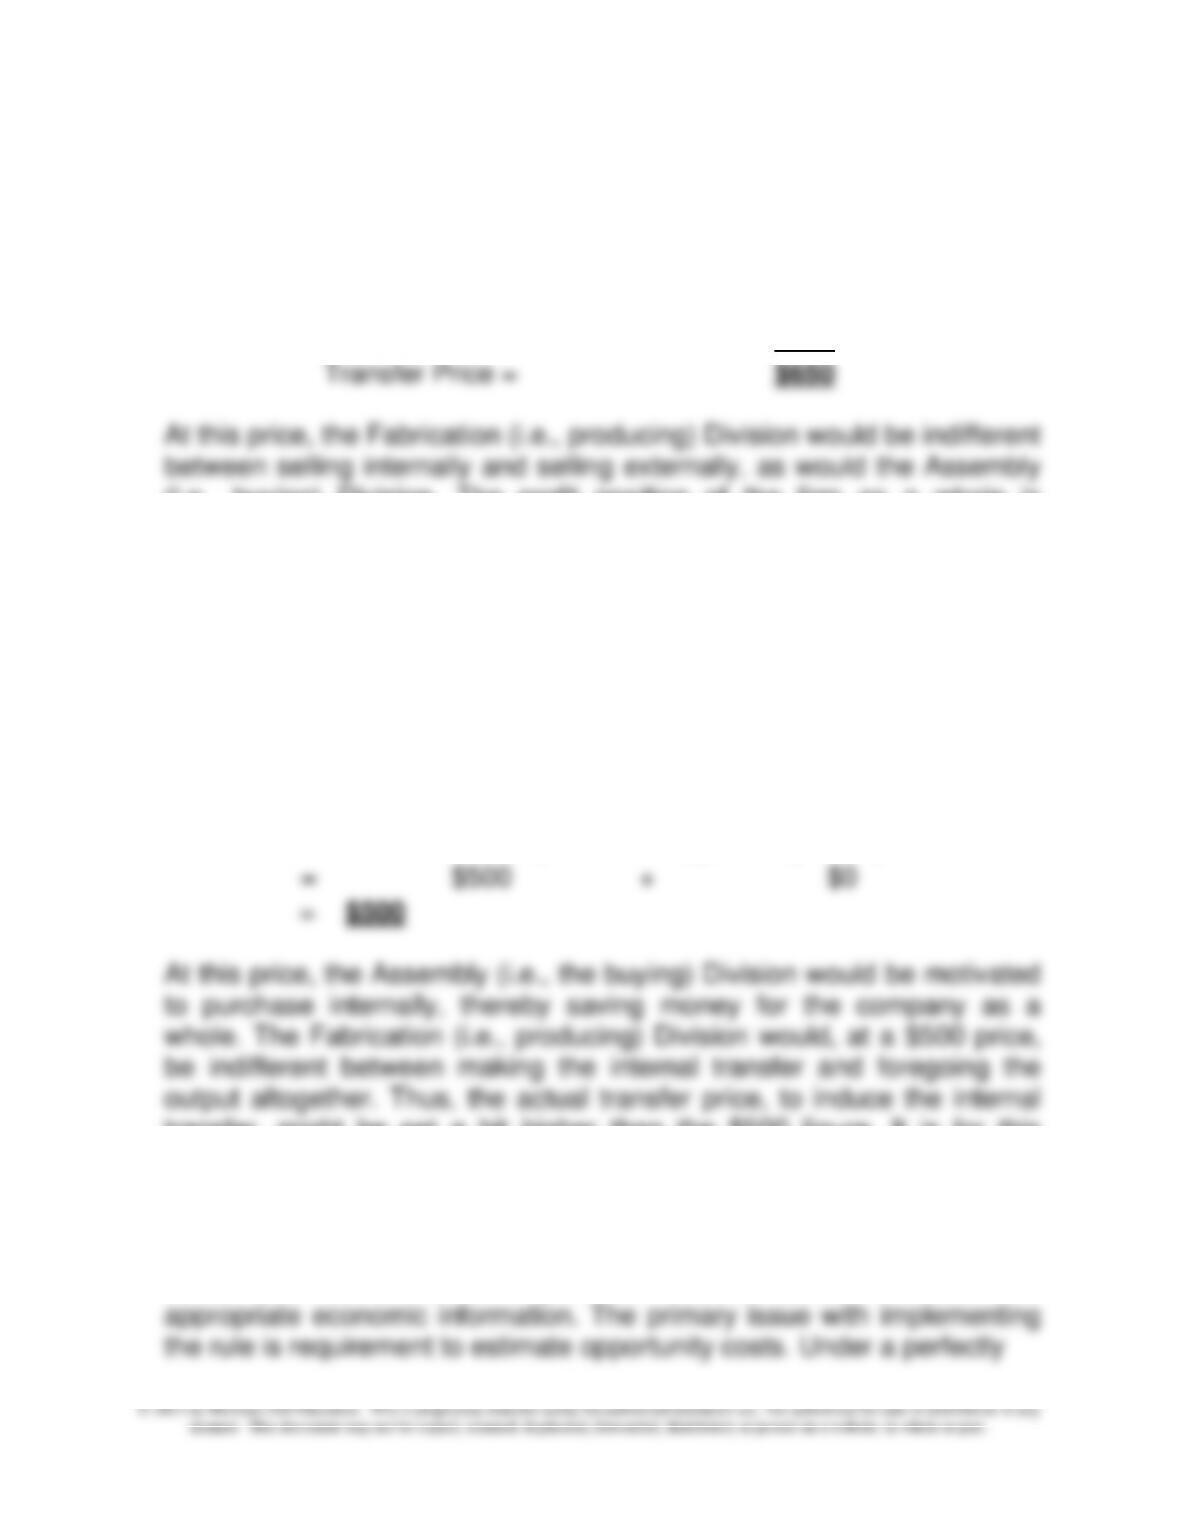
Transfer Price:
Incremental Cost per unit =
$500
Opportunity Cost per Unit = $650 – $500 =
$150
Transfer Price =
$650
At this price, the Fabrication (i.e., producing) Division would be indifferent
between selling internally and selling externally, as would the Assembly
(i.e., buying) Division. The profit position of the firm as a whole is
unaffected by the local decisions of the two divisional managers. Thus,
the use of this transfer-pricing rule (a) maintained divisional autonomy,
and (b) provided the appropriate “signal” to internal decision-makers (i.e.,
buyers and sellers).
3. If the Fabrication (i.e., producing) Division had excess capacity, this
means that the opportunity cost associated with any internal transfers
would be zero. Thus, the transfer price, as specified by the general
transfer-pricing rule, would be:
Transfer Price = Incremental Cost per Unit + Opportunity Cost per Unit
= $500 + $0
= $500
transfer, might be set a bit higher than the $500 figure. It is for this
situation that we state that the general transfer-pricing rule provides the
minimum transfer price, from the selling division’s standpoint.
4. As might be expected, the general transfer-pricing rule “works” in the
sense that as a model it provides internal decision-makers with
Chapter 19 – Strategic Performance Measurement: Investment Centers
19–20
19-31 (Continued-2)
competitive market (as was assumed in this assignment), this may not be
much of a problem. However, under other market conditions, we know
that demand is partly a function of the quantity sold, both internally and
externally. (In other words, there are demand interactions that complicate
our efforts to estimate an opportunity cost associated with internal
transfers.) Further, implementing the general rule may be impossible (or,
Chapter 19 – Strategic Performance Measurement: Investment Centers
19–21
19–32 Transfer Pricing; Decision-Making (25 minutes)
1. Division A’s purchase decision from the overall firm perspective:
Purchase costs from outside 10,000 ×$150 = $1,500,000
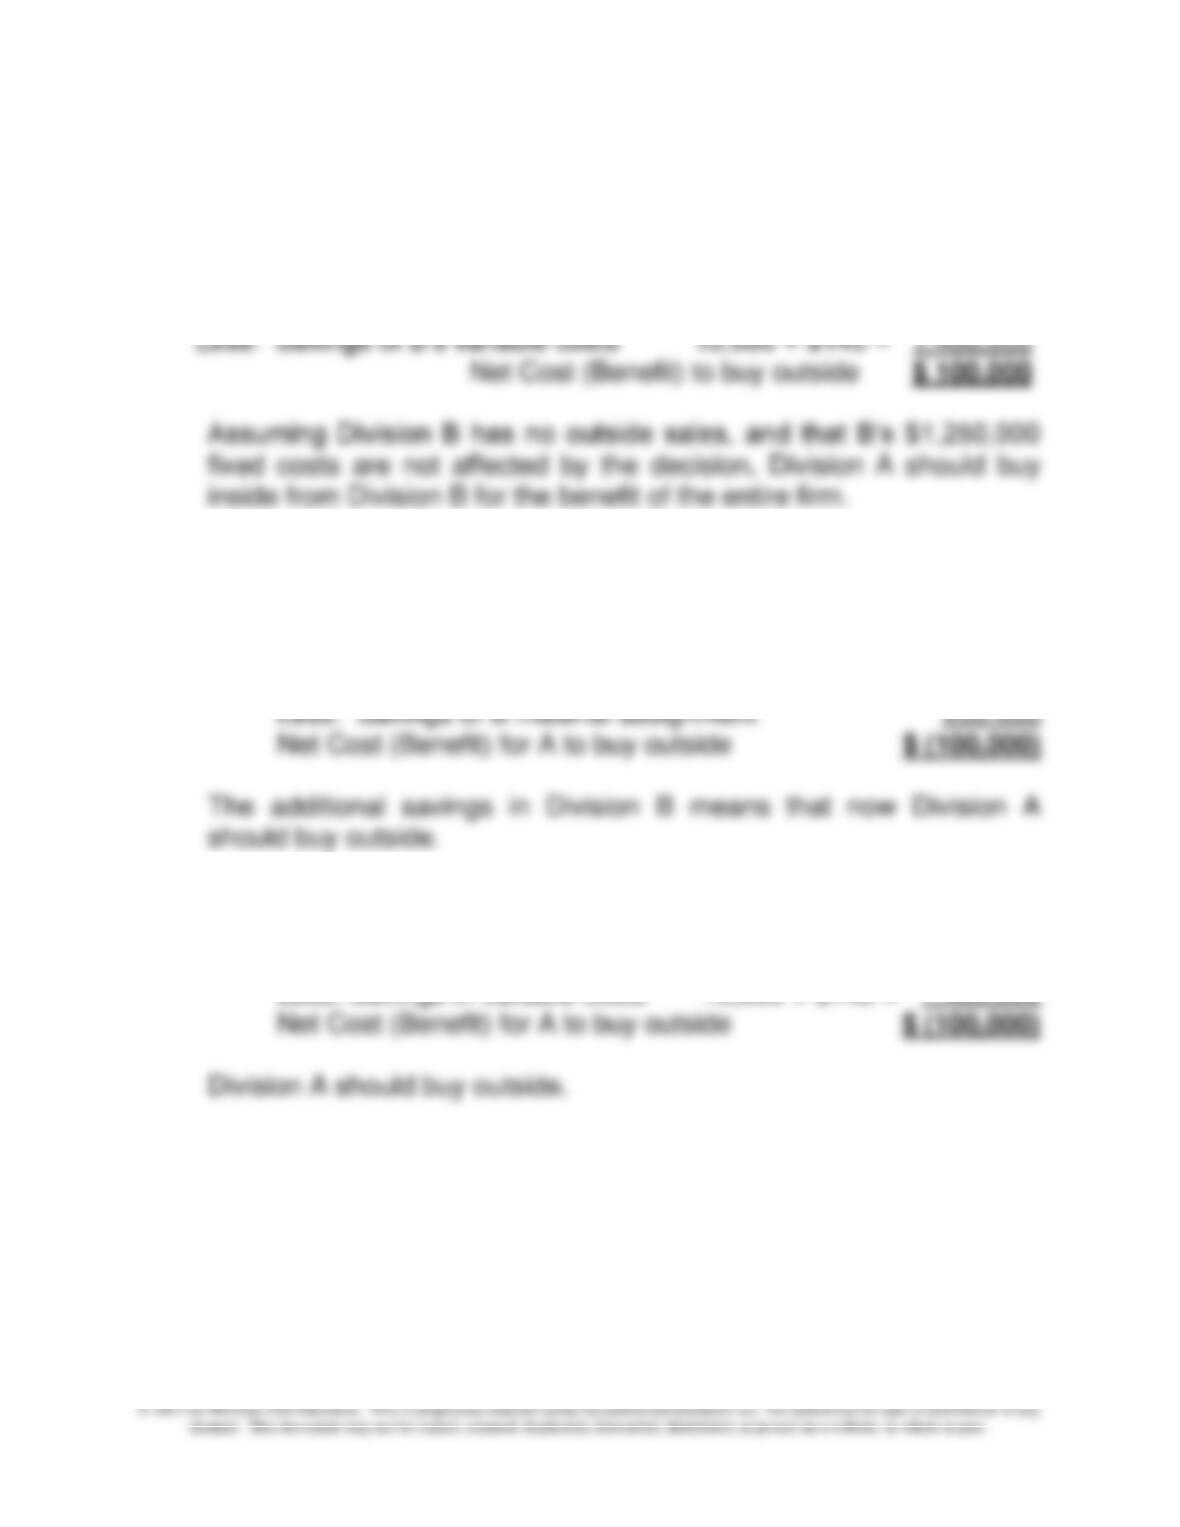
2. As above, but in addition, if Division A buys outside, Division B saves
an additional $200,000:
Purchase costs from outside 10,000 × $150 = $1,500,000
Less: Savings in variable costs 10,000 × $140 = 1,400,000
3. Assuming the outside price drops from $150 to $130:
Purchase costs from outside 10,000 × $130 = $1,300,000
Less: Savings in variable costs 10,000 × $140 = 1,400,000
Chapter 19 – Strategic Performance Measurement: Investment Centers
19–22
19–32 (continued)
A
O/S
P=200
P=150
19–23
P=215
V=150
19–33 Transfer Pricing; Decision-Making (20 minutes)
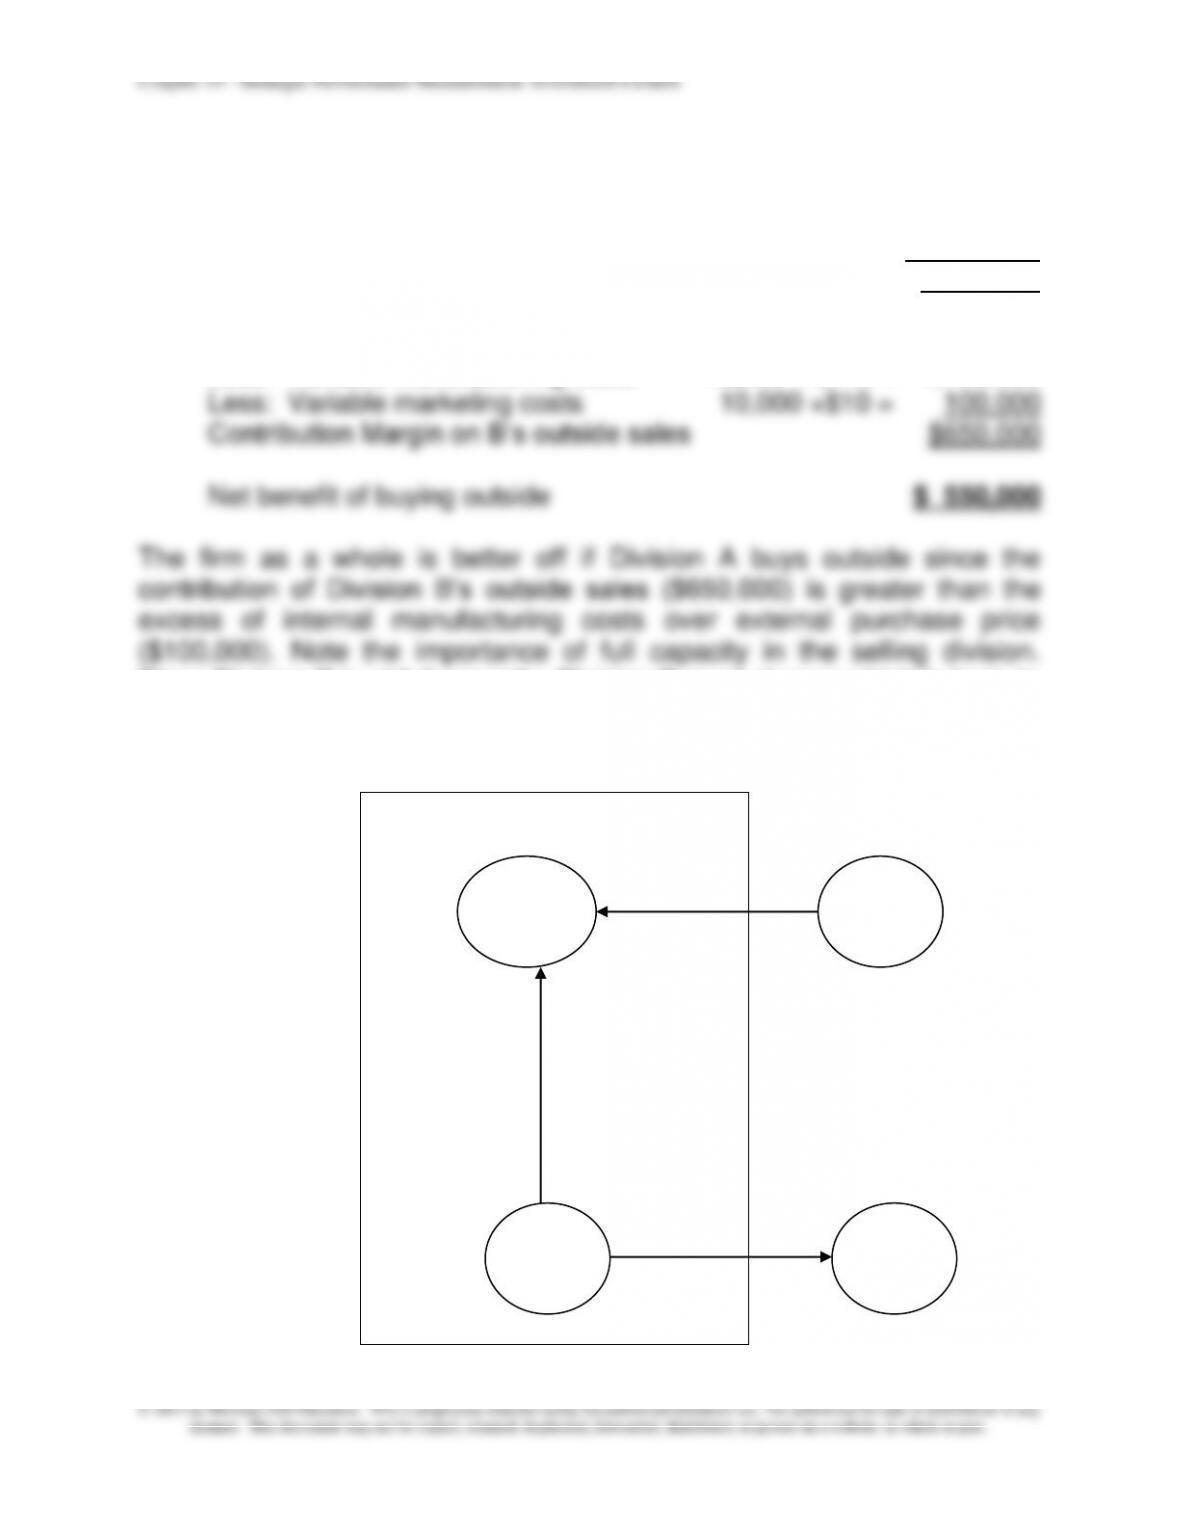
Purchase costs from outside 10,000 × $150 = $1,500,000
Less: Savings in variable costs 10,000 × $140 = 1,400,000
Net Cost (Benefit) of External Purchase $ 100,000
B sales to other customers 10,000 × $215 = $2,150,000
Less: Variable manufacturing costs 10,000 × $140 = 1,400,000
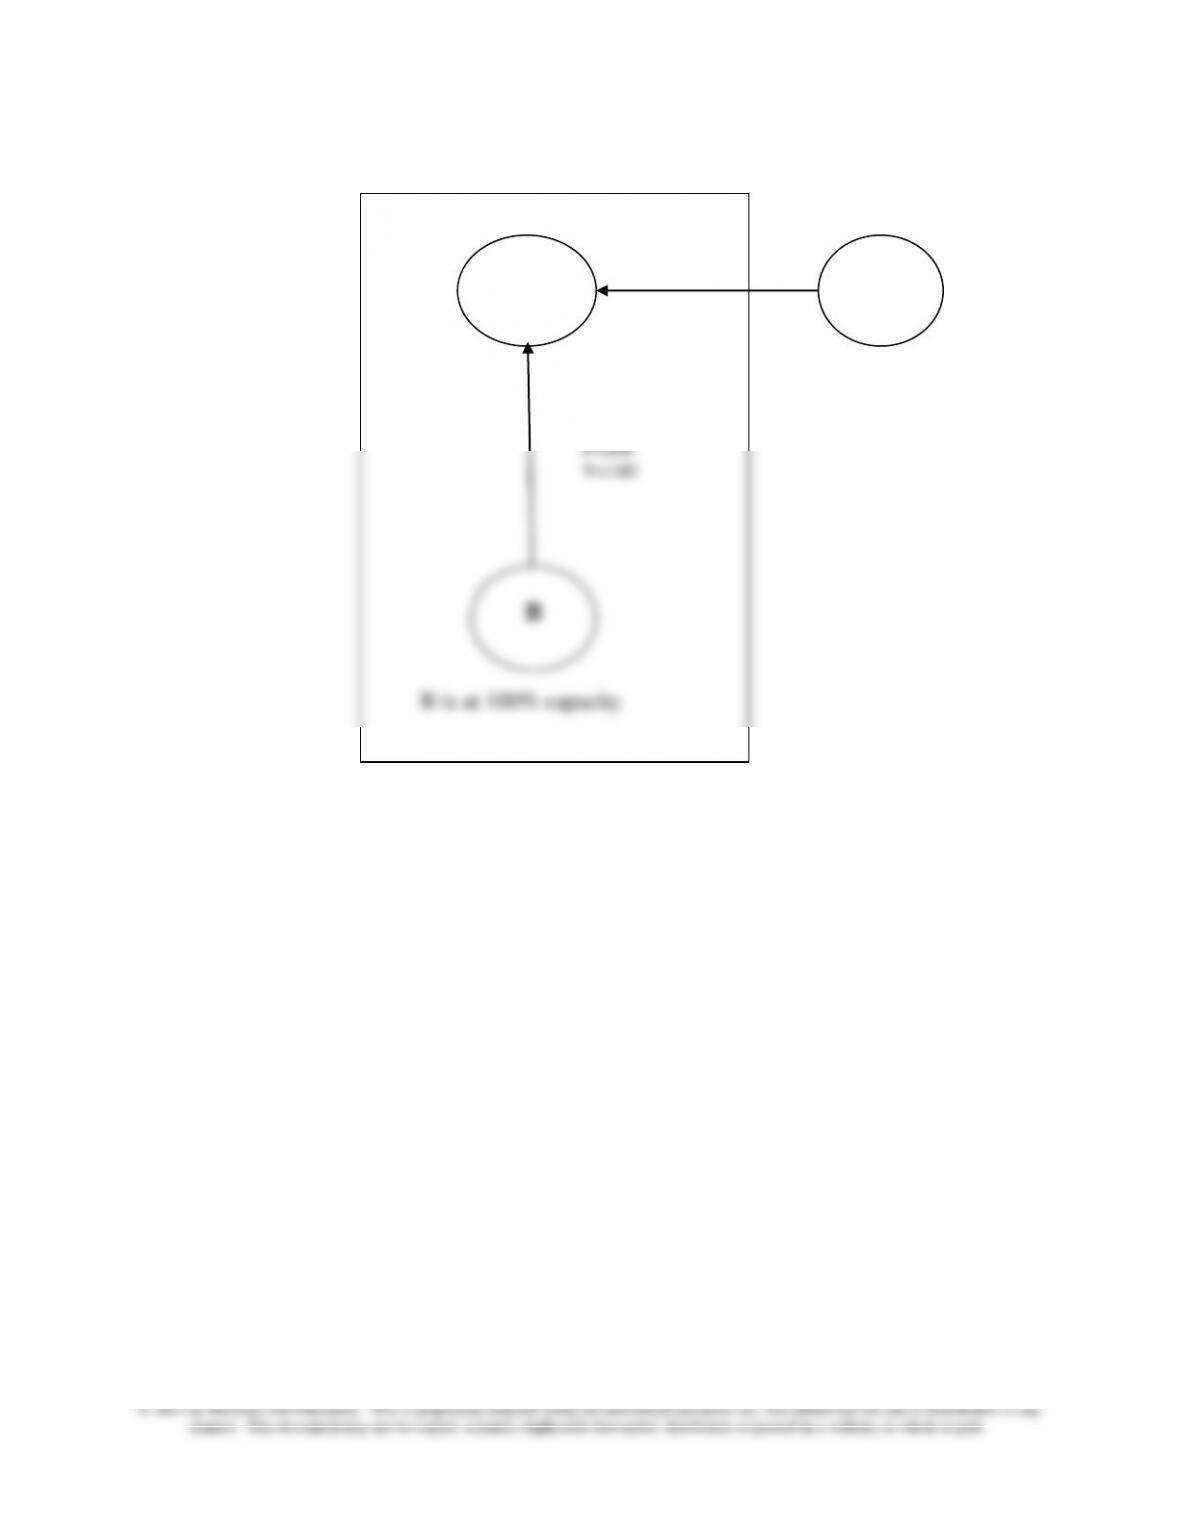
Since Division B is at full capacity, Division B must choose which is best, to
sell inside or outside. If there were sufficient excess capacity, Division B
could do both.
A
B
O/S
O/S
P=200
V=140
P=150
Chapter 19 – Strategic Performance Measurement: Investment Centers
19–24
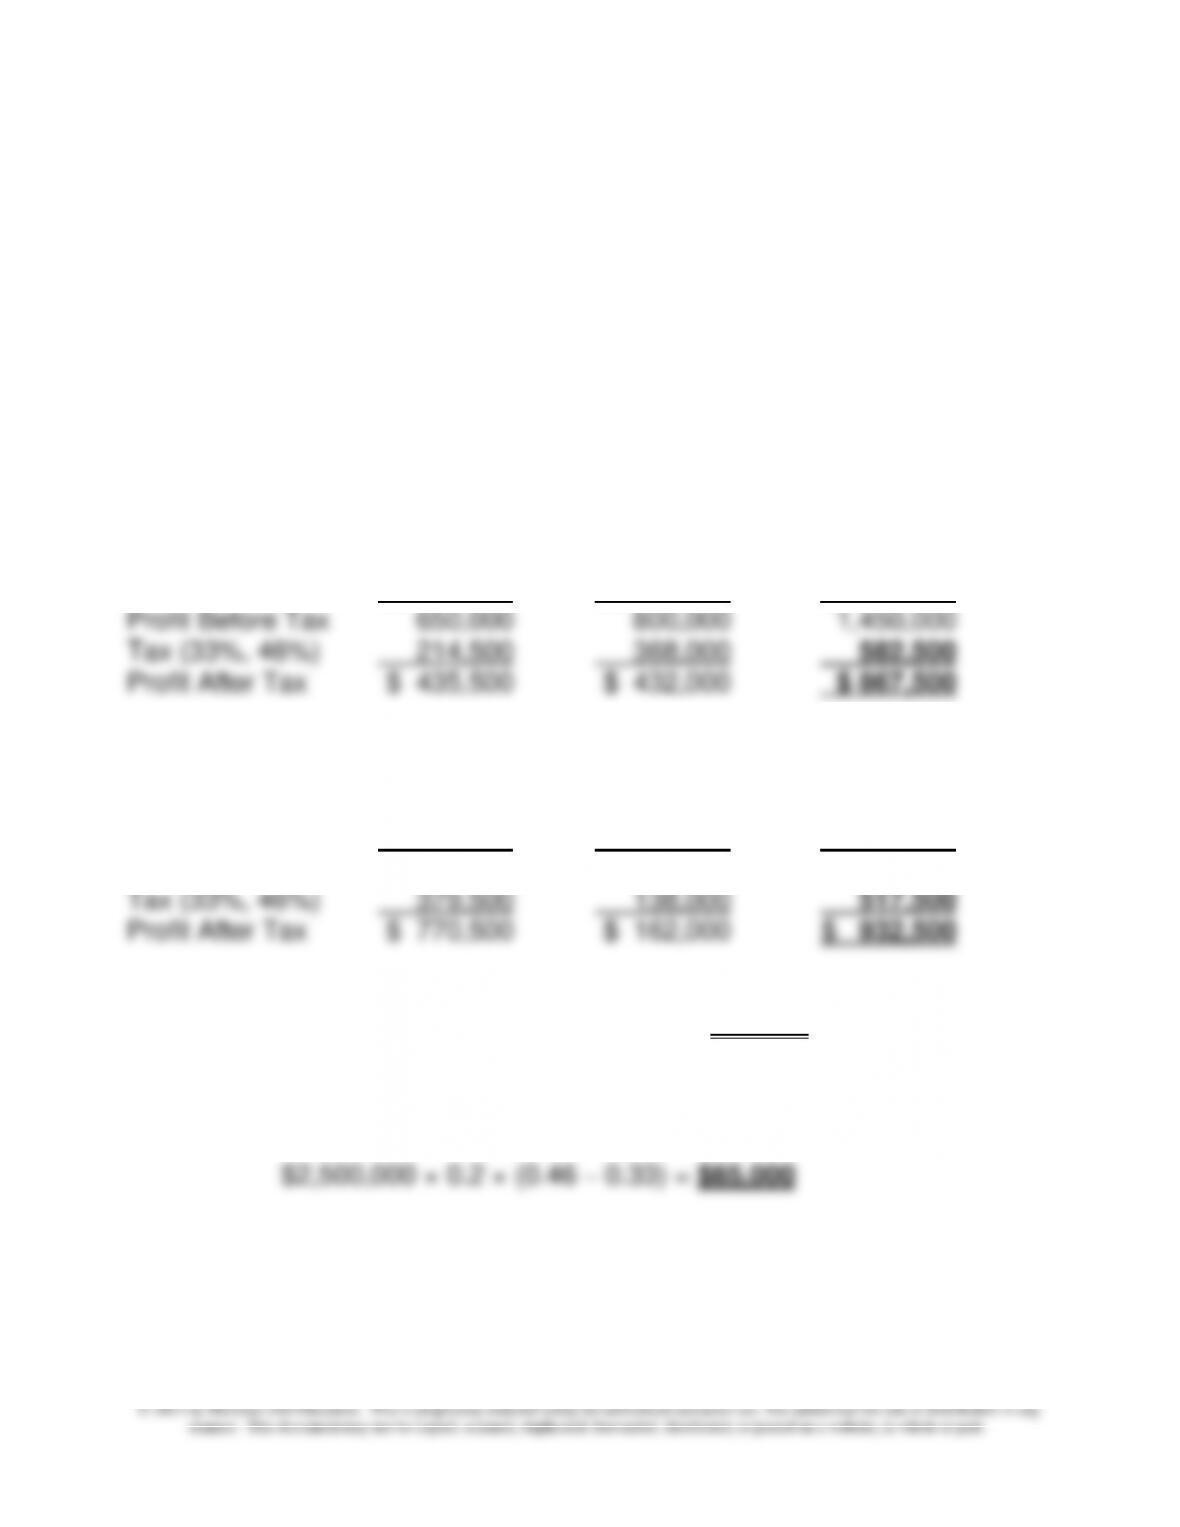
19-34 Transfer Pricing; International Taxation (20-25 minutes)
The change in transfer price would increase the profitability of the
foreign subsidiary where taxes are lower and reduce the profitability of
the U.S. subsidiary, where taxes are higher. The net effect would be a
reduction of total corporate taxes of $65,000 ($932,500 − $867,500).
The following exhibit summarizes the analysis.
Singapore
Subsidiary
United States
Subsidiary
Total
INCOME PRIOR TO INCREASE IN TRANSFER PRICE
Revenues
$2,500,000
$3,500,000
$6,000,000
Direct Costs
1,500,000
2,500,000
4,000,000
Other Costs
350,000
200,000
550,000
Profit Before Tax
650,000
800,000
1,450,000
Tax (33%, 46%)
214,500
368,000
582,500
Profit After Tax
$ 435,500
$ 432,000
$ 867,500
INCOME AFTER INCREASE IN TRANSFER PRICE
Revenues
$3,000,000
$3,500,000
$6,500,000
Direct Costs
1,500,000
3,000,000
4,500,000
Other Costs
350,000
200,000
550,000
Profit Before Tax
1,150,000
300,000
1,450,000
Tax (33%, 46%)
379,500
138,000
517,500
Profit After Tax
$ 770,500
$ 162,000
$ 932,500
The difference in after-tax profit = difference in total income tax
expense = $932,500 – $867,500 = $65,000 (or, $582,500 –
$517,500)
Note: An equivalent short-cut calculation would be:
Chapter 19 – Strategic Performance Measurement: Investment Centers
19–25
PROBLEMS
19–35 ROI; Different Measures for Total Assets (45-60 minutes)
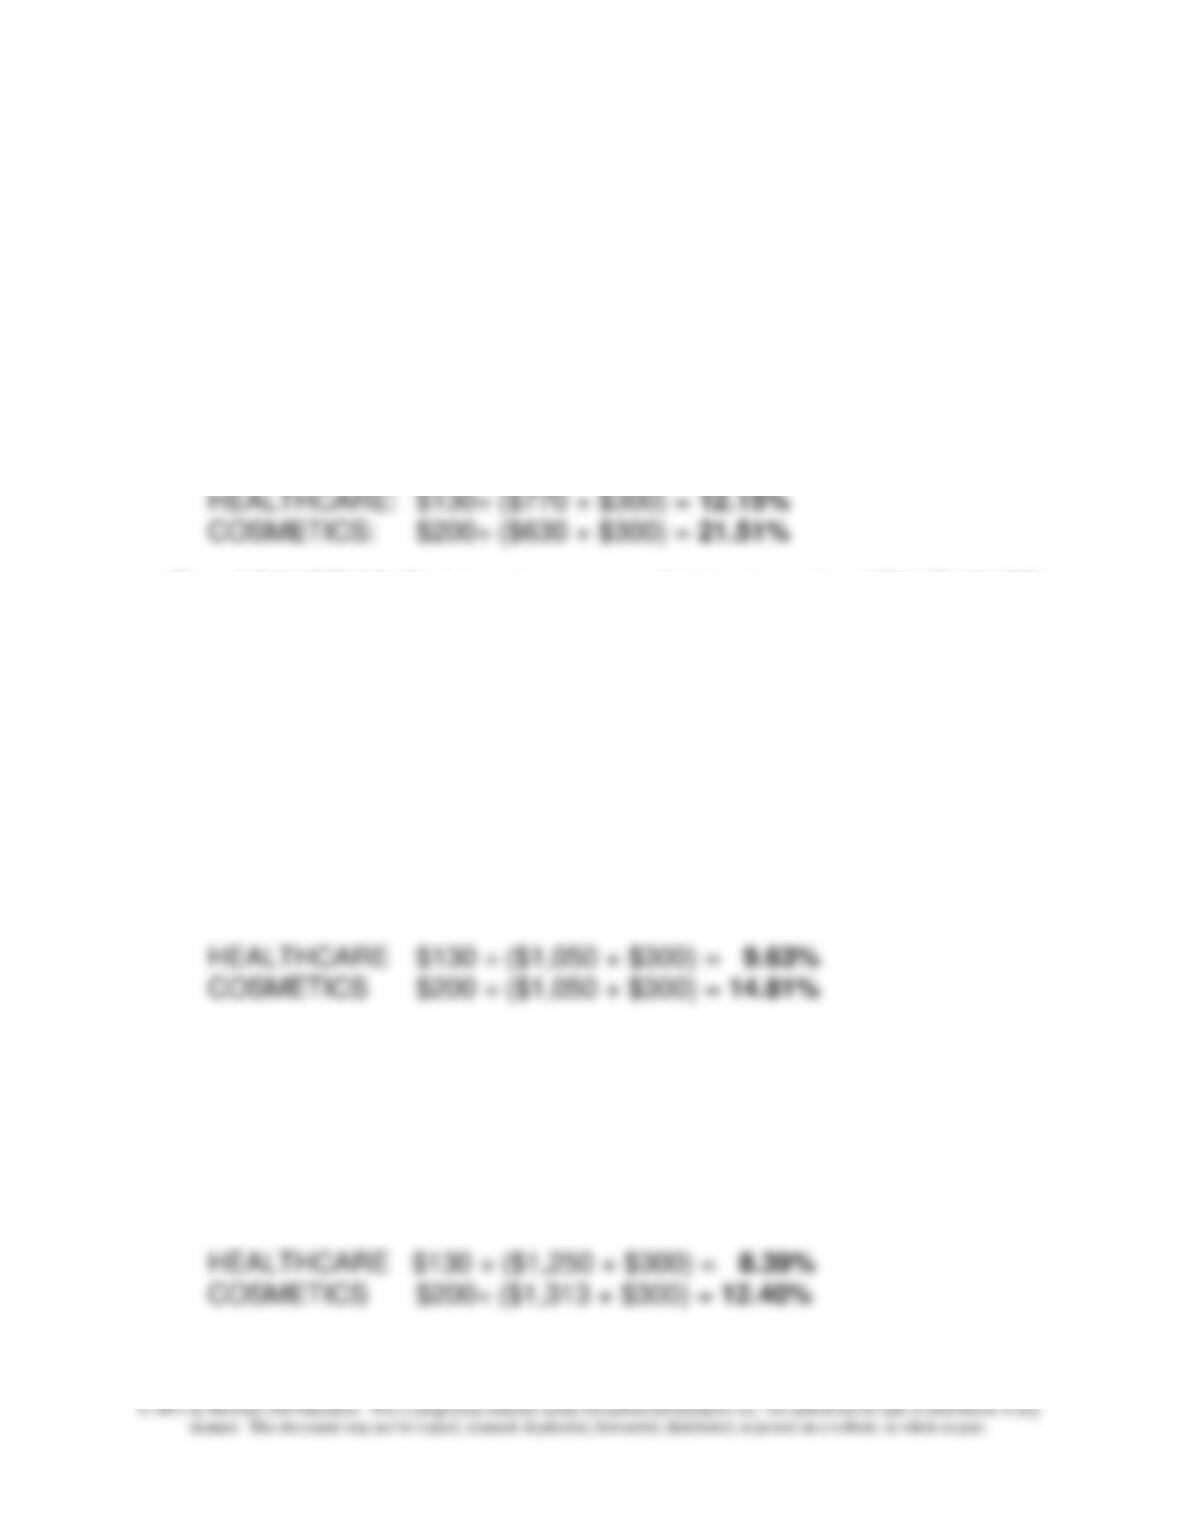
1. Net book value (NBV) of fixed assets for each division (000s):
HEALTHCARE: $70 × 11 years remaining useful life = $770
COSMETICS: $70 × 9 years remaining useful life = $630
ROI using historical cost of divisional assets:
The COSMETICS Division is more profitable than the HEALTHCARE
Division, based on ROI calculated using net book value (NBV) of
divisional fixed assets (plus the current balance sheet value of current
assets).
2. a.
Gross Book Value (GBV) for each division:
HEALTHCARE 15 × $70 = $1,050 (Depreciation ×useful life)
COSMETICS 15 × $70 = $1,050
ROI:
b. (GBV at historical cost) × (construction cost index in 2013 ÷
construction cost in year of construction):
HEALTHCARE $1,050 × (100 ÷ 84) = $1,250
COSMETICS $1,050 × (100 ÷ 80) = $1,313
ROI:
Chapter 19 – Strategic Performance Measurement: Investment Centers
19–26
19–35 (continued-1)
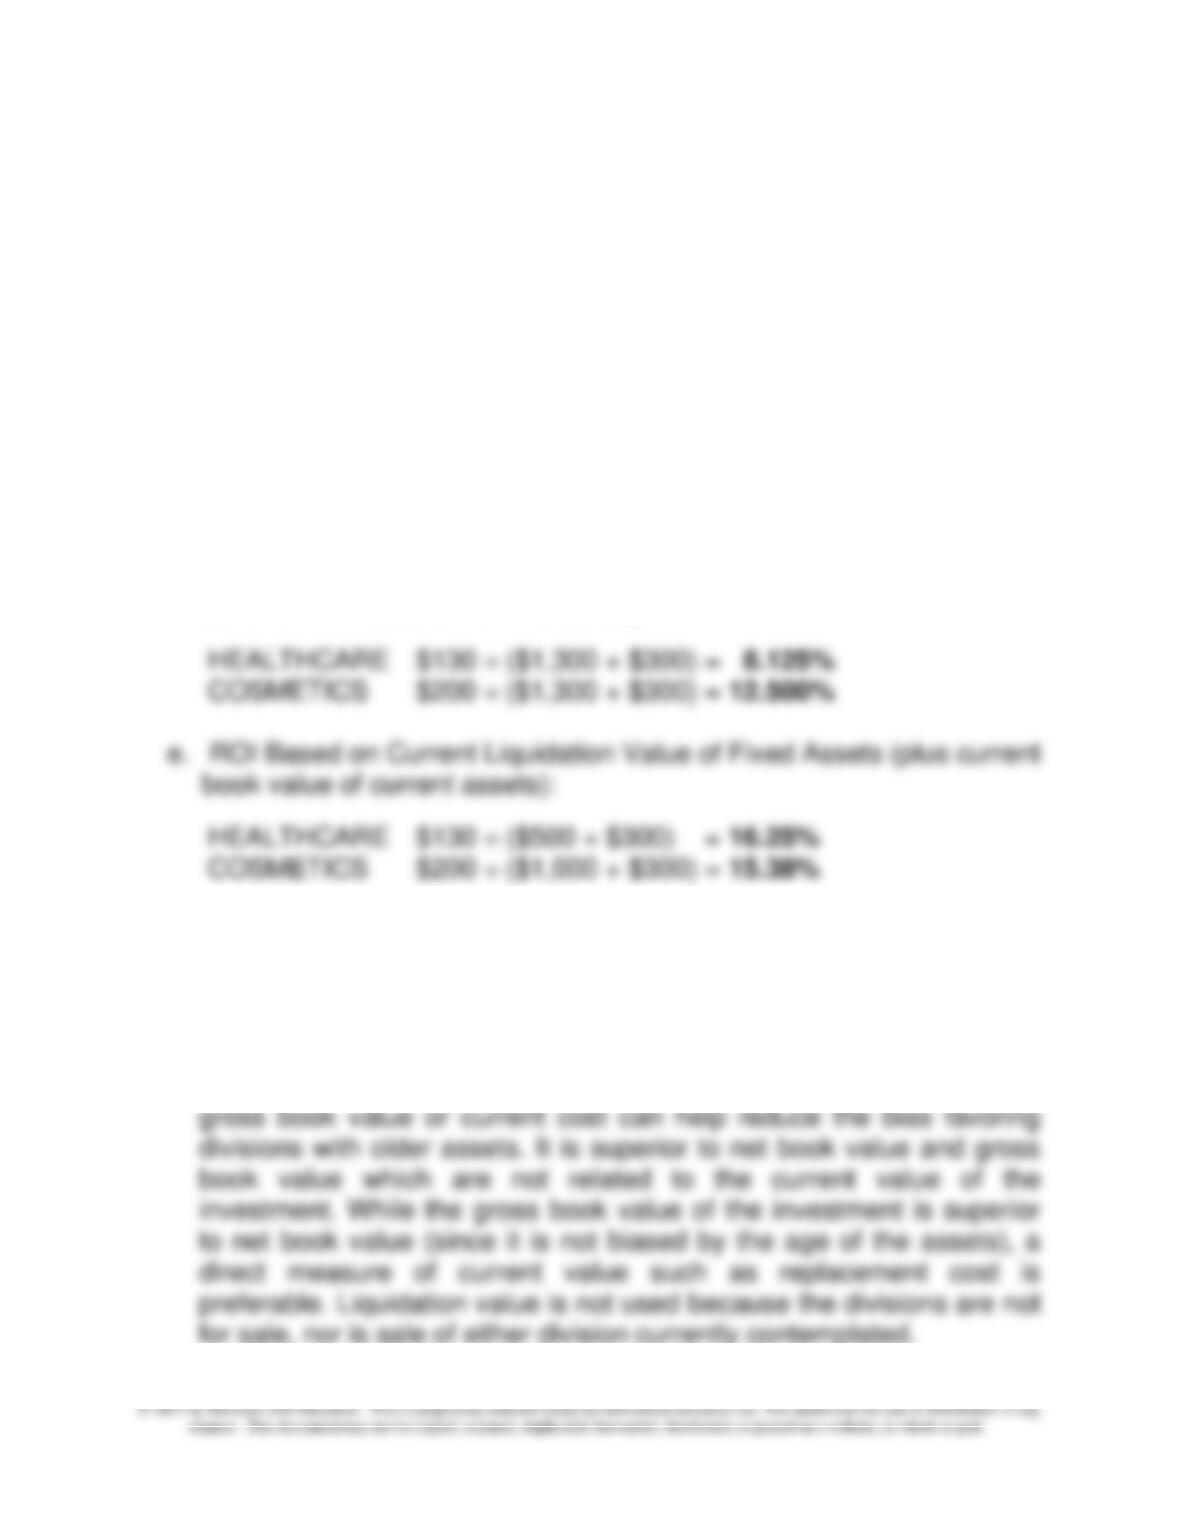
c. (Current NBV of fixed assets) ×(construction cost index in 2013 ÷
construction cost in year of construction)
HEALTHCARE $770 × (100 ÷ 84) = $917
COSMETICS $630 × (100 ÷ 80) = $788
ROI:
HEALTHCARE $130 ÷ ($917 + $300) = 10.68%
COSMETICS $200 ÷ ($788 + $300) = 18.38%
d. ROI Based on Current Replacement Cost of Fixed Assets (plus
current book value of current assets):
3. a. The best measure for evaluating the manager is replacement cost, as
it corresponds to the “going–concern” value of the investment. The
objective is to identify a measure of investment that fairly reflects the
productive capacity of the assets. Often, net book value falls much
faster than the productive capability of the assets, and thus, the ROI
with the older assets overstates the profitability of the unit. The use of
Chapter 19 – Strategic Performance Measurement: Investment Centers
19–27
19–35 (continued-2)
The advantages of the replacement cost measure are fairness, since
it avoids the age bias issues associated with the net book value
measure, and motivation, since it reflects the current value of the
asset and therefore what investment value the manager has to work
extremely high.
b. The evaluation of the division should use replacement cost for the
same reasons as explained in (a) above. The only difference here is
when either division might be sold or relocated, in which case the
Chapter 19 – Strategic Performance Measurement: Investment Centers
19–28
19–36 ROI and Incentive/Goal-Congruency Issues; Spreadsheet
Application (60-75 Minutes)
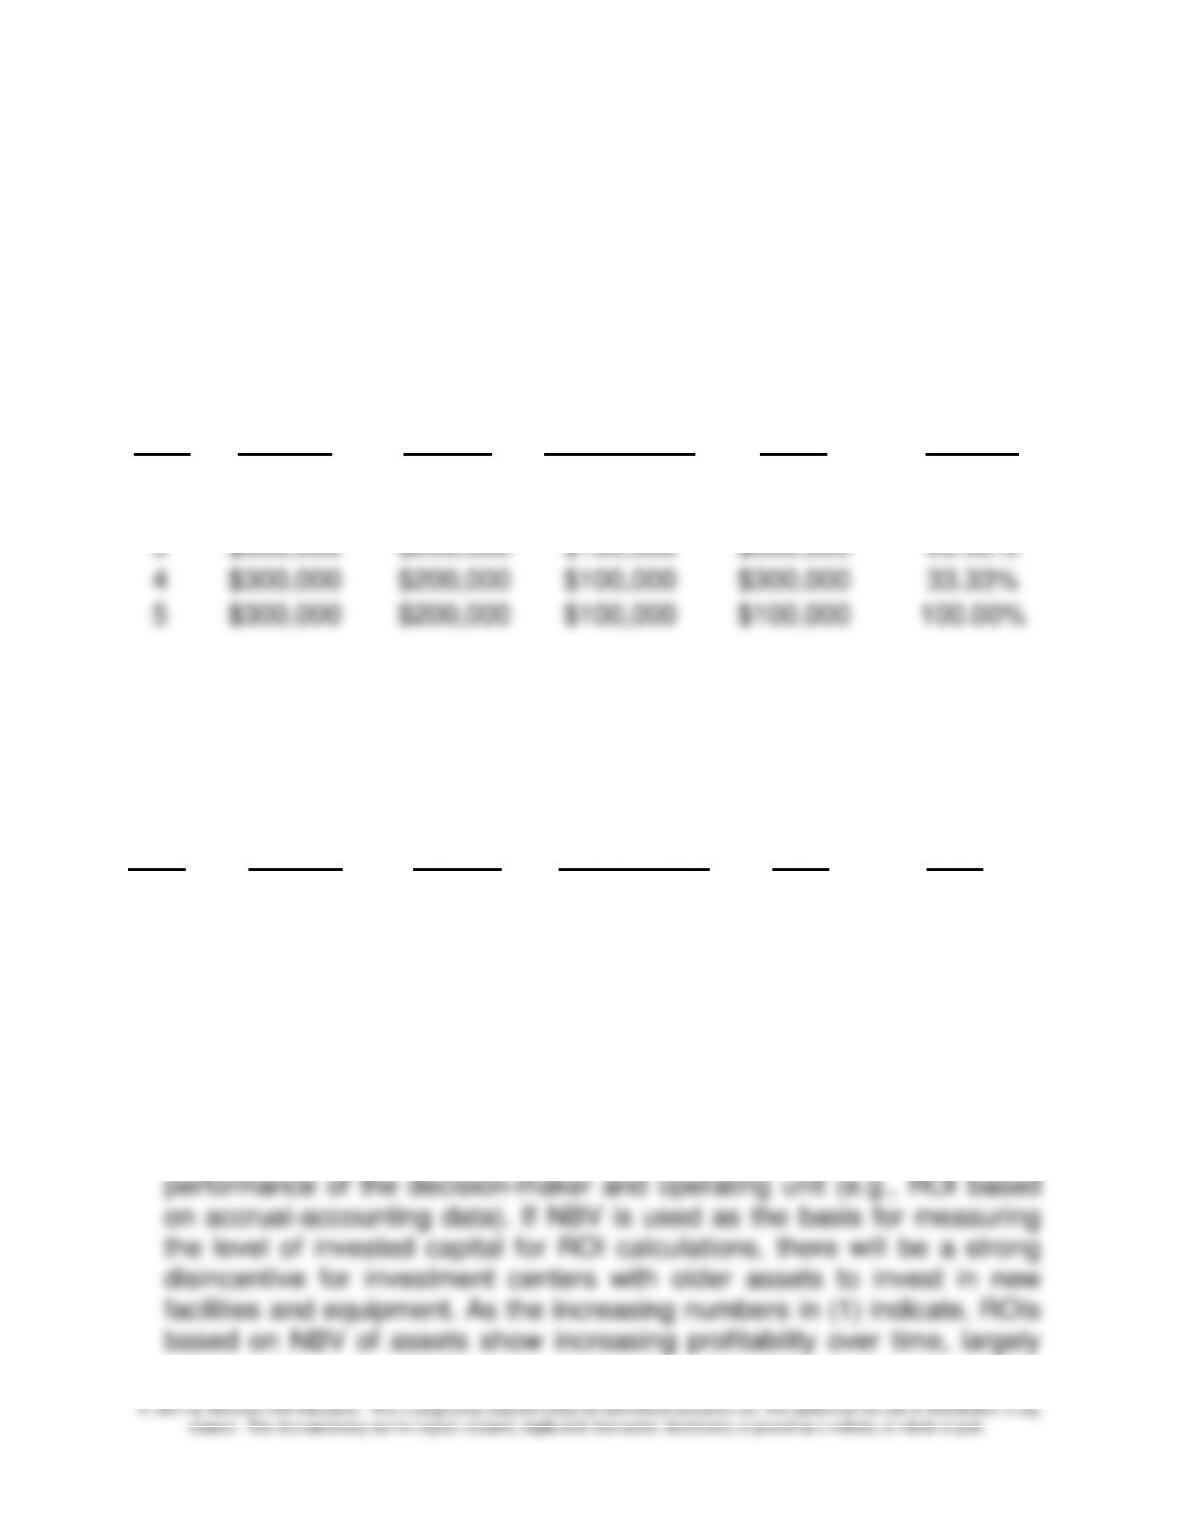
1. Year-by-Year ROIs, based on average NBV of investment:
Year
Income
Prior to
Deprec.
Depreciation
Charge
Operating
Income
After
Depreciation
Average
NBV of
Asset
ROI Based
on NBV
1
$300,000
$200,000
$100,000
$900,000
11.11%
2
$300,000
$200,000
$100,000
$700,000
14.29%
3
$300,000
$200,000
$100,000
$500,000
20.00%
4
$300,000
$200,000
$100,000
$300,000
33.33%
5
$300,000
$200,000
$100,000
$100,000
100.00%
2. Year-by-Year ROIs, based on average gross book value(GBV) of
investment:
Year
Income
Prior to
Deprec.
Depreciation
Charge
Operating
Income
After
Depreciation
Average
GBV
ROI
Based on
GBV
1
$300,000
$200,000
$100,000
$1,000,000
10.00%
2
$300,000
$200,000
$100,000
$1,000,000
10.00%
3
$300,000
$200,000
$100,000
$1,000,000
10.00%
4
$300,000
$200,000
$100,000
$1,000,000
10.00%
5
$300,000
$200,000
$100,000
$1,000,000
10.00%
3.This question deals with the incentives effects of using one method for
making long-term investment decisions (DCF, as discussed in Chapter
12) and a different method for evaluating the subsequent financial
Chapter 19 – Strategic Performance Measurement: Investment Centers
19–29
because of a reduced denominator in the ROI calculation. In short, the
use of NBVs produces a misleading increase in ROIs over time,
19–36 (Continued-1)
regardless of whether true (economic) profitability is changing. This
negative incentive effect can, to some extent, be ameliorated through the
use of gross book values when measuring the investment base in the
ROI calculation.
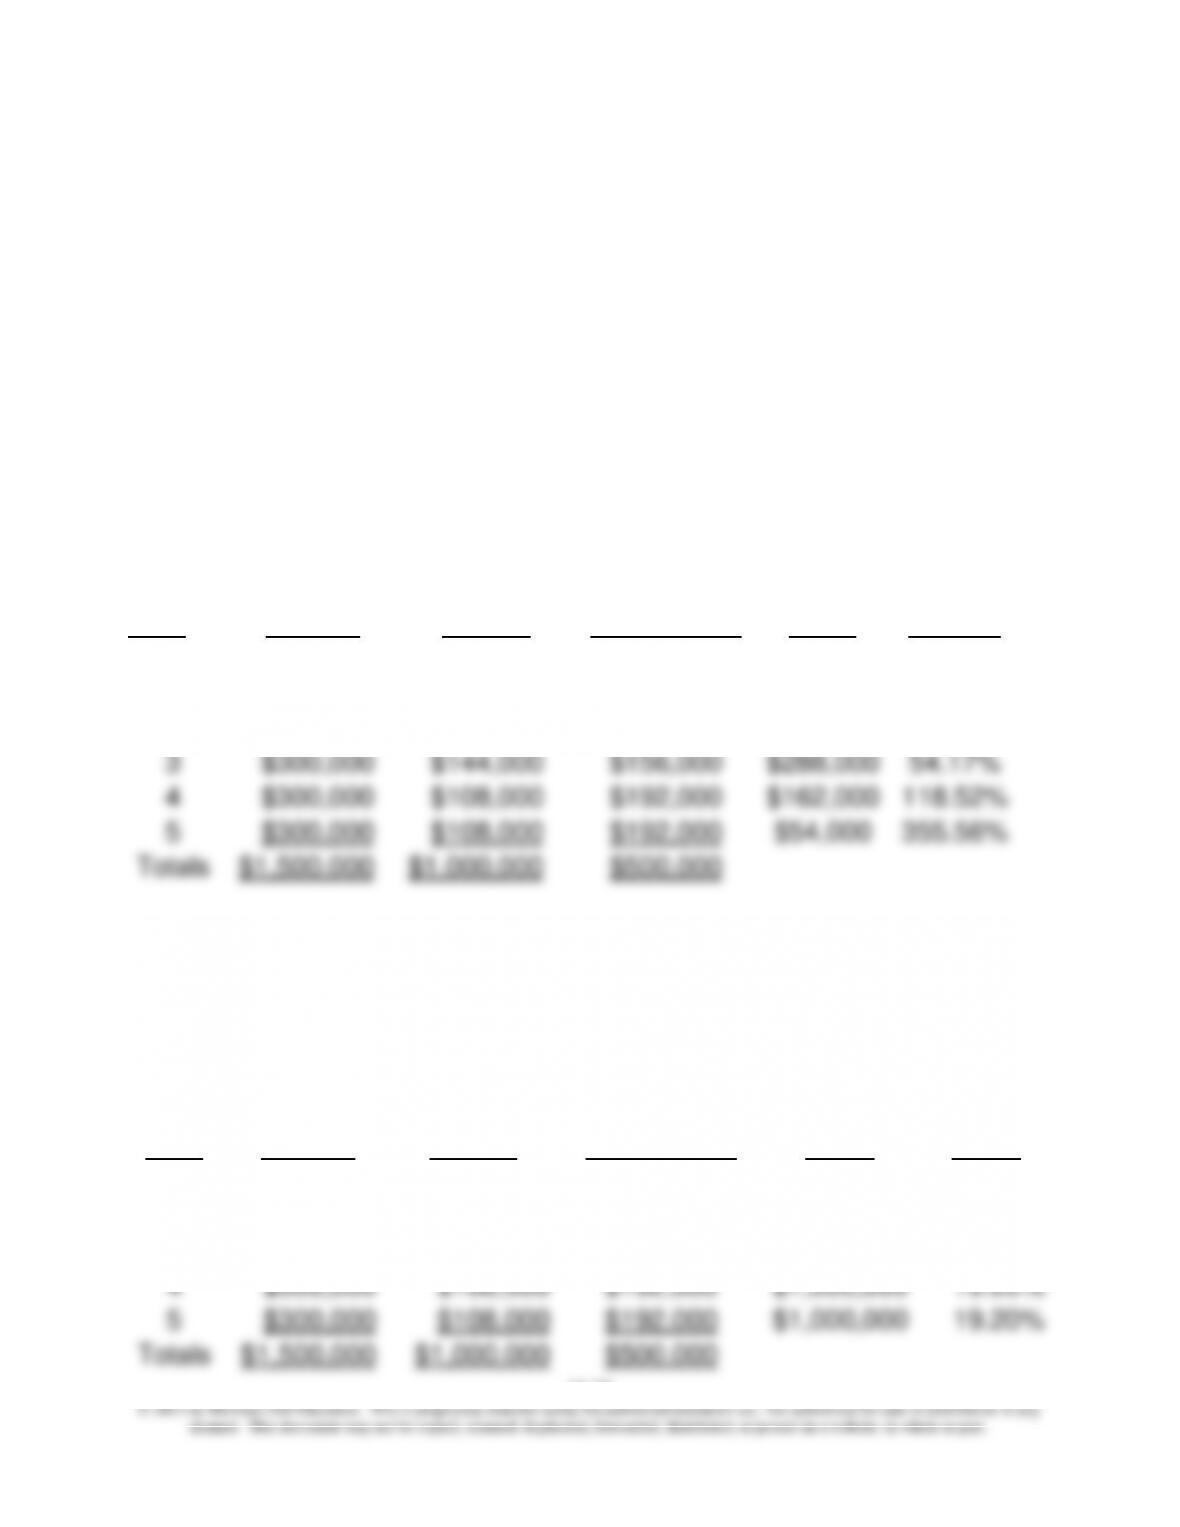
4. Year-by-Year ROIs, based on average NBV of the investment and
accelerated (DDB) depreciation, with a switch to SL depreciation in year
4:
Year
Income
Prior to
Deprec.
DDB
Depreciation
Charge
Operating
Income After
Depreciation
Average
NBV of
Asset
ROI
Based
on NBV
0
1
$300,000
$400,000
($100,000)
$800,000
(12.50%)
2
$300,000
$240,000
$60,000
$480,000
12.50%
3
$300,000
$144,000
$156,000
$288,000
54.17%
4
$300,000
$108,000
$192,000
$162,000
118.52%
5
$300,000
$108,000
$192,000
$54,000
355.56%
Totals
$1,500,000
$1,000,000
$500,000
Year–by-year ROIs, based on GBV of the investment and DDB depreciation
(with a switch to SL depreciation in year 4):
Year
Income
Prior to
Deprec.
DDB
Depreciation
Charge
Operating
Income After
Depreciation
Average
Gross
Book
Value
ROI
Based on
Gross
Book
Value
1
$300,000
$400,000
($100,000)
$1,000,000
(10.00%)
2
$300,000
$240,000
$60,000
$1,000,000
6.00%
3
$300,000
$144,000
$156,000
$1,000,000
15.60%
4
$300,000
$108,000
$192,000
$1,000,000
19.20%
5
$300,000
$108,000
$192,000
$1,000,000
19.20%
Totals
$1,500,000
$1,000,000
$500,000
Chapter 19 – Strategic Performance Measurement: Investment Centers
19–30
19–36 (Continued-2)
Summary: the above results demonstrate that the bias associated with
the use of NBV versus GBV of the asset (investment) base is even more
pronounced if an accelerated depreciation method (such as DDB) is
used. This is because the rate of decrease in the denominator of the
ROI calculation is decreasing more rapidly.
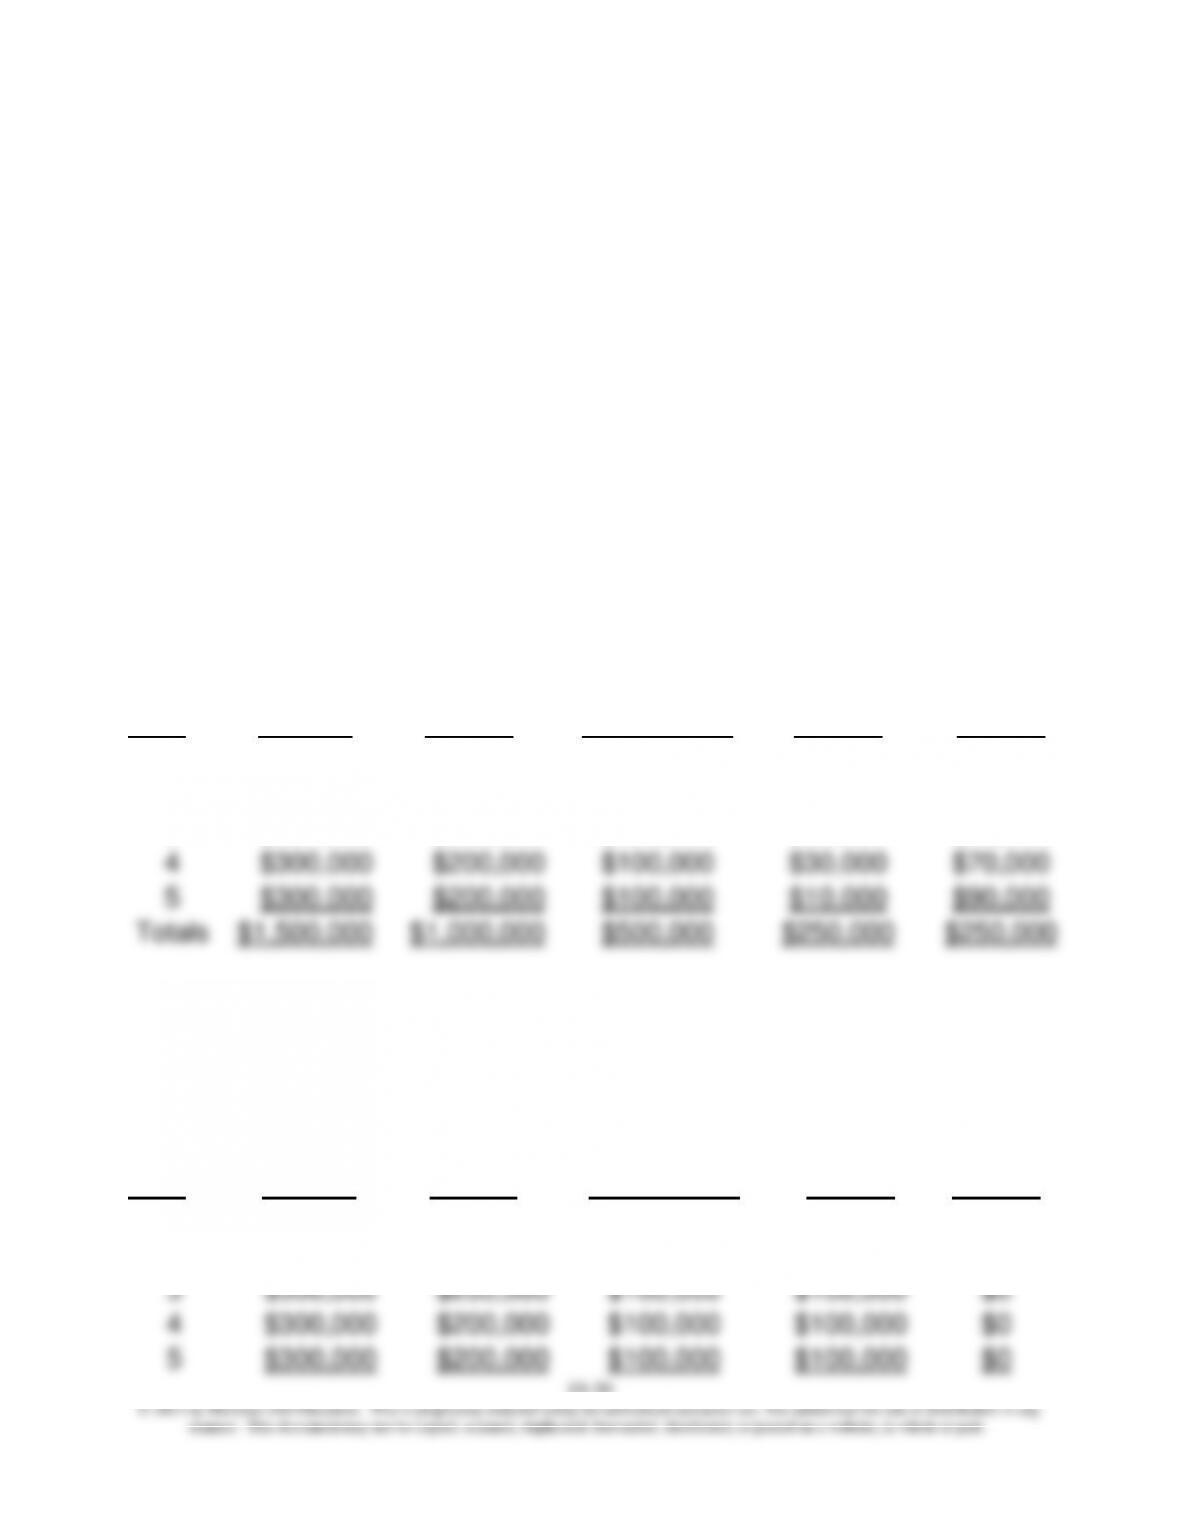
5. Year-by-Year Financial Results: Residual Income (RI)
a. Using average NBV of long-lived asset as the investment base, and SL
depreciation (per requirement 1 above):
Income
Operating
Income
Less:
Imputed
Year
Prior to
Deprec.
Depreciation
Charge
After
Depreciation
Capital
Charge
Residual
Income
1
$300,000
$200,000
$100,000
$90,000
$10,000
2
$300,000
$200,000
$100,000
$70,000
$30,000
3
$300,000
$200,000
$100,000
$50,000
$50,000
4
$300,000
$200,000
$100,000
$30,000
$70,000
5
$300,000
$200,000
$100,000
$10,000
$90,000
Totals
$1,500,000
$1,000,000
$500,000
$250,000
$250,000
b. Using GBV of long-lived assets as the investment base, and SL
depreciation (per requirement 2 above):
Income
Operating
Income
Less:
Imputed
Year
Prior to
Deprec.
Depreciation
Charge
After
Depreciation
Capital
Charge
Residual
Income
1
$300,000
$200,000
$100,000
$100,000
$0
2
$300,000
$200,000
$100,000
$100,000
$0
3
$300,000
$200,000
$100,000
$100,000
$0
4
$300,000
$200,000
$100,000
$100,000
$0
5
$300,000
$200,000
$100,000
$100,000
$0