
Chapter 19 – Strategic Performance Measurement: Investment Centers
19-1
Chapter 19
Strategic Performance Measurement: Investment Centers
Teaching Notes for Cases
Case 19-1: Investment Centers
1. The prior performance measurement system was called “performance income,” and is best described as
a profit center method. The focus was on divisional profits.
2. The new system called “asset management,” is best described as an investment-center method. The
system is focused on return on investment (ROI), as described in the case, where it is called “return on
capital.” The advantage of the investment-center approach is that it focuses managers’ attention on the
management of assets. Also, it brings managers’ incentives in line with that of the entire firm, to increase
the ROI of the firm.
The change to an investment center is consistent with Polymer’s new strategy, which is to
withdraw from activities, which do not fit the overall firm’s competitive advantage. The investment-
center approach is useful here to identify those units where the profitability is marginal, since the firm
wishes to focus on the most profitable units, and divest or consolidate the others. ROI provides a useful
basis to make this analysis. Thus, choosing investment centers is consistent with the present competitive
strategy.
ROI is often the desired performance measure in firms such as Polymer, where the activities are
diverse and complex, and comparison among the activities is difficult.
3. A common view is that foreign exchange gains and losses are a non-controllable element that should be
excluded from the manager’s evaluation. In contrast, many now view the manager’s responsibility more
broadly and urge that foreign exchange can be managed. The potential for exchange rate losses can be
managed by hedging, that is, purchasing financial instruments, which protect the firm from significant
swings in currencies. A common argument is that the firm is in the business of making and selling
products and services, and the management of foreign exchange can be delegated to financial service
firms, banks, etc., which will provide the desired hedging. The cost of hedging is small relative to the
potential losses.
Also, managers can adapt to foreign exchange changes by relocating manufacturing and other
activities over the longer term. Overall, the firm should be watchful of what individual managers are
doing to adapt to foreign exchange changes, both favorable and unfavorable. For this reason, it is
desirable to include foreign exchange gains and losses in the manager’s performance evaluation, as
Polymer Products is doing.
Income taxes, like foreign exchange, are often viewed as uncontrollable to the manager.
However, this overlooks the fact that the manager can often take steps to reduce taxes, by relocating
operations and changing sources of supply, etc. Thus, in a manner similar to that of foreign exchange
noted above, it is desirable for income taxes to be also included in the manager’s performance evaluation.
This places the appropriate incentive for the manager to reduce taxes for the benefit of the firm as a
whole.
A common problem with both profit centers and investment centers is that the performance
measures promote short-term decision making. In this case, Polymer Products has adopted a
“performance shares” approach. This is described in the next to last paragraph of the case: “...stock which
is accessible only after 3 years…” Performance shares are a type of deferred income in which the
compensation to the manager depends on the success of certain critical financial and non-financial
measures over a period of time (see Chapter 20 for a discussion of this method). In effect, Polymer

Chapter 19 – Strategic Performance Measurement: Investment Centers
19-2
Products has recognized the inherent bias to the short-term in the ROI measure, and is using performance
shares to provide an incentive for longer term thinking and action by the managers.
Case 19-2: Transfer Pricing
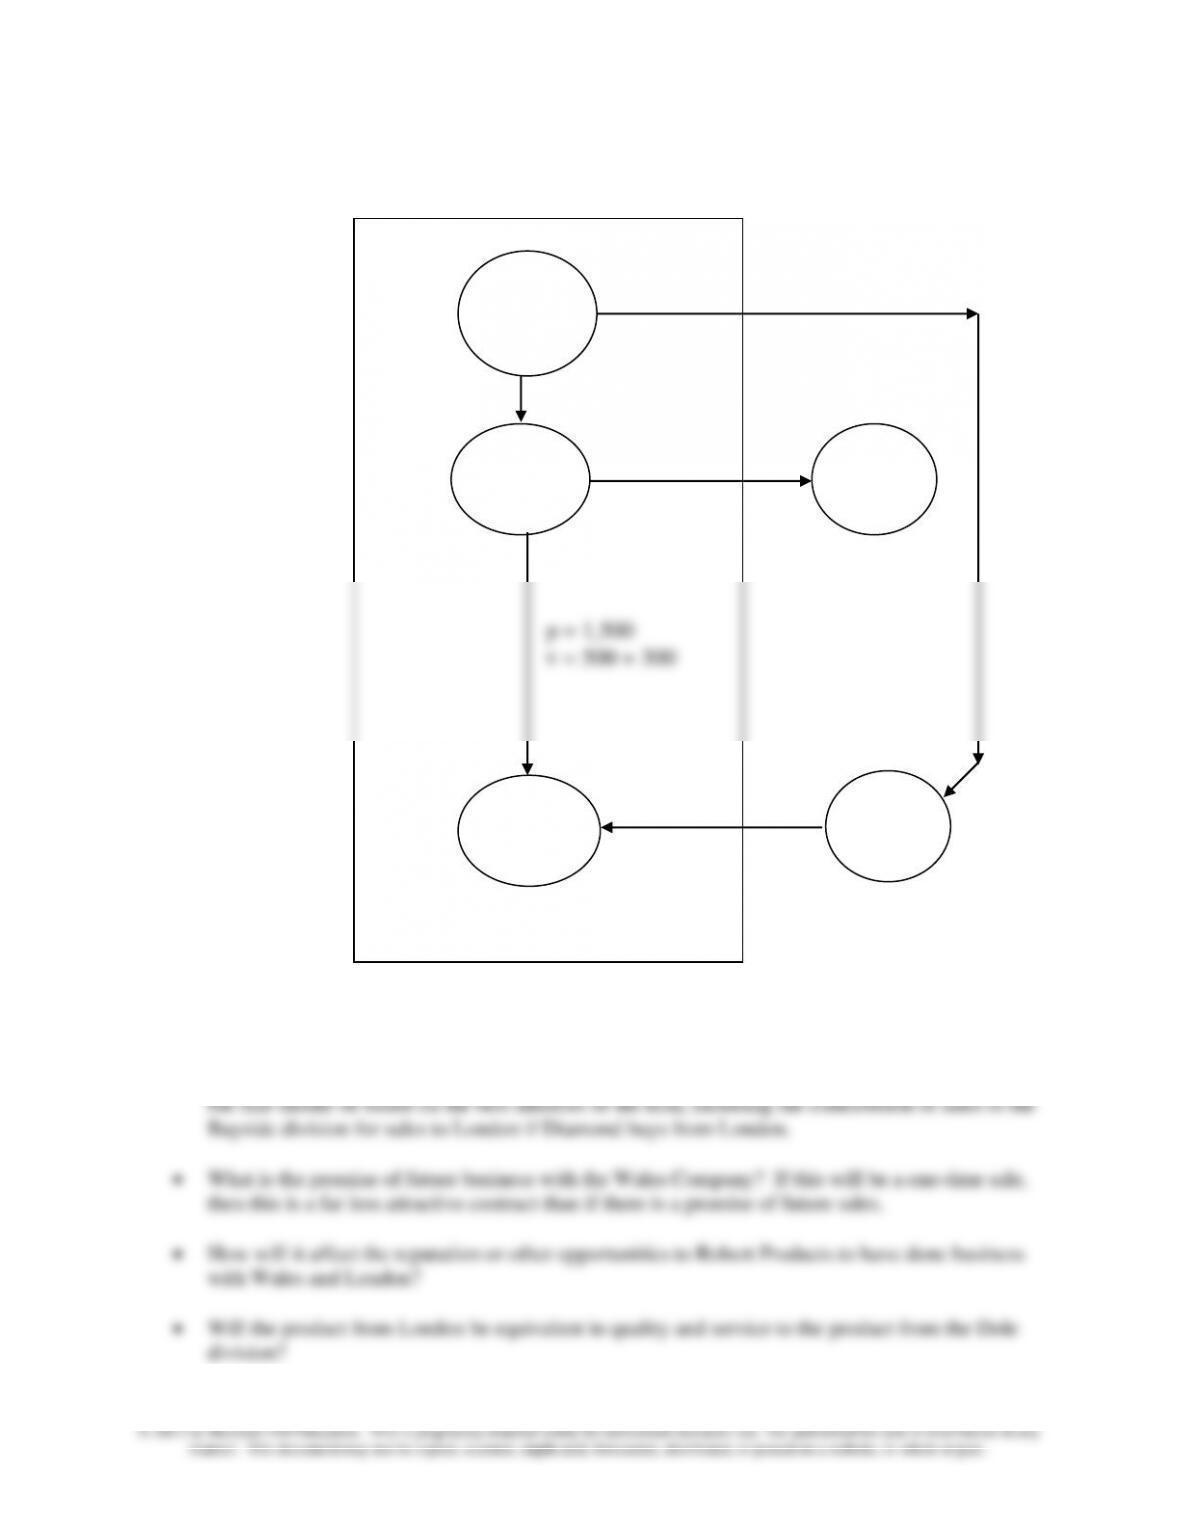
1. In order to maximize short-run contribution margin, the Cole Division should accept the contract from
Wales Company. This conclusion is supported by the following calculations ($000‘s omitted throughout
the calculations.). See graphic below which shows product flows, prices and variable costs to assist in
understanding the analysis.
From the Cole Division Point of view
a. Cole transfers to Diamond
Transfer price: Cole to Diamond
(3,000 units @ $1,500 each) $4,500
Variable cost:
Purchase from Bayside
(3,000 units @ $600 each) $1,800
Processing by Cole
(3,000 units @ $500 each) 1,500
Total variable cost 3,300
Contribution margin $1,200
b. Cole accepts Wales contract
Selling Price (3,500 units @ $1,250 each) $4,375
Variable cost:
Purchase from Bayside
(3,500 units @ $500 each) $1,750
Processing by Cole
(3,500 units @ $400 each) 1,400
Total variable cost 3,150
Contribution margin $1,225
Conclusion for the Cole Division
Contribution margin from Wales contract $1,225
Contribution margin from Diamond sale 1,200
Difference in favor of Wales contract $ 25

Chapter 19 – Strategic Performance Measurement: Investment Centers
19-3
From the point of view of the cost to the entire company:
a. Cole transfers to Diamond
Variable cost
Bayside
(3,000 units @ $300 each) $900
Cole
(3,000 units @ $500 each) 1,500
Total variable cost $2,400
b. Cole accepts Wales contract; then the following shows the three parts to the calculation, including
the opportunity cost of lost contribution to Bayside and Cole:
1. Contribution of Wales Contract to Cole
Selling Price (3,500 units @ $1,250 each) $4,375
Variable cost:
Purchase from Bayside
(3,500 units @ $250 each) $875
Processing by Cole
(3,500 units @ $400 each) 1,400
Total variable cost 2,275
Contribution to Cole $2,100
2. Plus: Contribution of London Contract to Bayside
Selling Price (3,000 × $400) $1,200
Variable Cost (3,000 × $200) 600
Contribution to Bayside $600
3. Less: Cost of outside purchase to Diamond
Selling price to Diamond: (3,000 × $1,500) $4,500
Net Cost to the company of the Wales contract to Cole
= $4,500 – $600 – $2,100 $1,800
Conclusion for the Entire Company; Relevant Costs
Cole Transfers to Diamond $2,400
Cole Sells to Wales 1,800
Difference favoring the Wales Contract $ 600
It appears that the solution is to have Cole Division accept the Wales contract, either from the division’s
or the company’s point of view, though the calculations differ considerably. From the firm’s point of
view, the Wales contract is a lot more attractive than it is to the Cole Division ($600 versus $25).
Chapter 19 – Strategic Performance Measurement: Investment Centers
19-4
2. The strategic issues Robert Products should consider include:
• Is the structure of the transfer pricing system set properly so that division managers choose what
is in the best interests of the firm? In this case, Cole Division should choose the Wales contract,
London
p = 1,500
Cole
Diamond
Bayside
Wales
p = 400
v = 200
p = 1,250
v = 250 + 400

Chapter 19 – Strategic Performance Measurement: Investment Centers
19-5
Case 19-3: Transfer Pricing (Foreign Sales Corporations)
1. A wide variety of responses are likely for this case exercise, depending on the depth of the student’s
research. There are a number of useful references on Foreign Sales Corporations (FSCs), one of which is
noted in the case assignment. Also, two recent articles in Business Week are useful: “This Tax Break
Could Trigger a War,” by Paul Magnusson, September 4, 2000, p.103 and “U.S. Exporters Get the Word:
Guilty,” by Paul Magnusson, August 16, 1999, p. 42.
Note: The status of FSCs was under active consideration within the U.S. Congress at the time
(April 2001) this case was written, it is possible that the matter might have been settled by the
time the case is assigned. If the matter has been settled, then the nature of the assignment should
shift to an understanding and critique of the nature of the settlement or legal change that was
enacted, including the expected effects on U.S. exporters and the firms with which they compete
globally.
2. We would expect students to address at least a number of the following issues (in no particular order):
a) The ethical issue: should U.S. exporters have what appears to be an unfair advantage in
international trade?
b) The legal issue: are FSCs in conflict with international law?
c) Have FSCs accomplished the goal set in 1971 when the law establishing FSCs was enacted?
Some say the law was enacted to narrow the U.S. trade gap at the time, but the trade gap has
continued to grow.
d) Who most benefits from FSCs and who is most adversely affected, and why? The group most
helped by FSCs are the U.S. exporters such as Boeing and Kodak while competitors in the
EU (European Union) are hurt because they do not have access to the favorable tax treatment.
e) What are the impacts of FSCs in monetary terms? Business Week reports tax savings to U.S.
corporations of approximately $2.3 billion in 1992.
f) What is the outlook for FSCs in the future?

Chapter 19 – Strategic Performance Measurement: Investment Centers
19-6
Case 19-4: Interior Systems, Inc.
The purpose of this case is to introduce and critique the use of “residual income” measures for decision
making, performance evaluation and incentive compensation. As indicated in the case, Stern Stewart’s
version of residual income is referred to as Economic Value Added (EVA®). EVA® has received
favorable press coverage and adoptions from major corporations including Briggs & Stratton Corp.,
Coca-Cola Co., and Eli Lilly and Co (see Tully 1993, 1998; Fisher 1995). The case has been used
successfully at the undergraduate level, in M.B.A. programs and in executive programs. At the M.B.A.
level, the authors have used the case with both traditional full-time students as well as Executive M.B.A.
students. As indicated by our dedication on the title page, the case was inspired by our interaction with
Professor Bill Alberts. Although the case materials are fictitious, they benefited greatly from discussions
with Bill and a number of executives at companies that considered or adopted EVA®. For example, the
situation in Airline Interiors division (discussed below) is loosely based on the Boeing Company.
The Setting
Each division of Interior Systems (the Company) has a different market and different key drivers for
success; e.g, Airline Interiors’ (AI) key drivers are innovation, new orders (leading to a backlog) and,
probably, productivity improvements (though this latter item is not discussed in the case). Since sales lag
orders (potentially by years), accounting numbers are slow in reporting performance and are likely to be
poorly correlated with stock price movements (once the Company is publicly traded). In contrast, Office
Solutions (OS) is selling in the intensely price-competitive office furniture market. Current period sales
and expenses are key indicators of success. The division shows earnings and sales growth, but ROA is
declining. (ROA is not explicitly provided but can be easily calculated.) OS has excess capacity and
proposes to add a “profitable” new product to its line of office furniture, the E-chair.
Chapter 19 – Strategic Performance Measurement: Investment Centers
19-7

Chapter 19 – Strategic Performance Measurement: Investment Centers
19-8
Suggested Solution to Case Questions in the Engagement Letter (Exhibit 7)
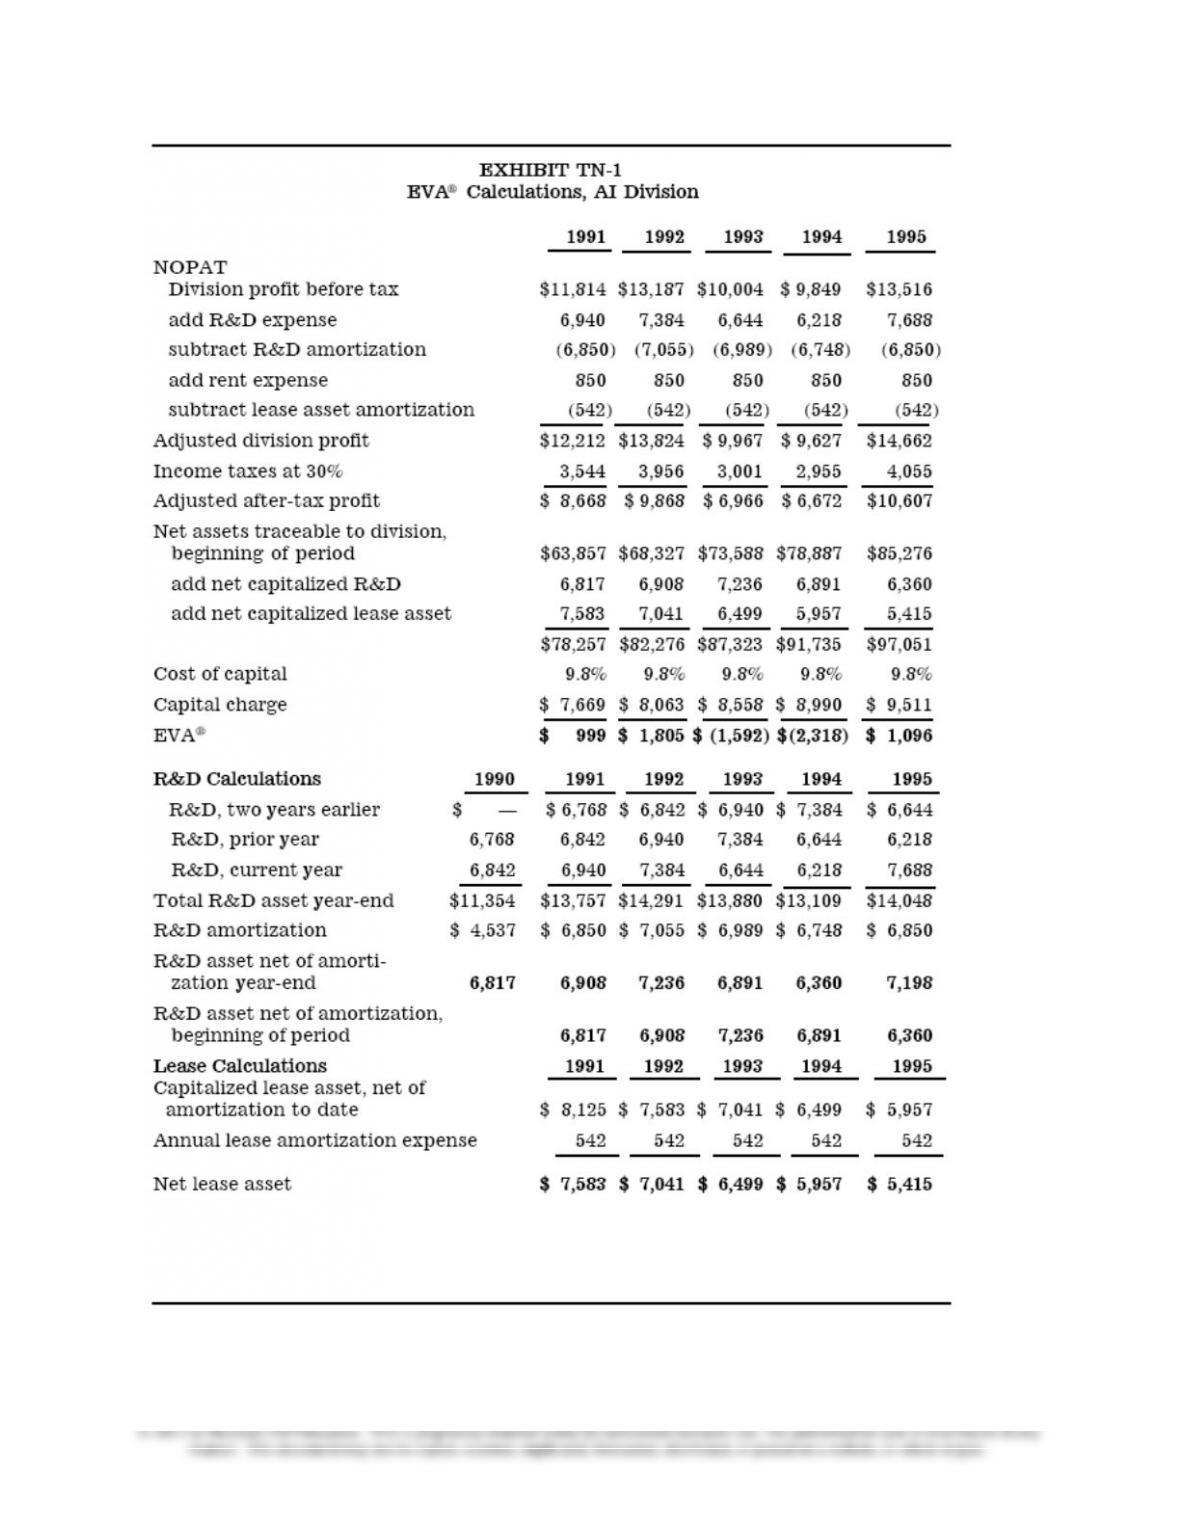
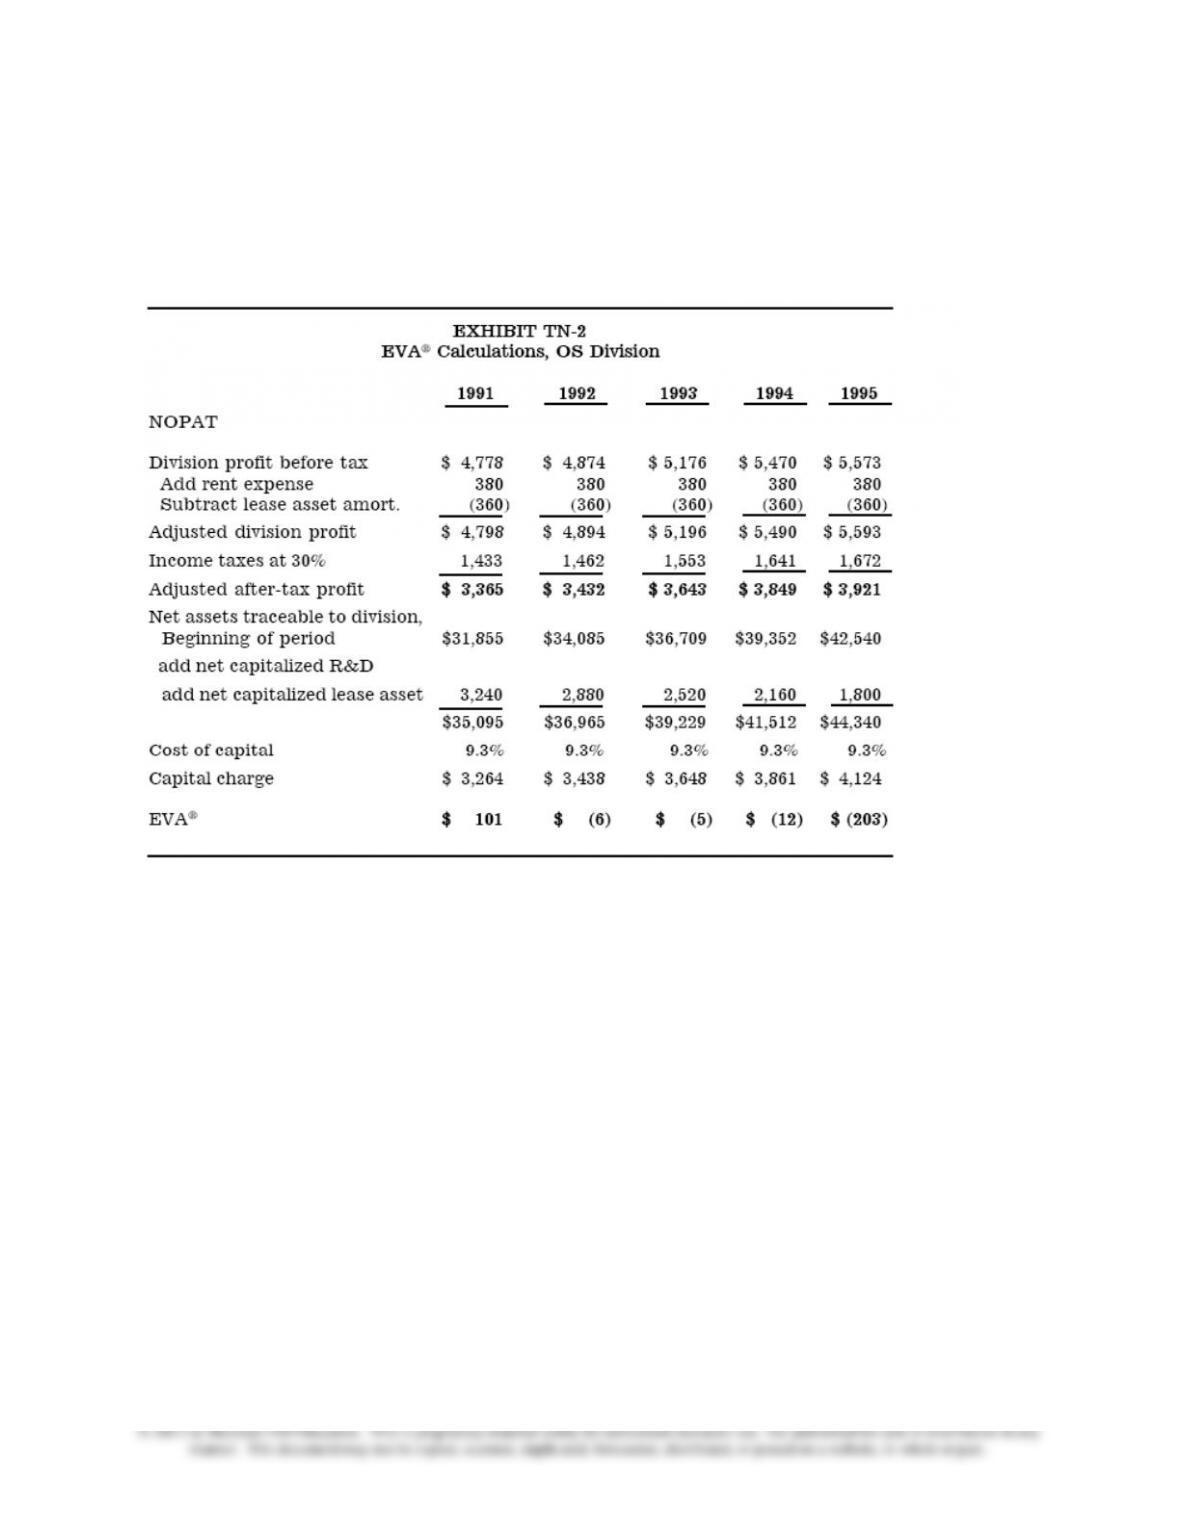
1. EVA® calculations are included in exhibit TN-1 (for Airline Interiors) and exhibit TN-2 (for Office
Solutions).Major points include:
AI division EVA® performance:
• Strong in 1991 and 1992; EVA® is positive, consistent with creating increased shareholder value.
• Very negative during downturn of 1993 and 1994 (consistent with destroying shareholder value)—but
recovery in 1995.
• Over the past five years, the three positive EVA® years have not overcome the two negative EVA®
years. Not surprisingly, EVA® appears to fluctuate with cycles in the industry. To get a picture of AI’s
long-term profitability, one would have to observe a complete business cycle.
OS division EVA® performance:
• Positive in 1991, somewhat negative in 1992–1994 and increasingly negative in 1995.
• Trend suggests that OS division is destroying shareholder value and therefore has not yet met the goal of
stabilizing the cycles experienced by the AI division.
2. EVA® is likely to affect managerial decisions. (See exhibit TN-4 for elaboration and summary of
results from Wallace [1997], a study on firms’ adoption of EVA®-like incentive plans.)
2a. Other things equal, management should find that fewer projects are viewed as acceptable since each
project must now earn greater than the overall, after-tax, weighted cost of capital. (With profits as a
performance measure, any project that earns more than the imbedded cost of debt increases earnings.)
Profitable projects (such as the E-chair proposal) will be rejected if they are not predicted to cover the
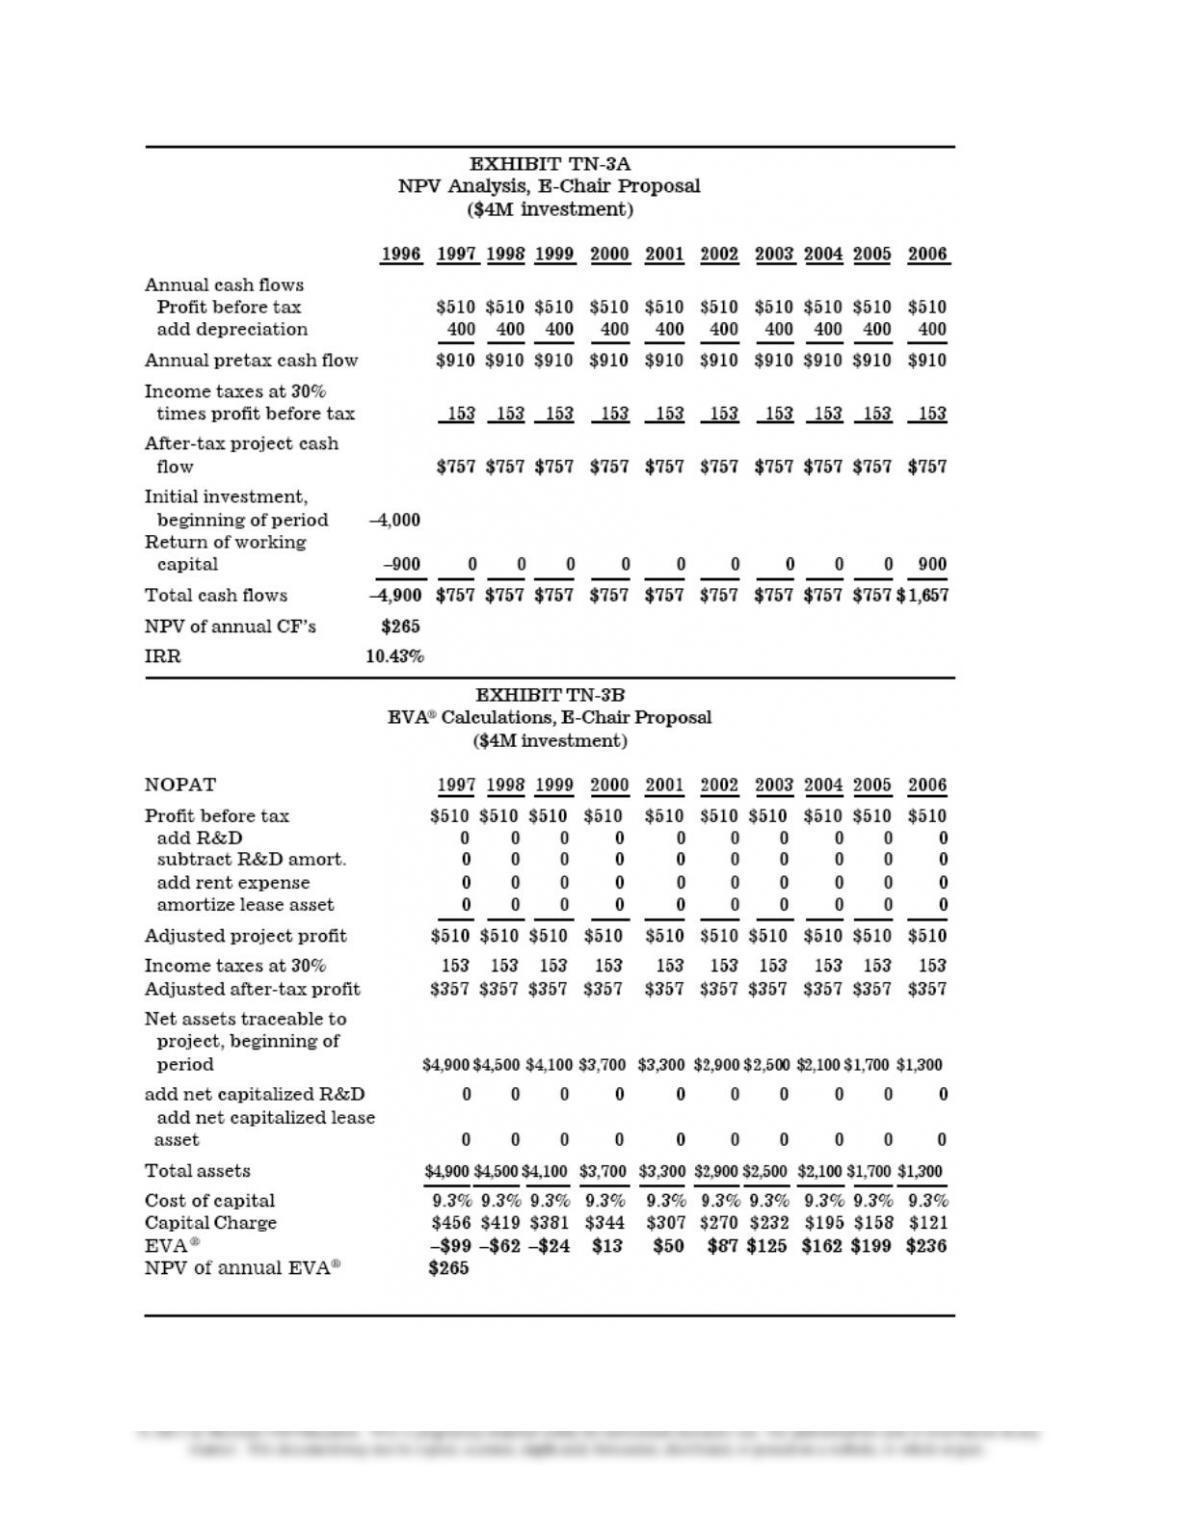
cost of capital. Exhibit TN-3A includes a traditional discounted expected cash flow analysis and exhibit
TN-3B presents a discounted expected EVA® analysis of the E-chair proposal using the assumption that
the necessary capital investment is $4 million. Note that, given the same set of assumptions (discussed
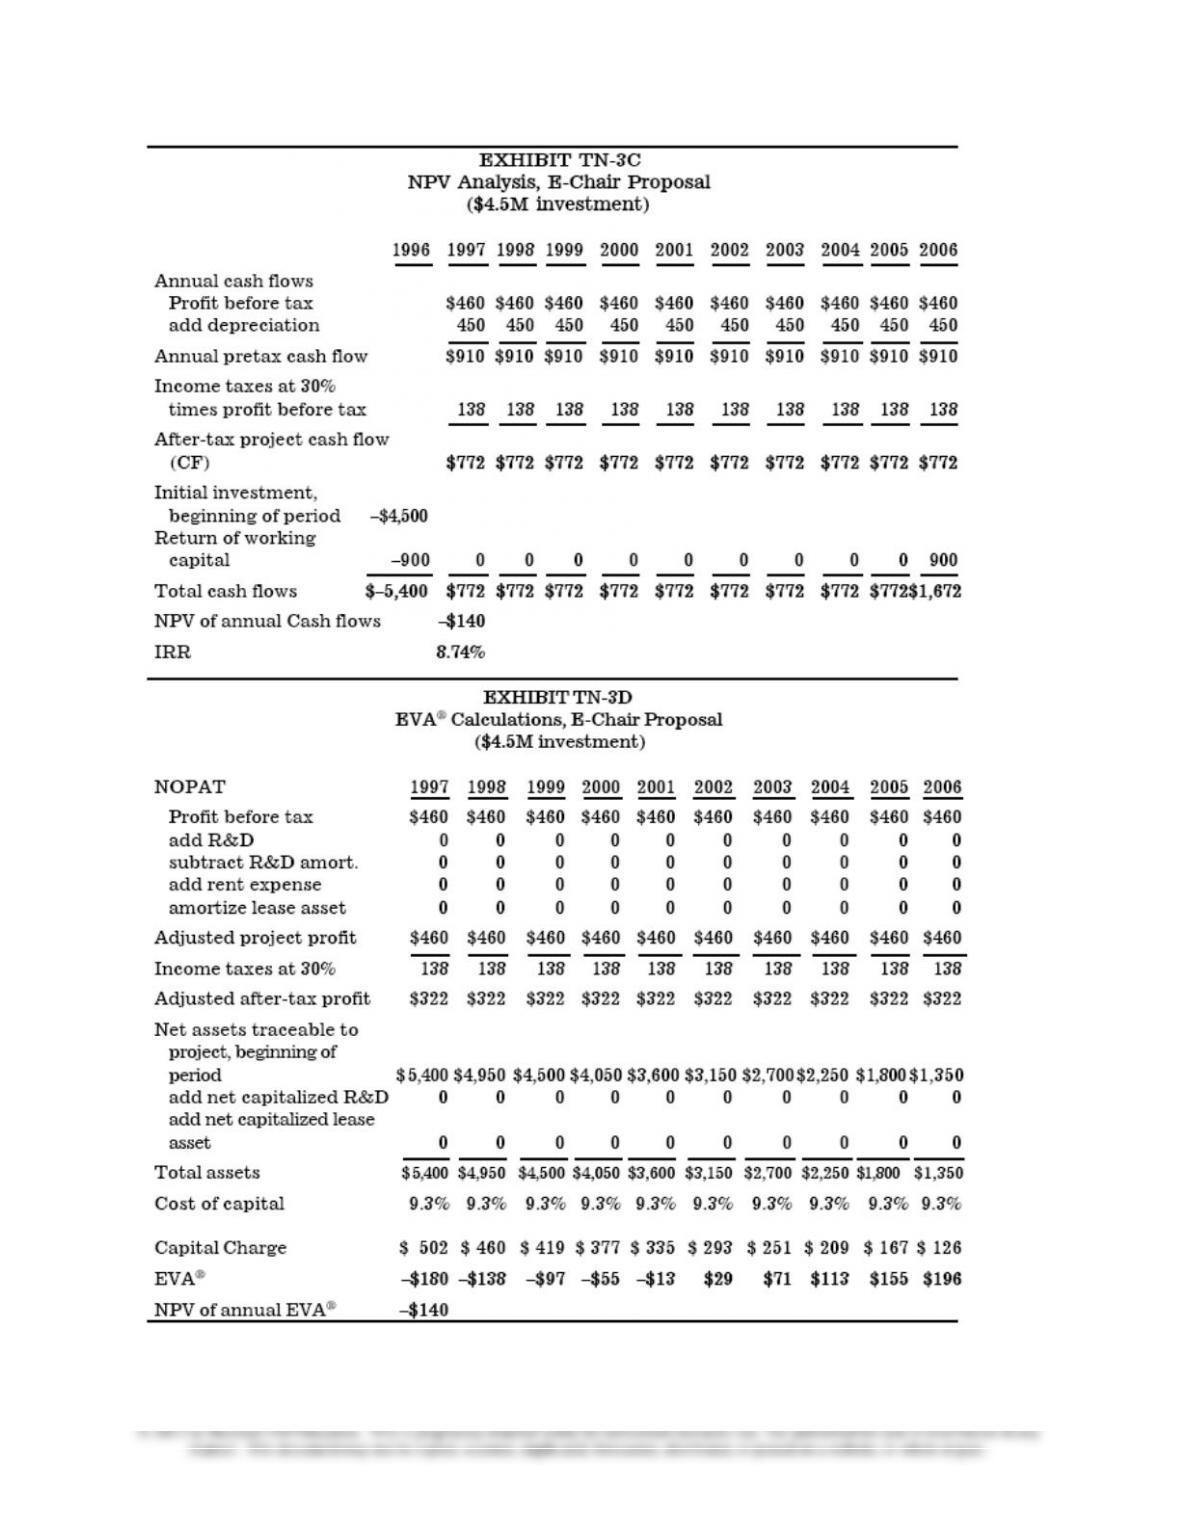
next), both approaches arrive at the same NPV. Exhibits TN-3C and 3D repeat the calculations using the
assumption that the necessary capital investment is $4.5 million.
Assumptions (not made explicit in the case) include:
• The single year of cash flows provided in exhibit 4 is representative of all years of the project’s
life. This suggests that there is no learning curve and no decay in performance throughout the
project’s life. Constant performance throughout the project’s life is consistent with no
competitive entry and thus is a particularly strong assumption.
• Tax treatment is based on income before EVA® adjustments.
• The appropriate hurdle rate for this project is OS division’s 1995 cost of capital (from exhibit
3).
• No inflation throughout the life of the project. (A close approximation would be to assume the
division’s cost of capital is a “real” [vs. nominal] rate of return and is appropriately matched
against “real” [vs. nominal] cash flows in exhibit 4. This is not precisely correct because, for
example, tax savings related to depreciation deductions are nominal cash flows.)
Given the above assumptions, the quantitative attractiveness of the E-chair proposal hinges on the size of
the initial investment in depreciable assets.
At $4 million (provided in exhibits TN-3A and 3B), the project has:
• a payback of 6.5 years
• positive incremental earnings in each year
• negative EVA® for 1997 through 1999
• a positive NPV of $265,000
At $4.5 million (provided in 10C and D), the project has:
Chapter 19 – Strategic Performance Measurement: Investment Centers
19-9
• a payback of 7 years
• positive incremental earnings in each year
• negative EVA® for 1997 through 2001
• a negative NPV of $140,000
Chapter 19 – Strategic Performance Measurement: Investment Centers
19–10
Chapter 19 – Strategic Performance Measurement: Investment Centers
19–11

Chapter 19 – Strategic Performance Measurement: Investment Centers
19–12
Discussion of Non-NPV Criteria for Evaluating the Proposal
• Payback and earnings fail to alert the decision maker about the sensitivity of the decision to the level of
the investment in depreciable assets.
• Focusing on the level of EVA® in the early years can lead to the “wrong” decision. Even managers with
a three-year horizon might reject a positive NPV project (as it is when the investment in depreciable
assets is $4 million). Interestingly, focusing on incremental division profits in the early years can
inadvertently lead to the “correct” decision (when the investment in depreciable assets is $4 million).
Qualitative Factors
• What is likely to be the effect of the E-chair proposal on sales of other Company products? The case
suggests that the E-chair might cross-sell the AI version of the seat. While it strikes us that it is a stretch
to argue that airline seating could sell high-end office chairs, other OS products might benefit from
introducing the E-chair. (This is in contrast to many situations where new products cannibalize sales of
existing products.)
• Are some of the assumptions listed above likely to be violated? If so, how might it affect the decision?
2b. Other things equal, since fewer projects will be viewed as acceptable, more cash will be returned to
owners in the form of share repurchases (most likely\) or cash dividends (less likely). Ex ante, the
predicted effect on capital structure is less clear. Empirical evidence in Wallace (1997) suggests that firms
will reduce both debt and equity capital. (We have not included the data necessary to calculate financial
leverage.)
2c. Managers also have an increased incentive to efficiently run day–to-day operations because they have
to consider both earnings and the investment necessary to generate those earnings. This suggests that,
other things equal, we expect to see increases in total asset turnover, inventory turnover, AR turnover, etc.
(We have not included the data necessary to calculate these ratios.)

Chapter 19 – Strategic Performance Measurement: Investment Centers
19–13
3. EVA® should mitigate but not eliminate incentives to emphasize short-run performance. Annual
EVA® is still based on a one–period historical model. However, accounting “distortions” such as the
requirement to expense R&D are “corrected” in calculating EVA®. In practice, EVA® compensation
plans are often implemented as rolling three-year targets in order to lengthen the managers’ planning
horizon.
For example, without lengthening the time horizon, a proposal might be rejected because it produces
negative EVA® in the early years despite having large positive EVA® in future years. This could be the
case with the E-chair proposal if the initial investment in depreciable assets is at the low end of the range,
e.g., $4 million. See discussion of case question 1 above. An alternative means of mitigating manager’s
rejecting positive NPV projects with early losses is to use a form of economic depreciation where lesser
amounts of depreciation is taken in the early years (i.e., decelerated depreciation).
4a. If EVA® is deemed to be cost effective (and management is sure it is not the “fad of the year”),
telling shareholders about it is probably a good (but bold?) idea. Given the capital charge, EVA® will
generally be (considerably) lower than the earnings numbers shareholders are accustomed to seeing. Note
that most firms appear to start slowly with EVA®. They tend to adopt it for performance measurement
some years before explicitly incorporating the measure into management incentive compensation plans.
(Of course it is possible that all the accolades for EVA® are due to self–selection, i.e., of those firms that
consider EVA®, the only ones that adopt it are successful firms that can “afford” to take a charge for
equity capital.) Many firms now include disclosure about their use of an EVA® performance measure;
however, they do not report actual EVA® performance.
4b. Asking a CPA firm to audit the numbers could potentially represent a high cost to the firm because of
the deviations from GAAP accounting resulting from adjusting for “accounting distortions” and providing
a deduction for the cost of equity capital. These additional costs include the direct costs of the additional
work that the CPA firm must perform in order to substantiate the accounting adjustments and the
calculation of the firm’s cost of capital. In addition to the direct costs, potential indirect costs include
possible litigation costs resulting from the deviations from GAAP accounting. Zimmerman (1997) in the
Journal of Applied Corporate Finance discusses these costs. Zimmerman (1997) gives the example of a
firm that capitalizes a large amount of R&D expense, leading to high and growing EVA® and high
EVA®-based bonuses. In his example, the stock price is also rising because the market looks beyond the
GAAP numbers to the EVA® results, believing the R&D will pay off. Unfortunately in this example a
new scientific discovery destroys the usefulness of the firm’s R&D expenditures, leading to a sharp drop
in the stock price. The R&D must be written off, leading to a sharp drop in EVA®. (No adjustment is
needed for GAAP earnings since R&D is already expensed.) In retrospect, the managers received large
EVA®-based bonuses that now appear unwarranted. A potential shareholder lawsuit could result because
the large EVA®-based bonuses may appear self-serving, given that GAAP earnings were much lower all
along. Some CPA firms might relish the opportunity to work with firms that adopt EVA®. Several of the
large accounting firms currently market versions of similar shareholder value measures.
Supplemental Questions
5. Note that this question does not directly deal with the merits of EVA®. Instead it addresses the more
general topic of accounting-based vs. stock-based compensation. No, it is probably a good idea to
continue to tie at least some of the managers’ incentive compensation to accounting (or EVA®)
performance even after the stock is publicly traded (Lambert 1993, 101). A reason to have an incentive
compensation plan is to align incentives (induce effort in the interests of the owner). Use of accounting–
based compensation allows more direct monitoring of that effort. Since managers are generally less
diversified than investors, without monitoring managers will tend to adopt more conservative projects

Chapter 19 – Strategic Performance Measurement: Investment Centers
19–14
than investors would prefer. To the extent that accounting performance is correlated with management
effort (that is not captured in stock prices), incentives between managers and owners will be better
aligned by basing a portion of managers’ incentive compensation on accounting performance. Further,
because stock price is often affected by many events outside of the managers’ control, basing all incentive
compensation on stock price would subject managers to increased risk that could require higher than
optimal compensation.
6. Note that this question is closely related to question 2b above. The CFO’s arguments are theoretically
correct, i.e., pay out excess cash flow when positive NPV projects cannot be identified. However, the
Marketing VP’s position is common and understandable, given that managers generally are not
diversified (especially when one considers the amount of human capital tied up in the firm and frictions
in the managerial labor market). Thus, it is rational for managers to want to reduce their personal risk by
retaining excess cash in the business. The question is: “To what degree can changing to an EVA®-based
compensation scheme align the incentives of managers and owners?” Other reasons to retain cash (instead
of paying out “excess” cash via share repurchases or special dividends) include:
• Management can take actions (e.g., invest in new projects) without seeking funds and incurring
additional scrutiny from the impartial capital markets
• Empire building
> larger firms tend to pay higher salaries
> firms that are growing in scale (if not in EVA®) provide more opportunities for managerial
promotions (and most salary increases are associated with promotions)
> prestige and perks are associated with larger firms
Summary of Benefits and Costs of Switching to EVA®
Benefits include:
• Better aligns incentives with owners’ interests
• Like other investment-center performance metrics, forces managers to explicitly consider
balance sheet investment along with income statement performance.
• Reduces incentive to adopt profitable (but negative NPV) projects
• Increases the incentive to dispose of currently profitable (but negative NPV) projects.
• Increases incentive to pay out free cash flow (cash flow in excess of what can be used to fund
positive NPV projects)
• Better aligns performance evaluation with project selection based on NPV
Costs of switching to EVA® include:
• Installation and education of managers, e.g., it may be difficult to compute division-level cost of
capital or determine asset base attributable to each division.
• Difference from the metric that gets public attention—earnings.
• Accounting-based performance metrics that take into account the investment base (e.g., ROA)
may be “good enough.”
• Correlation between EVA® and stock price performance that may not be high for some firms
and may be no higher than for earnings or cash from operations. See Biddle et al. (1997).
Other issues:
• EVA® does not solve short–run incentive to show positive results early in a project’s life.
• EVA® does not help in situations where underlying operating profits are a poor measure of the
key success factors of the business (e.g., Boeing, biotech and AI!)
On balance, EVA® is probably a good idea for OS and, perhaps, for AI and the Company as a whole. (No
historical measure of performance, e.g., earnings, cash flow or EVA®, gets around the fundamental issue

Chapter 19 – Strategic Performance Measurement: Investment Centers
19–15
that the key driver for success at AI is obtaining a new order.) We believe performance measurement and
incentive compensation should be based on more than accounting numbers alone (whether they be
earnings, cash flow, ROI or EVA®). One approach is to identify key drivers of shareholder value for each
level of the organization and be incorporated in a balanced scorecard. For example, at AI new orders are
obviously a key driver. Other key measures might include: quality (e.g., defects, durability, customer
complaints), cycle time, operating up-times, inventory levels, on-time delivery, parts simplification, new
product development, etc.