Unlock document.
This document is partially blurred.
Unlock all pages and 1 million more documents.
Get Access
Chapter 18 - Strategic Performance Measurement: Cost Centers, Profit Centers, and the Balanced Scorecard
18-1
CHAPTER 18:
STRATEGIC PERFORMANCE MEASUREMENT: COST CENTERS,
PROFIT CENTERS, AND THE BALANCED SCORECARD
QUESTIONS
18-1 Performance evaluation can be thought of as the process by which managers at
all levels in the firm gain information about the performance of tasks within the
firm and judge that performance against pre-established criteria as set out in
budgets, plans, and goals. In management accounting there are two types of
of operating level employees by mid-level managers.
18-2 Strategic performance measurement is a management accounting system used
by top management for the evaluation of business unit managers. It is used
when the conditions are such that responsibility can be effectively delegated to
18-3 An effective performance evaluation system must consider both the individual
and team aspects of work and performance in the firm. In management
accounting, we focus on the individual aspects primarily in strategic performance
18-4 The systems for management control are of two types -- formal and informal.
Formal systems are developed from explicit management guidance, while
informal systems arise from the unmanaged, and sometimes unintended,
behavior of managers and employees. Informal systems reflect the managers'
and employees' reactions and feelings that arise from the positive and negative
control system at the individual level.
Chapter 18 - Strategic Performance Measurement: Cost Centers, Profit Centers, and the Balanced Scorecard
18-2
18-5 The two organizational designs are centralized and decentralized. A centralized
firm reserves much of the decision-making at the top management level. In
contrast, a decentralized firm delegates a significant amount of responsibility to
18-6 A cost center is a production or support unit within a firm that is evaluated on the
basis of cost.
A revenue center focuses on the selling function and is defined either by product
line or by geographical area.
Revenue center: to meet sales goals within a given expense budget.
Profit center: achieve desired profit goals.
Investment center: achieve desired profit goals for a given amount of assets.
18-7 While net income determined using full costing is affected by changes in
inventory levels, net income using variable costing is not affected. This means
that the proper interpretation of net income under full costing, unlike variable
18-8 There are four behavioral/implementation issues for SBUs:
1. Cost shifting, wherein a department replaces its controllable costs with
non-controllable costs. For example, a manager might attempt to replace variable
costs such as manufacturing labor with fixed costs such as advanced equipment
Chapter 18 - Strategic Performance Measurement: Cost Centers, Profit Centers, and the Balanced Scorecard
18-3
effect in management control. Slack is sometimes viewed as a dysfunctional
aspect of SBUs, a result of managers attempting to make their performance
managers' exposure to environmental uncertainty, it reduces the relative risk
aversion of the managers.
18-9 A pervasive issue when using cost centers is how the jointly incurred costs of
service departments -- such as data processing, engineering, human resources,
or maintenance -- are to be allocated to the departments using the service. The
18-10 Strategic performance measurement can be used for both service and not-for-
profit firms as well as manufacturing firms. Cost centers are particularly
appropriate across all organization types, as the organization attempts to identify
18-11 Cost centers are used when the firm wishes to focus the manager’s attention
exclusively on costs. This makes sense particularly when for example the
manager is producing a product that requires little coordination with marketing or
design. There are therefore few times when the manager will need to adjust the
functionality of the product or adjust the production schedule to suit the needs of
departments to work together. Also, profit centers are used to set a desirable
competitive tone; all departments have the profit incentive to compete with other
providers of the good or service, inside or outside the firm.
18-12 (See also 18-5) Centralized firms have a strong hierarchical organization in which
information flows upward and management flows downward in the hierarchy.
Centralized firms are effective in quickly implementing policy changes and in
Chapter 18 - Strategic Performance Measurement: Cost Centers, Profit Centers, and the Balanced Scorecard
18-4
policies. Decentralized firms grant a great deal of autonomy to local managers,
on the belief that the local managers will have the best knowledge to make
appropriate decisions for the firm. The key factor in decentralized firms is to
develop management controls processes which provide the right incentives to
local managers -- so that they independently work hard for top management
managers and the firm can benefit when local managers are able to decide local
issues. For this reason, decentralization, with proper incentives, can more
effectively achieve top management’s goals.
18-13 The marketing department can be viewed as both a revenue center and a cost
center. The marketing department is viewed as a revenue center because there
is a revenue-generating process. The marketing manager must therefore report
revenues, typically by product line, and sometimes also by sales area and
Chapter 18 - Strategic Performance Measurement: Cost Centers, Profit Centers, and the Balanced Scorecard
18-5
BRIEF EXERCISES
18-14 The discretionary cost center has a planning focus since it is used
when the unit’s outputs are hard to measure and the costs are largely
18-15 Risk preferences have implications for performance evaluation.
For example, the risk-averse manager is most likely to be motivated
by supervision and rewards that reduce risk, while the reverse may
be true for the risk-prone manager. Moreover, risk preferences can
interfere with proper decision making. For example, a risk-averse
outcome. For proper motivation and decision making, management
control systems should be designed to reduce the negative effects of
risk preferences.
18-16
Net Revenues $1,000,000
Variable Costs 300,000
Contribution Margin $700,000
Controllable Fixed Costs 100,000
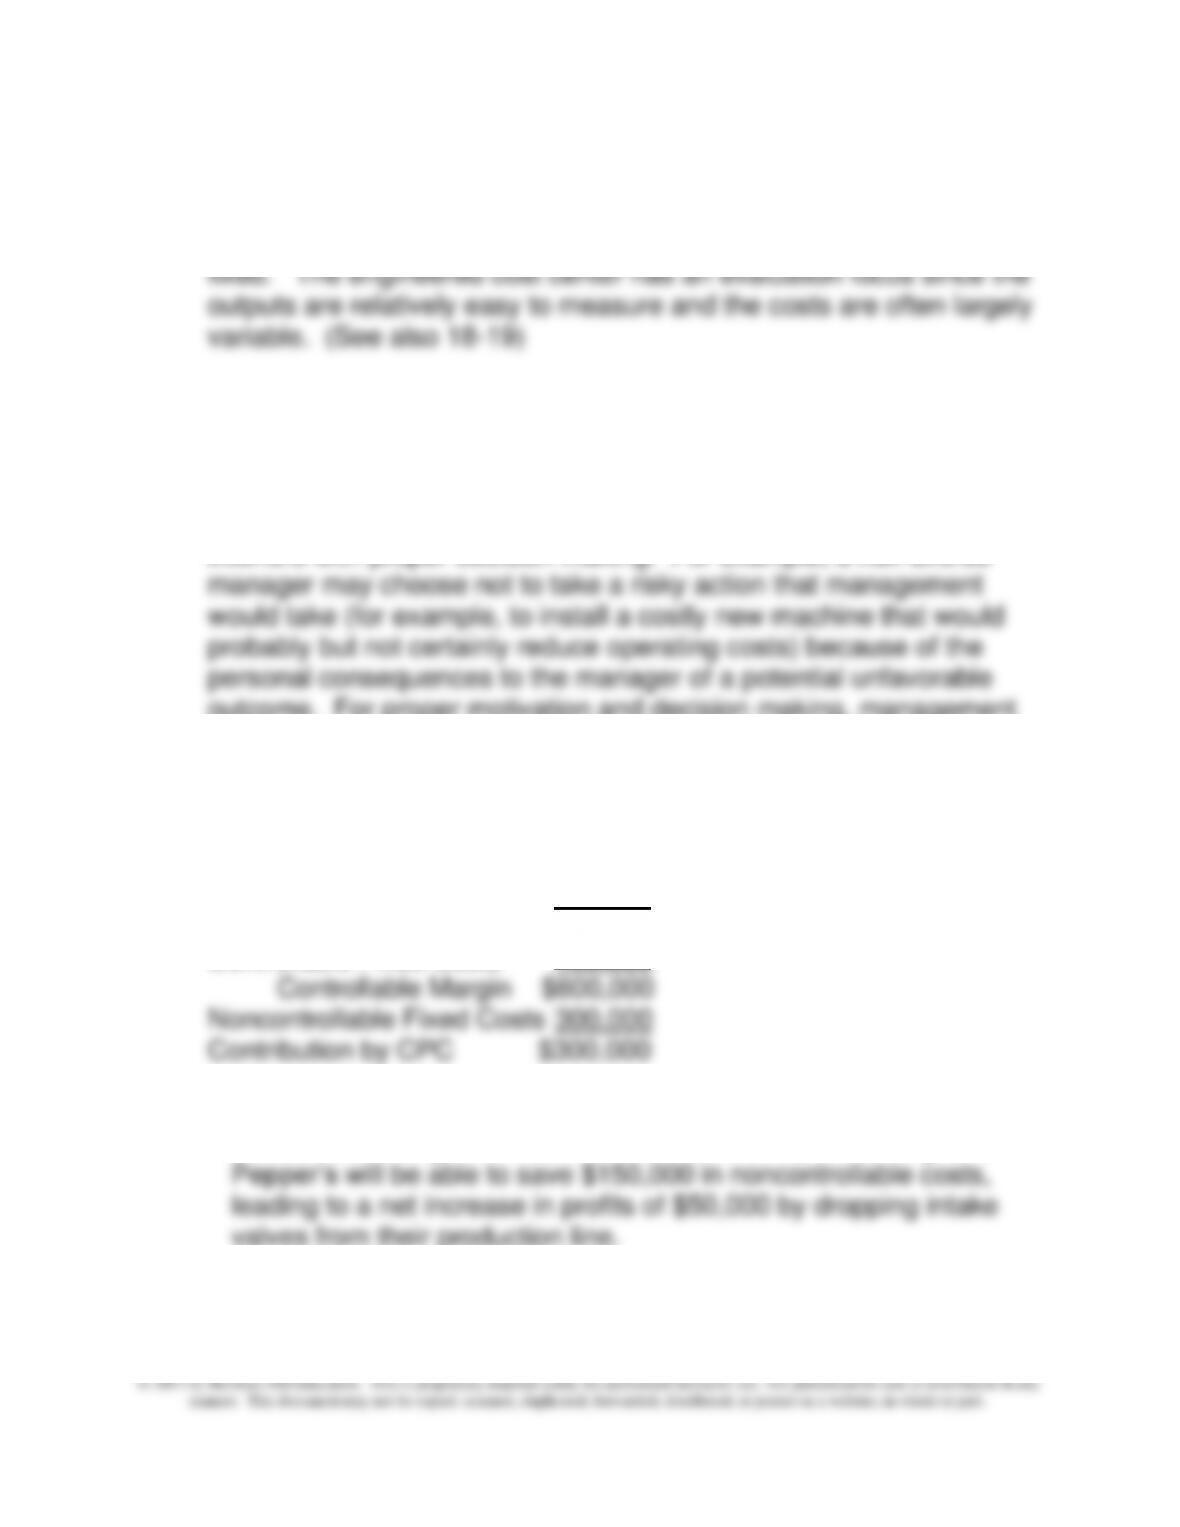
18-17 In the short run, Pepper’s will lose $100,000 in profits, shown by the
Controllable Margin for intake valves. However, in the long run,
valves from their production line.
Chapter 18 - Strategic Performance Measurement: Cost Centers, Profit Centers, and the Balanced Scorecard
18-6
18-18
Contribution Margin $500,000
Controllable Fixed Costs 200,000
Controllable Margin $300,000
18-19 The engineered cost approach is equivalent to the flexible budget
method explained in chapter 14; a standard usage is set for the
activity, and a usage variance is calculated. In contrast, under the
discretionary cost approach, the planned cost is used in the
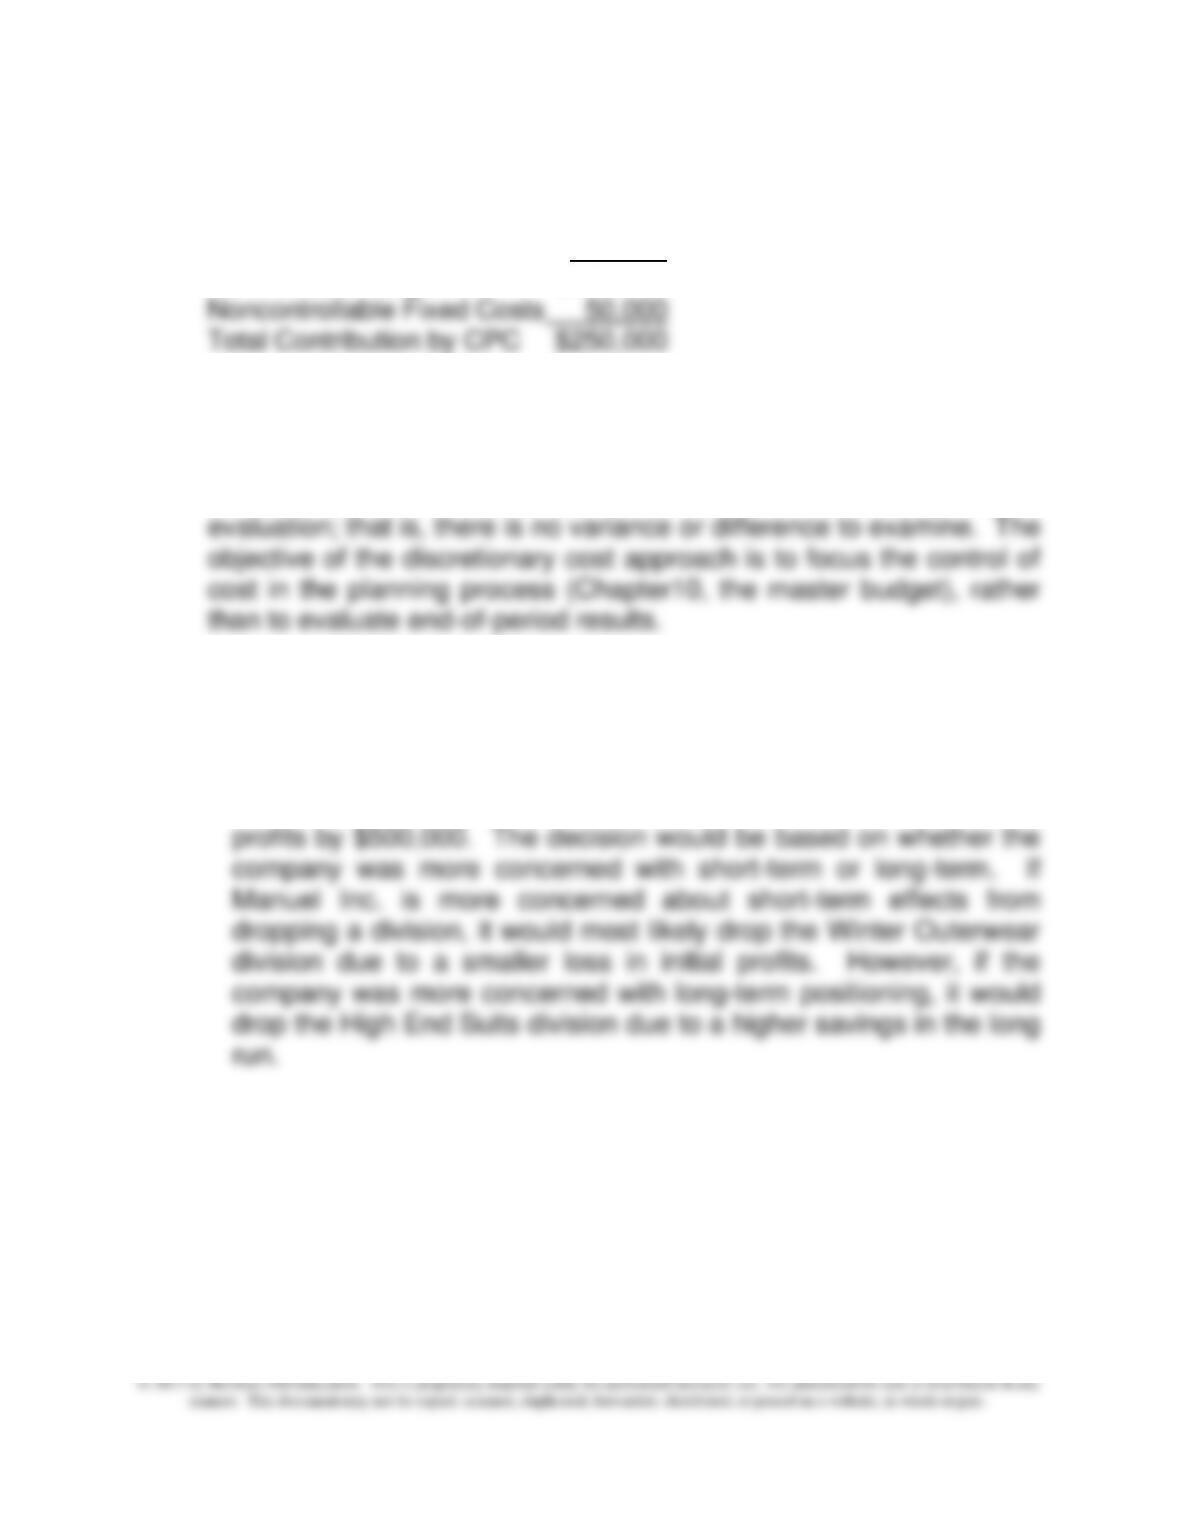
18-20 For the Winter Outerwear division, the short-term effect would be a
loss of $500,000 in profits as shown by the Controllable Margin.
The long-term effect would be an increase of $250,000 in profits,
shown by the CPC. For the High End Suits the short-term effect
would be a loss of $1,000,000 in profits and a long-term increase in
Chapter 18 - Strategic Performance Measurement: Cost Centers, Profit Centers, and the Balanced Scorecard
18-7
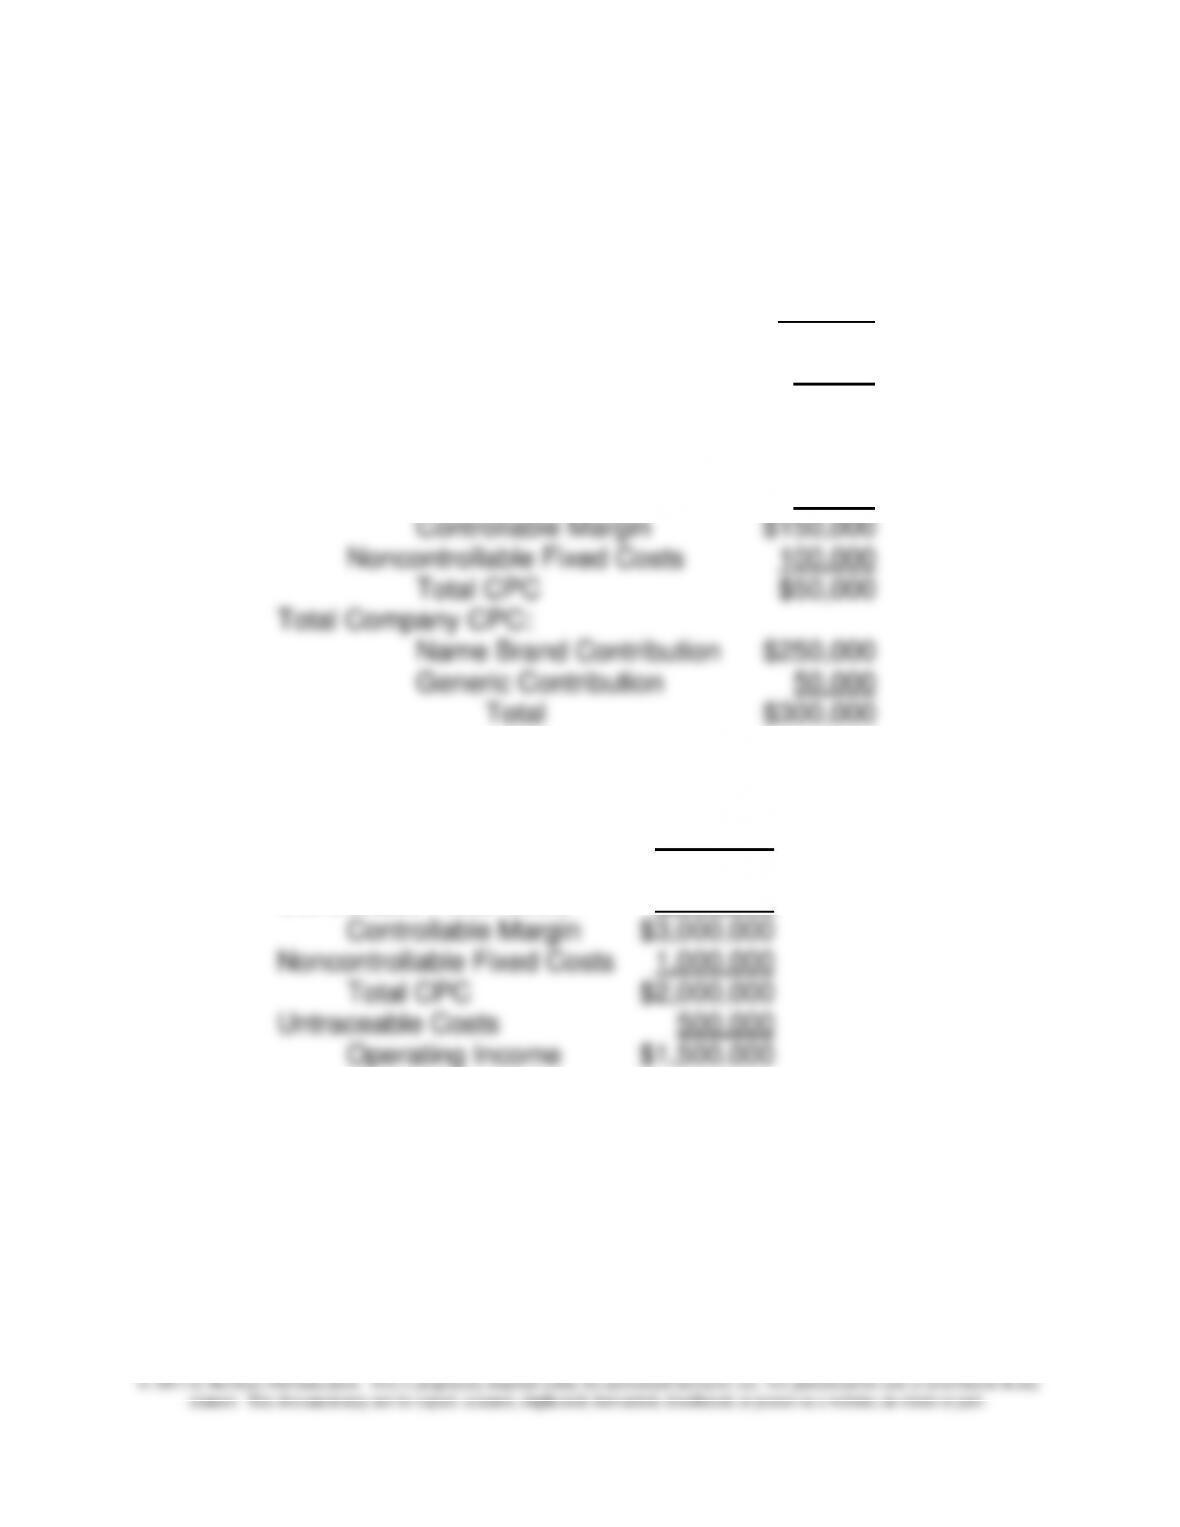
18-21
Name Brand:
Contribution Margin $500,000
Controllable Fixed Costs 200,000
Controllable Margin $300,000
Noncontrollable Fixed Costs 50,000
Total CPC $250,000
Generic:
Contribution Margin $200,000
Controllable Fixed Costs 50,000
18-22
Net Revenue $10,000,000
Variable Costs 5,000,000
Contribution Margin $5,000,000
Controllable Fixed Costs 2,000,000
Chapter 18 - Strategic Performance Measurement: Cost Centers, Profit Centers, and the Balanced Scorecard
18-8
EXERCISES
18-23 Risk Aversion and Decision Making (20 min)
1.
John will choose the household glue, because being risk
averse, the 100% chance of the $310,000 profit will look much better
2.
The company would prefer the space-age bonding formula,
because the company is relatively risk neutral, and the expected
3.
The company can reduce the size of the bonus and increase
the salary, thus removing the risk “penalty” in the mind of the risk-
averse manager. On the other hand, the reduction in the bonus
18-9
18-24 Risk Aversion; Strategy (20 min)
John’s decision about scheduling the special order involves the
conflict of three key factors: the need for maintenance, the delay of
currently scheduled jobs, and the value of the new customer in terms
of current contribution to profits as well as the later contribution to
profits from future sales to the special order customer. Risk is an
important aspect of the problem because of the risk of the equipment
failure and its consequences, plus the uncertainty about the delay for
currently scheduled jobs, irrespective of whether the equipment fails.
Because of risk aversion (we expect John to be risk averse), John will
be motivated to reject the special order since it adds risk. However,
Chapter 18 - Strategic Performance Measurement: Cost Centers, Profit Centers, and the Balanced Scorecard
18-10
18-25 Research and Development: Risk Aversion and Performance
Measurement (20 min)
1. Risk aversion, the tendency to avoid actions with uncertain outcomes
(even with good probability of success), is a common trait among
managers. This leads frequently to a choice of a short-term gain that
may conflict with a long-term benefit. In the case of R&D, when
economic times are hard, very often the risk aversion and the short-
term thinking take over and R&D is reduced. A recent Business
Week article (cited below) notes this trend among Silicon Valley
education.
While managing risk aversion may mean relying in part on external
sources of funding, it can also be accomplished by a strong emphasis
on the importance of innovation and its role in future competitiveness.
Sometimes this means that “champions” of research within firms will
play an important role in increasing the funding of research. The
Business Week article notes that some Silicon Valley entrepreneurs
have taken money out of their own pockets to fund research.
2. Budgeting and controlling activities such as R&D is difficult.
Nonetheless some control must be exercised. The firm should
attempt to track the costs and progress of individual projects.
Periodically the projects should be evaluated by the personnel doing
the research, by other scientists, and by operating managers; the
Chapter 18 - Strategic Performance Measurement: Cost Centers, Profit Centers, and the Balanced Scorecard
18-11
comparing its spending with the spending of competitors seems
reasonable.
18-25 (continued -1)
An alternative approach, used by Hewlett-Packard’s PC division is to
increase R&D spending for products that can most benefit. To
determine how to target R&D effort, H-P uses a measure called “R&D
productivity,” which is the ratio of R&D spending on a product line to
the gross margin of the product line. Using this approach, products
Sources: Steve Hamm, “Is Silicon Valley Losing Its Magic?: A Road Trip
Finds Risk Aversion, Short-term Thinking, and A Few Bold Ideas,”
Business Week, January 12, 2009, pp. 29-33; Cliff Edwards, “How HP Got
the Wow Back,” Business Week, December 22, 2008, pp. 60-61.
Chapter 18 - Strategic Performance Measurement: Cost Centers, Profit Centers, and the Balanced Scorecard
18-12
18-26 Leadership Development (20 min)
This question is intended primarily as a basis for class discussion.
The objective is to have the student consider the critical leadership
skills that successful managers must acquire. There are a number of
sources for leadership and management skills, and the following is
one representative example. The list was developed by a team at
Google. The team was code named “Project Oxygen,” and the
objective was to provide means to develop better managers. The list
included 8 key behaviors, examples of which are provided below. A
similar list could be provided by, for example, Stephen Covey’s book,
The 7 Habits of Highly Effective People (Fireside Books, 1989).
1. Be a good coach
o Provide constructive feedback
o Have regular individual meetings with each team member
o Help stragglers; watch out for bullies
2. Empower your team and do not micromanage
o Understand the strengths and weakness of your employees
when necessary
3. Express interest in team members’ success and personal well-
being
o Take opportunities you have to get to know each team
member
Chapter 18 - Strategic Performance Measurement: Cost Centers, Profit Centers, and the Balanced Scorecard
18-13
18-26 (continued -1)
4. Be productive and results-oriented
o Prioritize for yourself and your team
o Make sure the team is aware of and focused on key goals
o Be as hard working as any on your team; inspire them to
work as hard as you
5. Be a good communicator and listen to your team
o Be a good listener
don’t take this for granted, but ask questions to determine if
the team is aligned with your strategy and goals
o Be ready to adapt the strategy when needed, and to
promptly and clearly communicate the new strategy to the
team
8. Develop and maintain key technical skills need by all team
members
o Be able to advise team members when they need help with
a technical issue
Chapter 18 - Strategic Performance Measurement: Cost Centers, Profit Centers, and the Balanced Scorecard
18-14
18-26 (continued -1)
Source: Adam Bryant, “The Quest to Build a Better Boss,” The New York
Times, March 13, 2011, pp. B1-2.
18-27 Departmental Cost Allocation in Profit Centers(20 min)
1. Beef Barn: 3,000/6,000 x $24,000 = $12,000
Fish Bowl: 3,000/6,000 x $24,000 = $12,000
This is equivalent to charging each restaurant $4 ($24,000/6,000) per
table. Since the usage of the baking area is equal, most would agree
2. One approach would be to use the allocation approach in (1)
above, noting that total costs are now $12,000 fixed cost and unit
variable cost is still $2 ($12,000/6,000). Thus total cost is now
happy with this result, since the Beef Barn’s sales are down 1/3, but
baking has not decreased as much. Why? The manager may need a
brief explanation of the effect of increasing unit costs when fixed
costs don’t change and activity levels decline. But the manager of the
Fish Bowl is most likely to be angry, because the Fish Bowl hasn’t
changed at all, but its unit costs have gone up by $.40, and total costs
have increased $1,200. An un-motivating deficiency of this allocation
method is thus that the activity levels in each unit can affect total
activity, and therefore affect the amount of cost allocated to each unit.
18-15
18-27 (continued -1)
A way to solve this deficiency is to use a different approach,
based upon dual allocation, where variable costs are traced directly
to the user, and fixed costs are allocated on some logical basis. In
this case, suppose we split fixed costs evenly, because, on the
average, the Bowl and the Barn have approximately equal activity
Then the fixed costs should be allocated on the basis of the
proportion of the long-run average usage. For example, if the average
long-run usage of the Fish Bowl is 4,000 tables, and the long-run
usage of the Beef Barn is 2,000, then the fixed costs should be
allocated as follows:


