Chapter 18 – Strategic Performance Measurement: Cost Centers, Profit Centers, and the Balanced Scorecard
18–76
18-59 (continued –1)
3. The scorecard perspectives appear to be correctly aligned with the
mission statement which has goals for improvement in terms of patient
care, physician satisfaction, and overall staff satisfaction. The
perspectives of process and quality improvement should support the
satisfaction of patients, while the focus on the organizational health
4. The strategy map is likely to follow the sequence of perspectives
provided in the article.
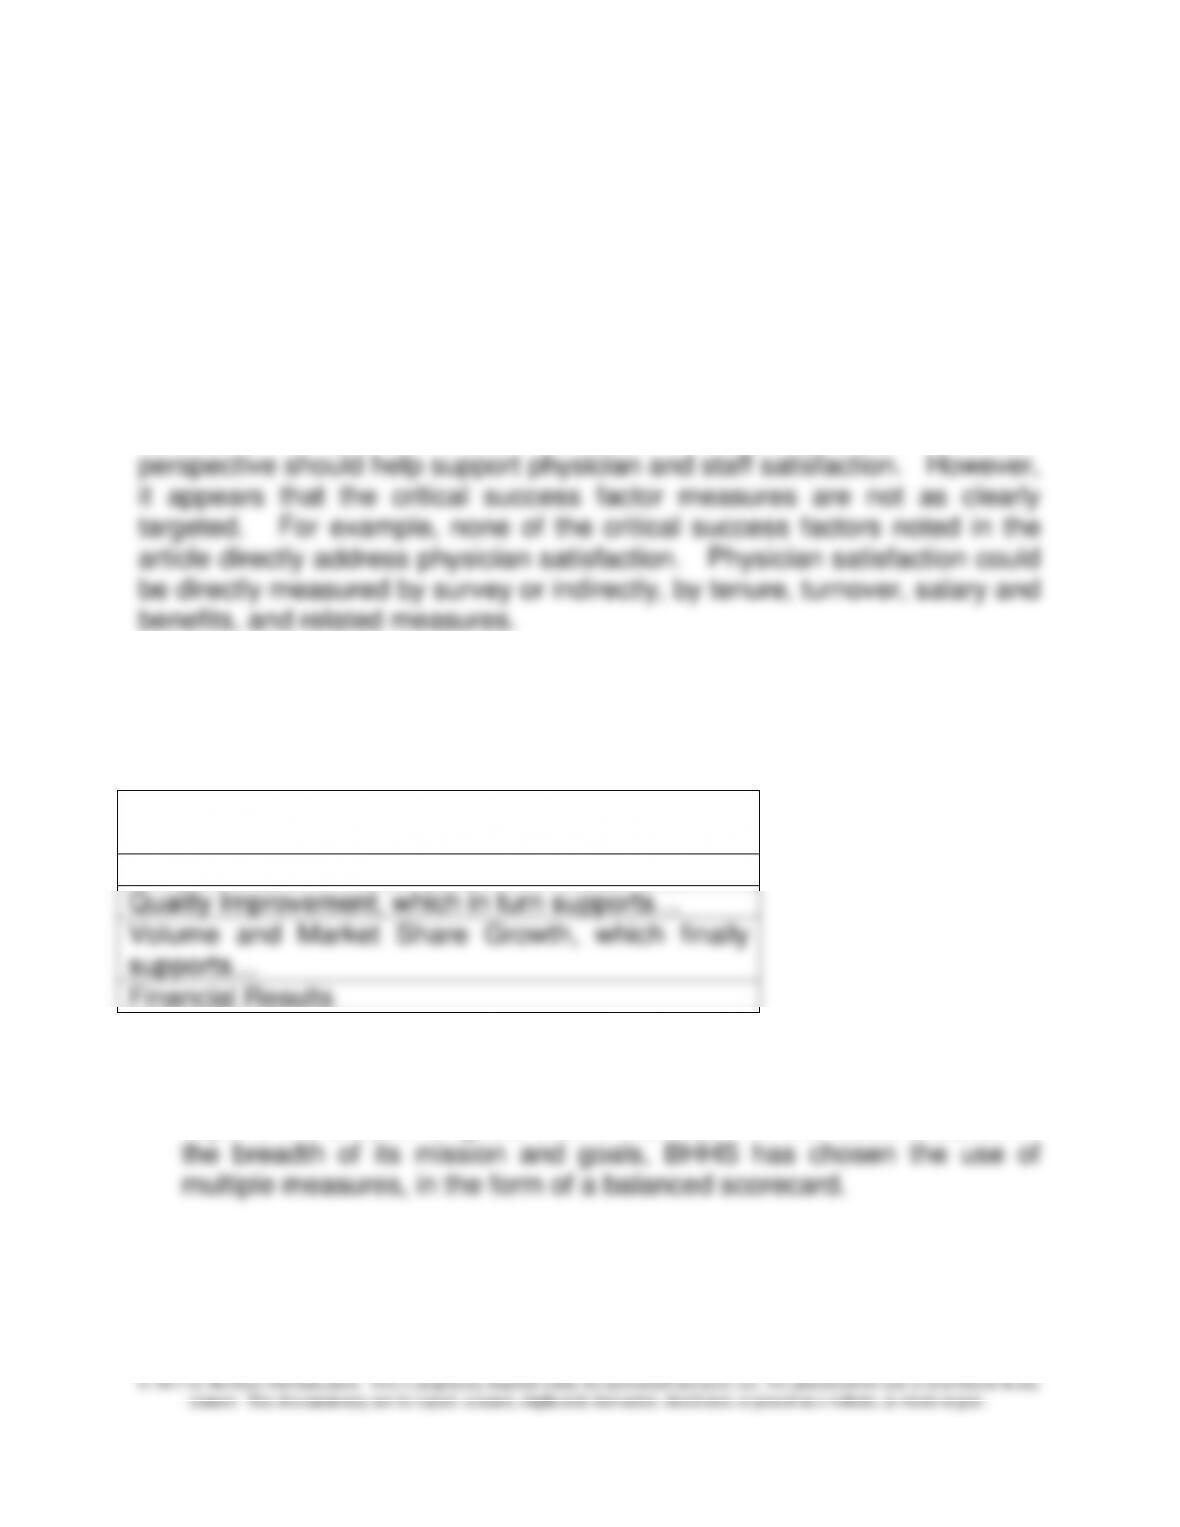
Organization Health, as the foundation of the
strategy map, supports…
Process Improvement, which in turn supports…
Quality Improvement, which in turn supports…
Volume and Market Share Growth, which finally
supports…
Financial Results
5. It is unlikely that a profit center approach alone would be able to
capture the breadth of goals that BHHS has. In this case, because of
Source: “Journey to Destination 2005,” by Andra Gumbus, Bridget Lyons,
and Dorothy E. Bellhouse, Strategic Finance, August 2002, pp. 46-50.
18–77
18–60 Value Streams and Profit Centers (30 min)
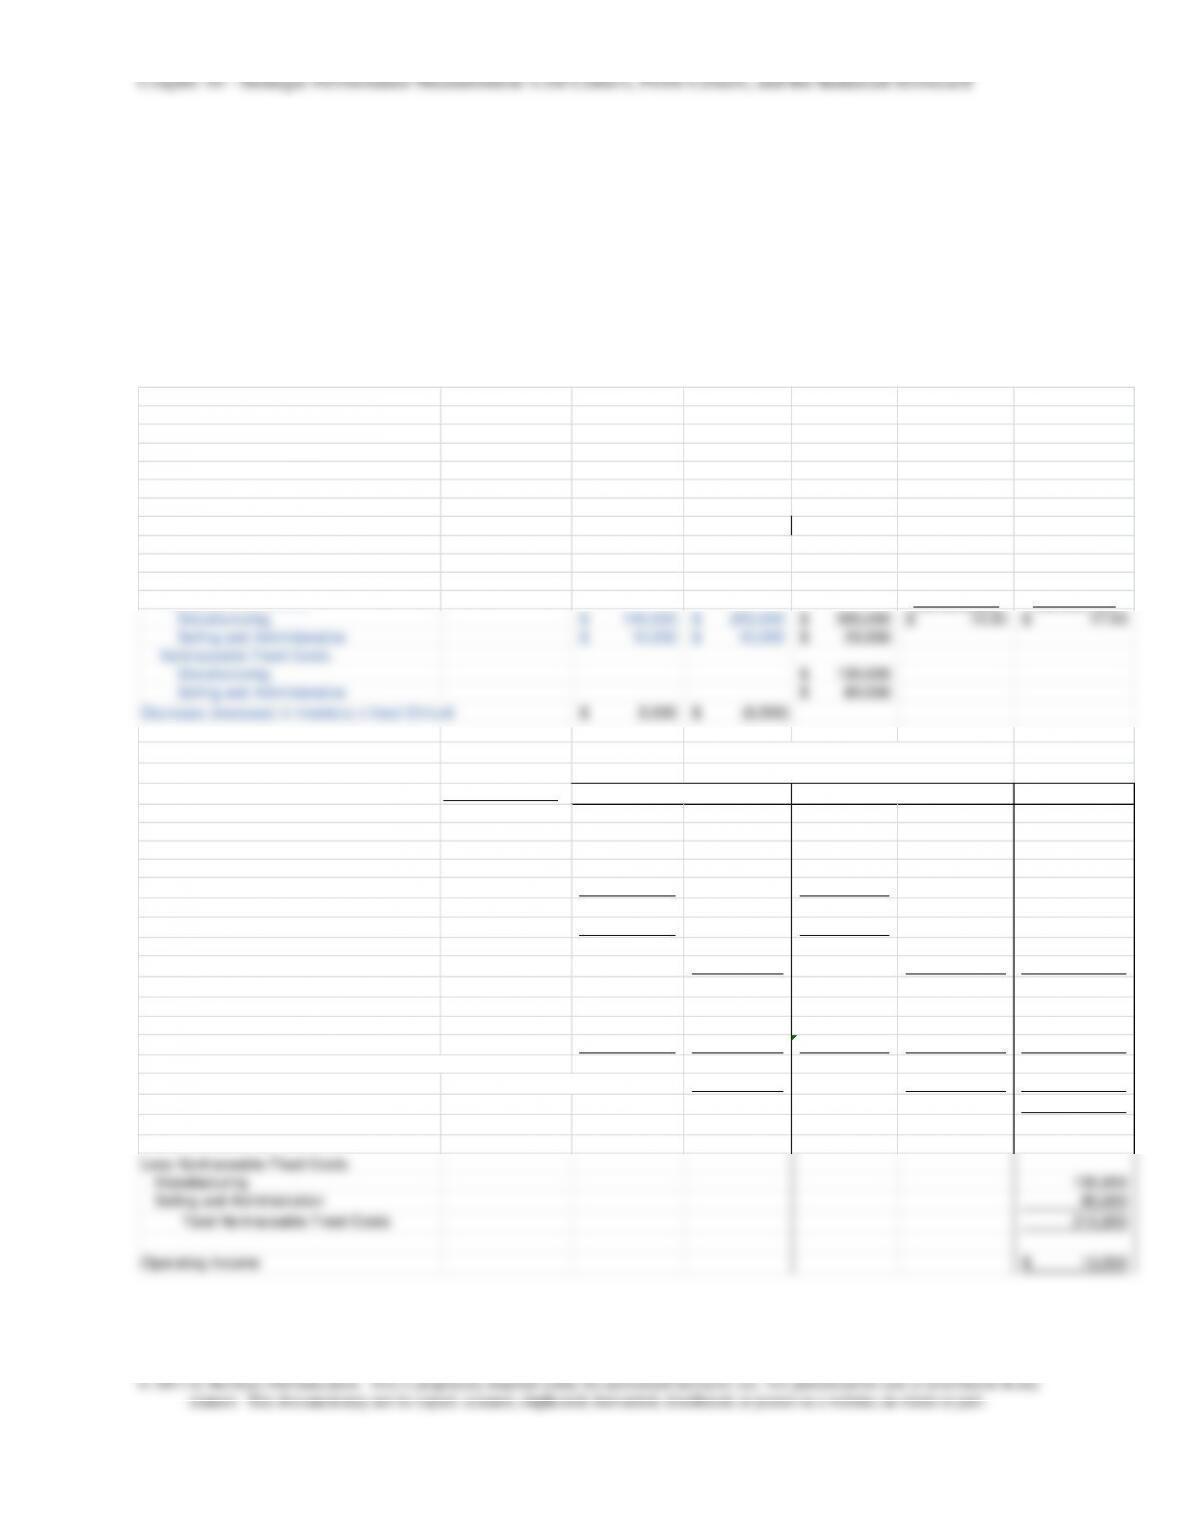
1. The value stream income statements for the two value streams of
Anderson Company is shown below. The value stream income
statement is based on a contribution type income statement (variable
costing-based) to which is added the effect of a change in inventory
level on income, thereby converting the variable costing income
statement to a full cost statement.
Units DVD Group TV Group
Beginning Inventory 200 900
Price 55$ 45$
Sold 13,500 15,500
Actual Production 14,000 15,000
Budgeted Production 14,000 15,000
Ending Inventory 700 400
DVD Group TV Group Total
Unit Variable Costs
Manufacturing 30$ 16$ Traceable Traceable
Selling and Administrative 5$ 5$ Fixed Mfg Cost Fixed MFG Cost
Traceable Fixed Costs Per unit DVD Per unit TV
Manufacturing 140,000$ 255,000$ 395,000$ 10.00$ 17.00$
Selling and Administrative 10,000$ 10,000$ 20,000$
Nontraceable Fixed Costs
Manufacturing 130,000$
Selling and Administrative 80,000$
Decrease (increase) in inventory x fixed OH/unit 5,000$ (8,500)$
Anderson Company
Income Statement
DVD Calculations Total
Sales =13,500 x $55 742,500$ 697,500$ 1,440,000$
Cost of Goods Sold (variable costs only)
Contribution Margin 270,000$ 372,000$ 642,000
Less Traceable Fixed Costs
Manufacturing 140,000 255,000
Selling and Administration 10,000 150,000 10,000 265,000 415,000
Value Stream Income before inventory change 120,000 107,000 227,000
Increase (decrease) in inventory =(700-200) x ($140,000/14,000) 5,000 (8,500) (3,500)
Value Stream Profit 125,000$ 98,500$ 223,500
Less Nontraceable Fixed Costs
Manufacturing 130,000
Selling and Administration 80,000
Total Nontraceable Fixed Costs 210,000
Operating Income 13,500$
DVDs
TVs
Chapter 18 – Strategic Performance Measurement: Cost Centers, Profit Centers, and the Balanced Scorecard
18–78
18–60 (continued –1)
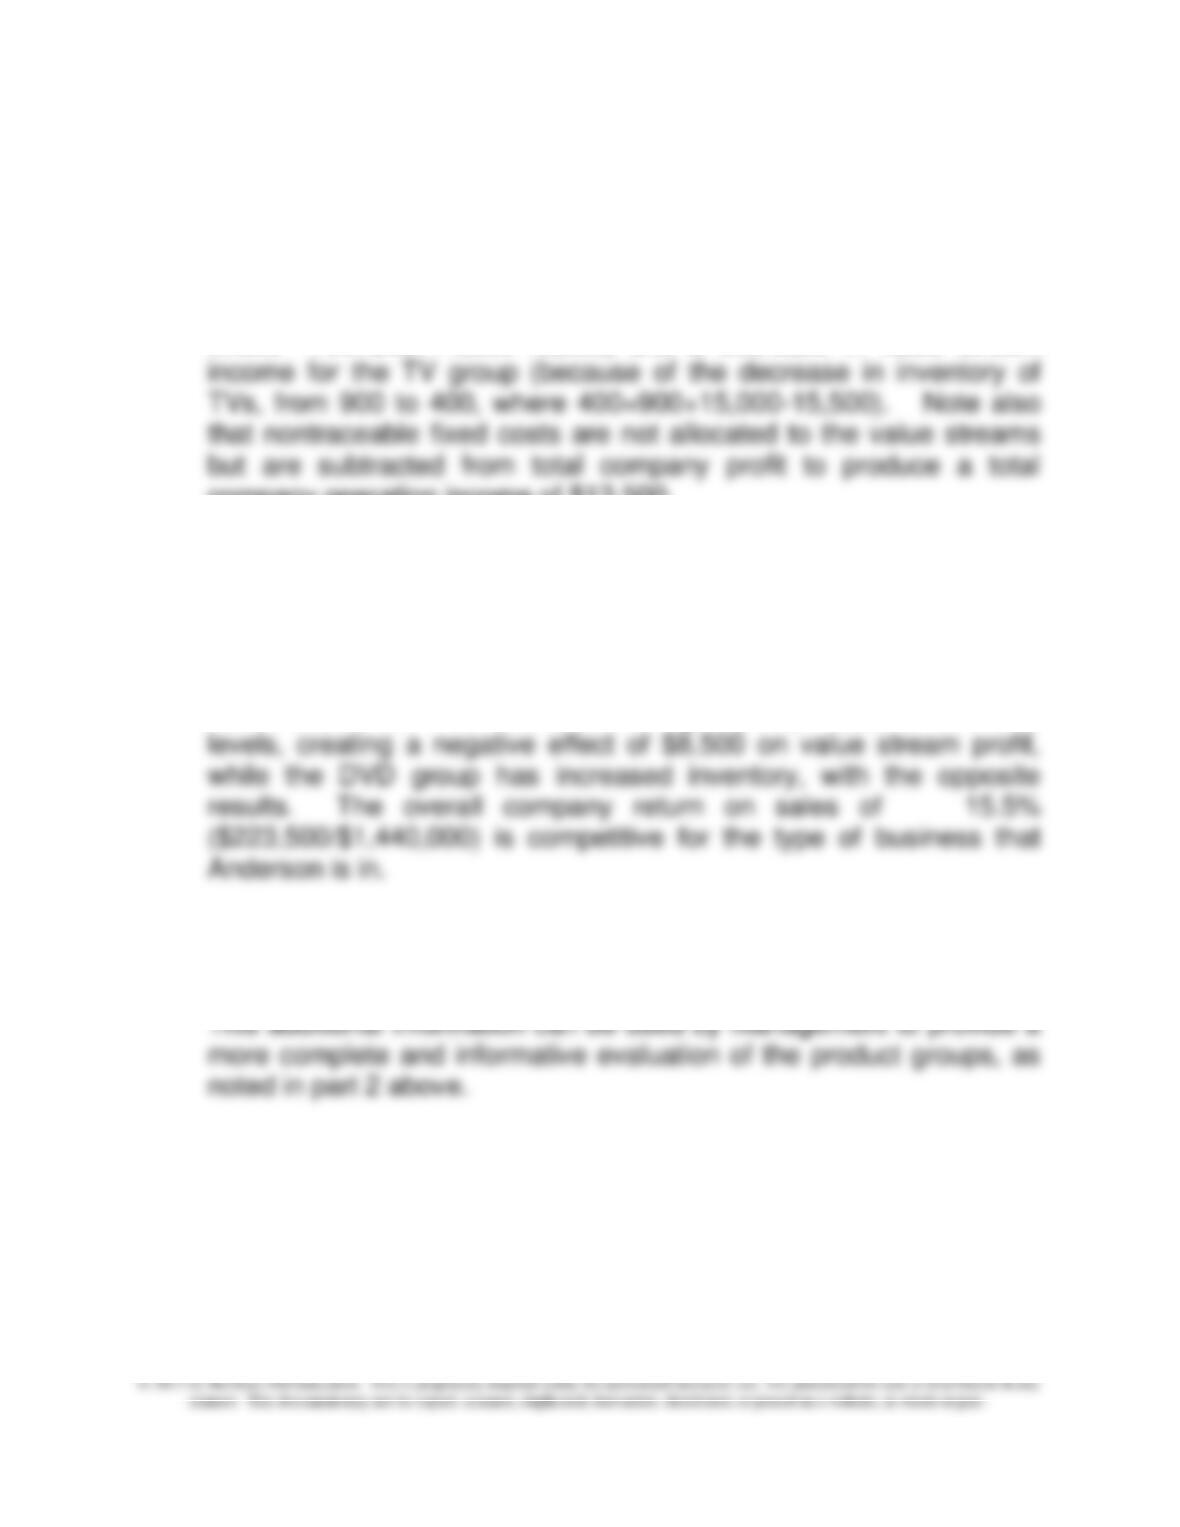
Note that the effect on value stream income of a change in inventory
is displayed separately in the income statement; there is a $5,000
increase in income for the DVD group (because of an increase in
inventory of DVDs; ending inventory increases from 200 to 700,
where 700=200+14,000-13,500) and a decrease in value stream
company operating income of $13,500.
2. The value stream income statements show that both value streams
are profitable though the DVD value stream has a higher value
stream return on sales ($125,000/$742,500 = 16.8%) relative to the
TV value stream ($98,500/$697,500 = 14.1%). One reason for the
lower returns for TVs is that the TV group has reduced inventory
3. The value stream income statement is a combination of the variable
costing and full costing income statement that shows as a separate
line item in the statement the effect of inventory change on income.
For a useful reference on lean accounting and value streams, see:
Frances A. Kennedy and Peter C. Brewer, “Lean Accounting: What’s it All
About,” Strategic Finance, November 2005, pp. 27-34.
Chapter 18 – Strategic Performance Measurement: Cost Centers, Profit Centers, and the Balanced Scorecard
18–79
18–61 Cost Centers; The Finance Function; Spreadsheet Application
(25 min)
The data are for selected countries from the A.T. Kearney 2007 survey.
1. There are a large number of strategies for ranking the countries, so there
are a number of possible rankings. Here are a few ways to develop the
ranking:
1. Sum the three criteria and then rank the countries on this number;
this would be useful if the criteria are equally weighted, though the
financial attractiveness measure would have a slightly larger
weight since it is scored on the range 0-4 while the other two are
scored on a smaller range, 0-3.
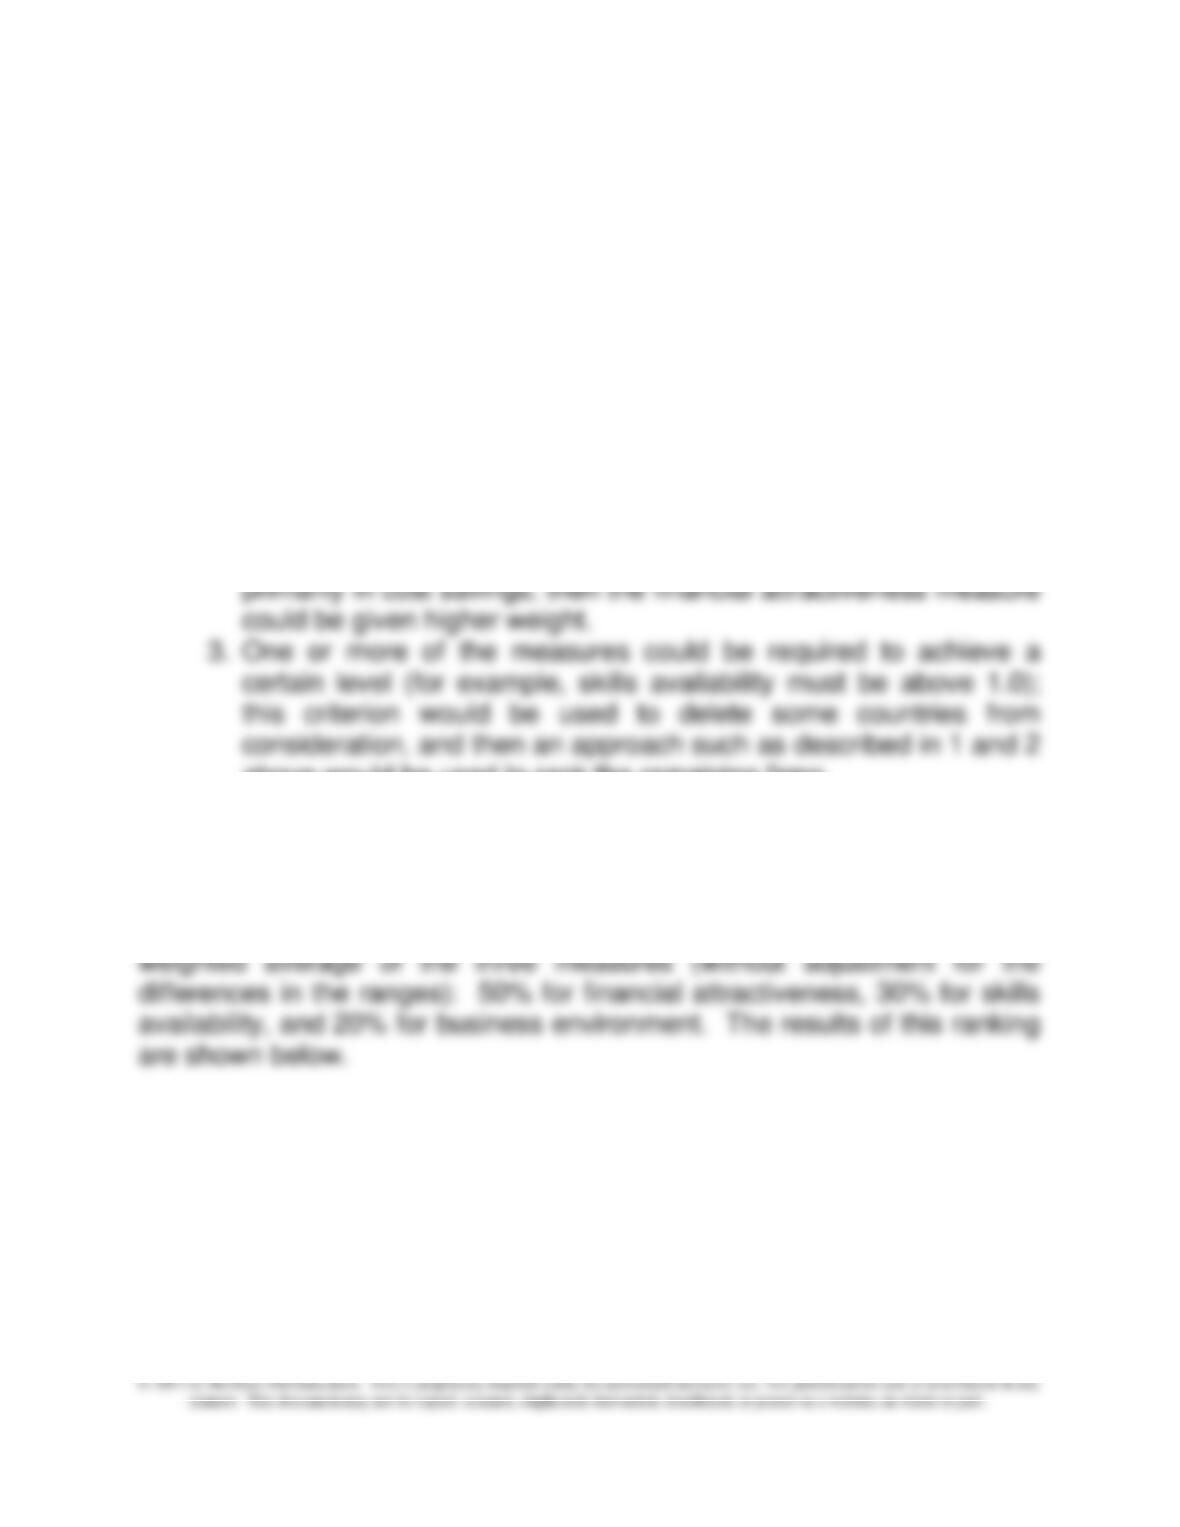
2. Weight the three criteria; for example, if the firm is interested
above would be used to rank the remaining firms.
A variety of different ranking methods are possible. The following ranking is
developed using the approach that is similar to the third approach above.
A country is deleted if business environment is less than 1.5 or skills
availability is less than 1.0. The remaining countries are ranked on the
Chapter 18 – Strategic Performance Measurement: Cost Centers, Profit Centers, and the Balanced Scorecard
18–80
Financial Skills Business Weighted
Attractiveness Availability Environment Score*
China 2.93 2.25 1.38 2.416
Thailand 3.19 1.21 1.62 2.282
Bulgaria 3.16 1.04 1.56 2.204
Malaysia 2.84 1.26 2.02 2.202
Mexico 2.63 1.49 1.61 2.084
Chile 2.65 1.18 1.93 2.065
Slovakia 2.79 1.04 1.79 2.065
Poland 2.59 1.17 1.79 2.004
Czech Republic 2.43 1.10 2.05 1.955
Estonia 2.44 0.96 2.20 1.948
Singapore 1.65 1.51 2.53 1.784
* weight is .5,.3,.2
18–61 (continued –1)
The results show that China is the most highly ranked and Thailand,
Bulgaria and Malaysia are a close second. China’s relatively low scores on
financial attractiveness and business environment are more than made up
for by the highest score on skills availability. A firm should carefully
consider whether the level of skills availability should be the deciding factor
given the high weighting on financial attractiveness and the fact that
Thailand and Bulgaria are the highest on financial attractiveness. Also,
democratically-elected. Also, in 2011 Thailand is suffering from disastrous
flooding. The 2011 measure of business environment might be somewhat
lower than for 2007.
2.
Strategic issues to consider in the potential outsourcing of the finance
function include:
• Before choosing to outsource, the firm must first determine if the
finance function is strategically critical in day-to-day decision making.
This would be true for example if the firm operated in a dynamic,
differentiated market, in which financial analysis was a key part of
18–81
18–61 (continued –2)
function is to pay the bills and record customer payments and the
like, then outsourcing to a reliable, low cost provider makes sense.
• If the decision is made to outsource, then additional measures of the
country’s suitability should be considered. These could include
political stability, availability of high-speed internet support, language,
Reference: Kate O’Sullivan, “Where in the World is Your Offshore Finance
Team?” CFO.com, January 31, 2008. Source cited: A. T. Kearney Global
Services Location Index.

18–82
18–62 Contribution Income Statement for Profit Centers (40 min)
1.
Data Summary:
Total Net Sales ($6,875,000 Hartford; $5,625,000 Boston) 12,500,000$
Fixed Costs
Partly Traceable and Controllable 400,000
Partly Traceable but Noncontrollable
350,000
Nontraceable Costs 325,000
1,075,000
Total Net Sales
Boston 5,625,000$
Hartford Total Sales 6,875,000$
Hartford Clothing 60%
Hartford Cycle&Run 40%
Cost of Goods Sold (Variable) Percent of Sales
Boston 60%
Hartford Clothing 70%
Hartford Cycle&Run 50%
Variable Operating Costs Percent of Sales
Boston 30%
Hartford Clothing 25%
Hartford Cycle&Run 35%
Fixed Noncontrollable Costs Percent of Total Cost
Boston 40%
Hartford Total 50%
Clothing 55%
Cycle&Run 35%
Could not be Traced to Clothing or Cycling at Hartford 10%
Could not be Traced to Boston or Hartford 10%
Chapter 18 – Strategic Performance Measurement: Cost Centers, Profit Centers, and the Balanced Scorecard
18–83
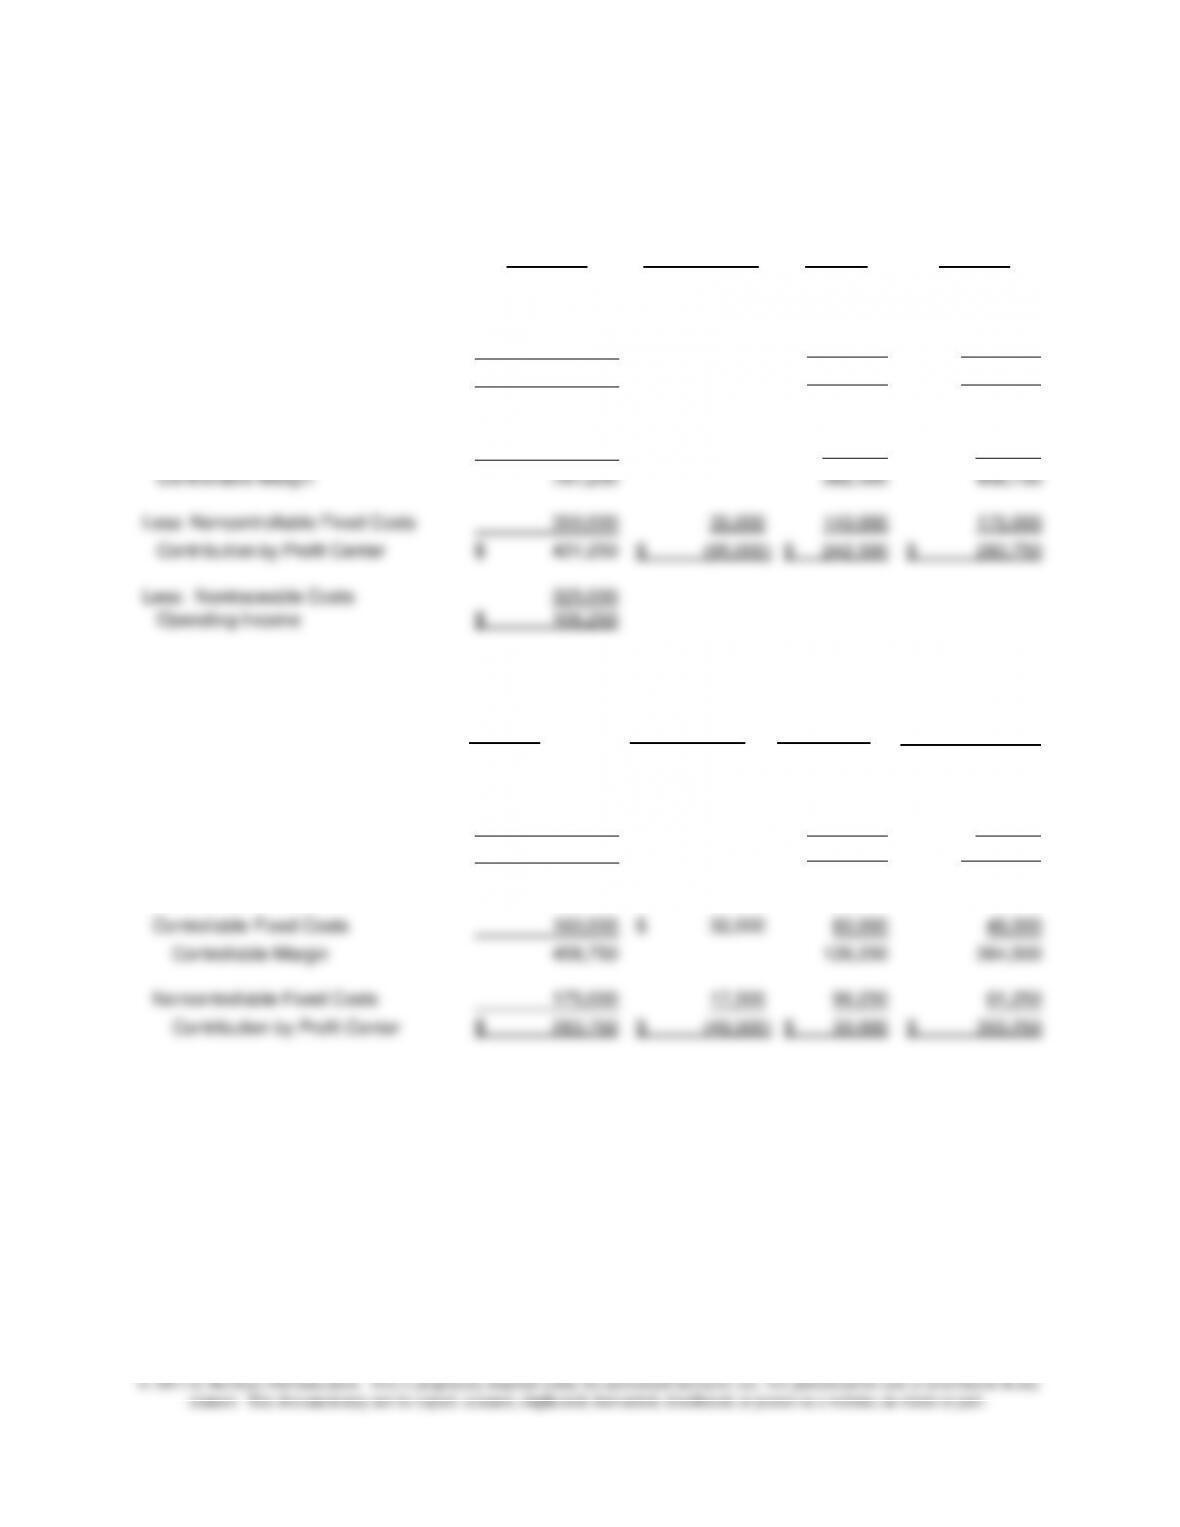
18–62 (continued –1)
Income Statement by Business Unit
Combined
Company Not Allocated Boston Hartford
Net Sales 12,500,000$ 5,625,000$ 6,875,000$
Variable Costs:
COGS 7,637,500 3,375,000 4,262,500
Operating Costs 3,681,250 1,687,500 1,993,750
Total Variable Costs 11,318,750 5,062,500 6,256,250
Contribution Margin 1,181,250 562,500 618,750
Less:Controllable Fixed Costs 400,000 60,000$ 180,000 160,000
Controllable Margin 781,250 382,500 458,750
Less: Noncontrollable Fixed Costs 350,000 35,000 140,000 175,000
Contribution by Profit Center 431,250$ (95,000)
$ 242,500
$ 283,750
$
Less: Nontraceable Costs 325,000
Operating Income 106,250
$
Breakdown of contribution: Hartford
Hartford Not Allocated Clothing Cycle & Run
Net Sales 6,875,000$ 4,125,000$ 2,750,000$
Variable Costs:
COGS 4,262,500 2,887,500 1,375,000
Variable Operating Costs 1,993,750 1,031,250 962,500
Total Variable Costs 6,256,250 3,918,750 2,337,500
Contribution Margin 618,750 206,250 412,500
Controllable Fixed Costs 160,000 32,000$ 80,000 48,000
Controllable Margin 458,750 126,250 364,500
Noncontrollable Fixed Costs 175,000 17,500 96,250 61,250
Contribution by Profit Center 283,750
$ (49,500)
$ 30,000
$ 303,250
$