Chapter 18 – Strategic Performance Measurement: Cost Centers, Profit Centers, and the Balanced Scorecard
18–46
18-45 Balanced Scorecard (15 min)
Solution for problem 2-43, The Tartan Corporation.
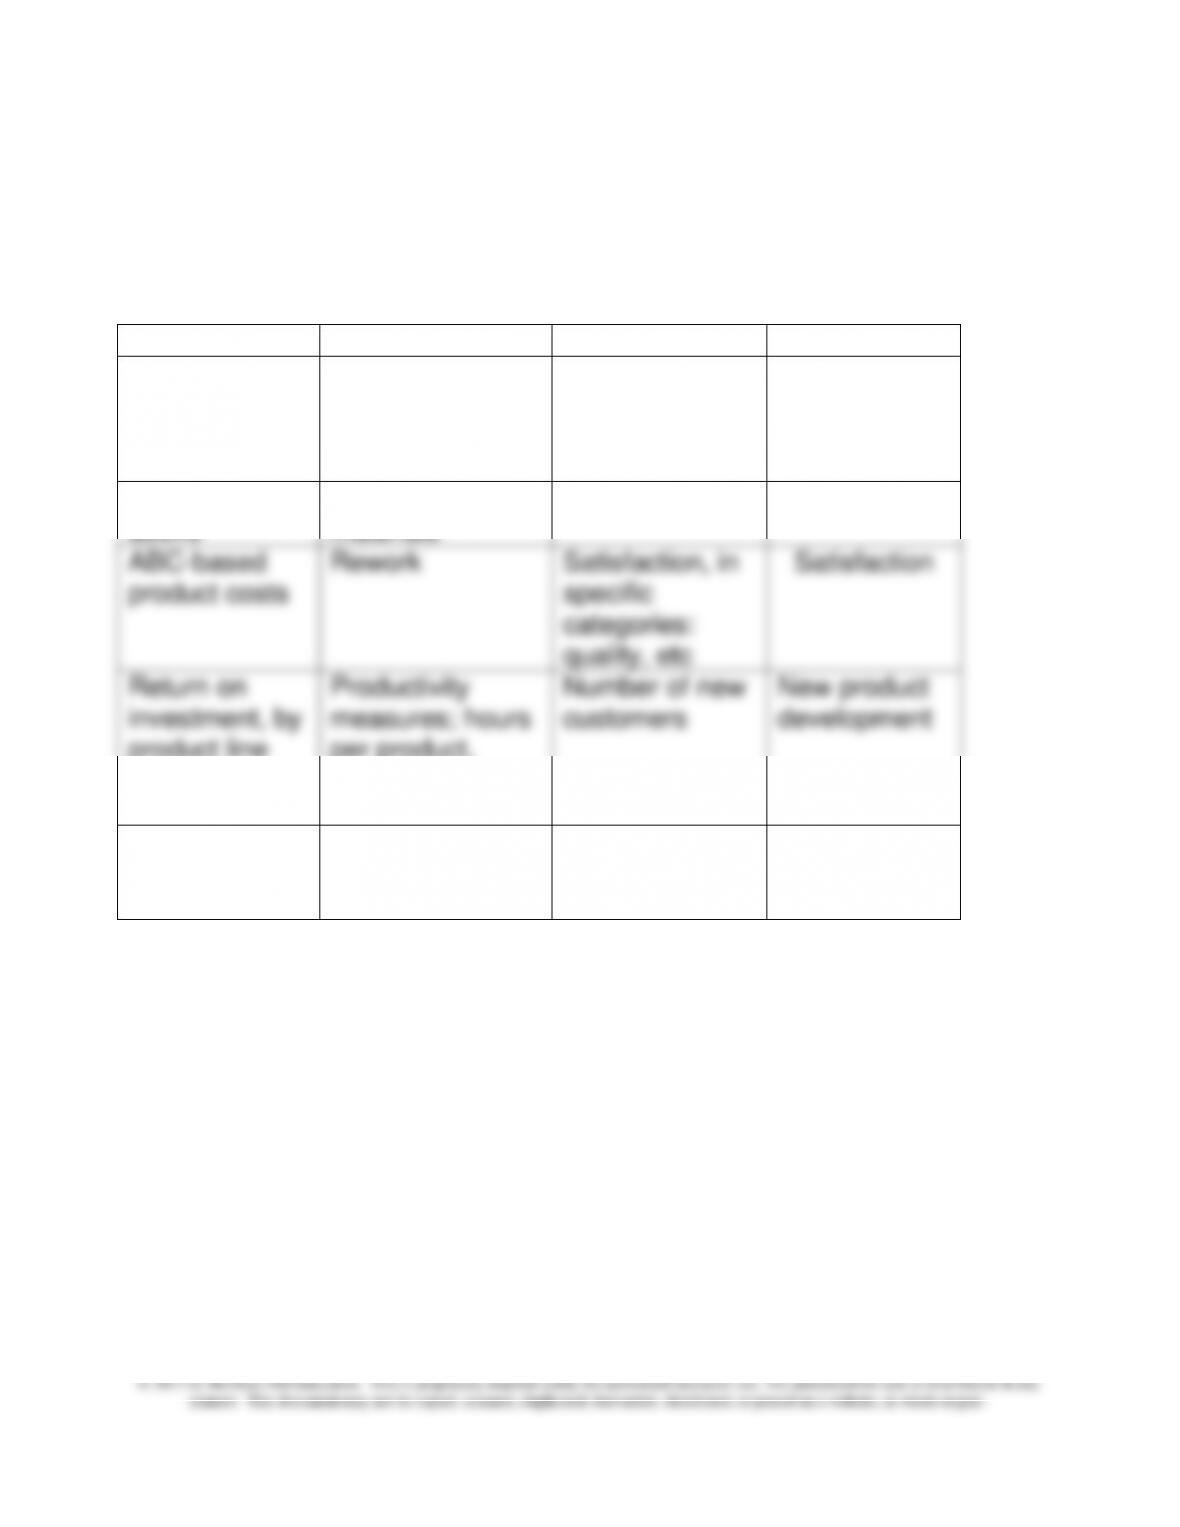
An example of a balanced scorecard for Tartan Corp follows:
Financial
Internal
Customer
Employee
Sales, sales
growth, by
product and
region
Cycle time
Lead time
Training hours
Earnings, as
above
Waste of
materials
Retention
Retention
ABC-based
product costs
Rework
Satisfaction, in
specific
categories:
quality, etc
Satisfaction
Return on
investment, by
product line
Productivity
measures; hours
per product,
materials per
product
Number of new
customers
New product
development
New
investment, by
product line
Inventory levels
Employee
suggestions
Chapter 18 – Strategic Performance Measurement: Cost Centers, Profit Centers, and the Balanced Scorecard
18–47
PROBLEMS
18-46 Profit Center Limitations (25 min)
This question is intended primarily for class discussion. The objective
of the question is to have the class understand and discuss some of the
key limitations of the profit center approach for strategic performance
measurement, and to understand some of the methods for addressing
these limitations. The question will work best if the class has some prior
experience in either intermediate accounting, financial statement
analysis, or both. The Merchant and Sandino article is one of many that
have addressed the limitations of profit centers over the years, and it is
one of my favorites. Instructors may have their own favorite in this
regard, and could add their own favorite reading assignment on the topic
as part of the class assignment for this question,
1. Merchant and Sandino (especially in the full article) present a solid
case for moving away from the pure profit center evaluation, and
incorporating one or more of their four suggested approaches for
addressing the problem. Students who have had a solid financial
accounting background including for example, the financial
Chapter 18 – Strategic Performance Measurement: Cost Centers, Profit Centers, and the Balanced Scorecard
18–48
18-46 (continued –1)
Other GAAP issues include differences between profit centers in:
a) Judgments of the allowance for bad debts
b) Inventory valuation (FIFO vs LIFO or other method)
g) The effect of judgment in choosing the method for cost allocation
when profit centers share a common resource or service
h) Accounting for leases
The use of a contribution type of income statement as explained in
the chapter can provide an improvement over full cost-based profit
since it incorporates the concepts of traceability and controllability.
If the instructor wishes, this problem provides a good opportunity to
discuss the relationship between GAAP and IFRS and the potential
impact of the convergence of GAAP to IFRS on performance
measurement, particularly of profit centers. As noted in the chapter,
these difference include differences in inventory valuation (no LIFO
Chapter 18 – Strategic Performance Measurement: Cost Centers, Profit Centers, and the Balanced Scorecard
18–49
18-46 (continued -2)
2. The proposals fit solidly within the range of proposals made by many
authors in performance management (management control systems),
financial statement analysis, and cost management. In particular the
and urgency to the proposal for a market oriented approach for
performance measurement is the on-going consideration at the SEC
of the convergence of U.S. GAAP and International Financial
Reporting Standards. International reporting standards have a much
stronger focus on market value, allowing under certain conditions for
long-lived assets to be measured at market value, and for research
and development costs to be capitalized, in contrast to the more
conservative cost-based approach for long-lived assets and expense-
based approach to R&D in U.S. GAAP.
Chapter 18 – Strategic Performance Measurement: Cost Centers, Profit Centers, and the Balanced Scorecard
18–50
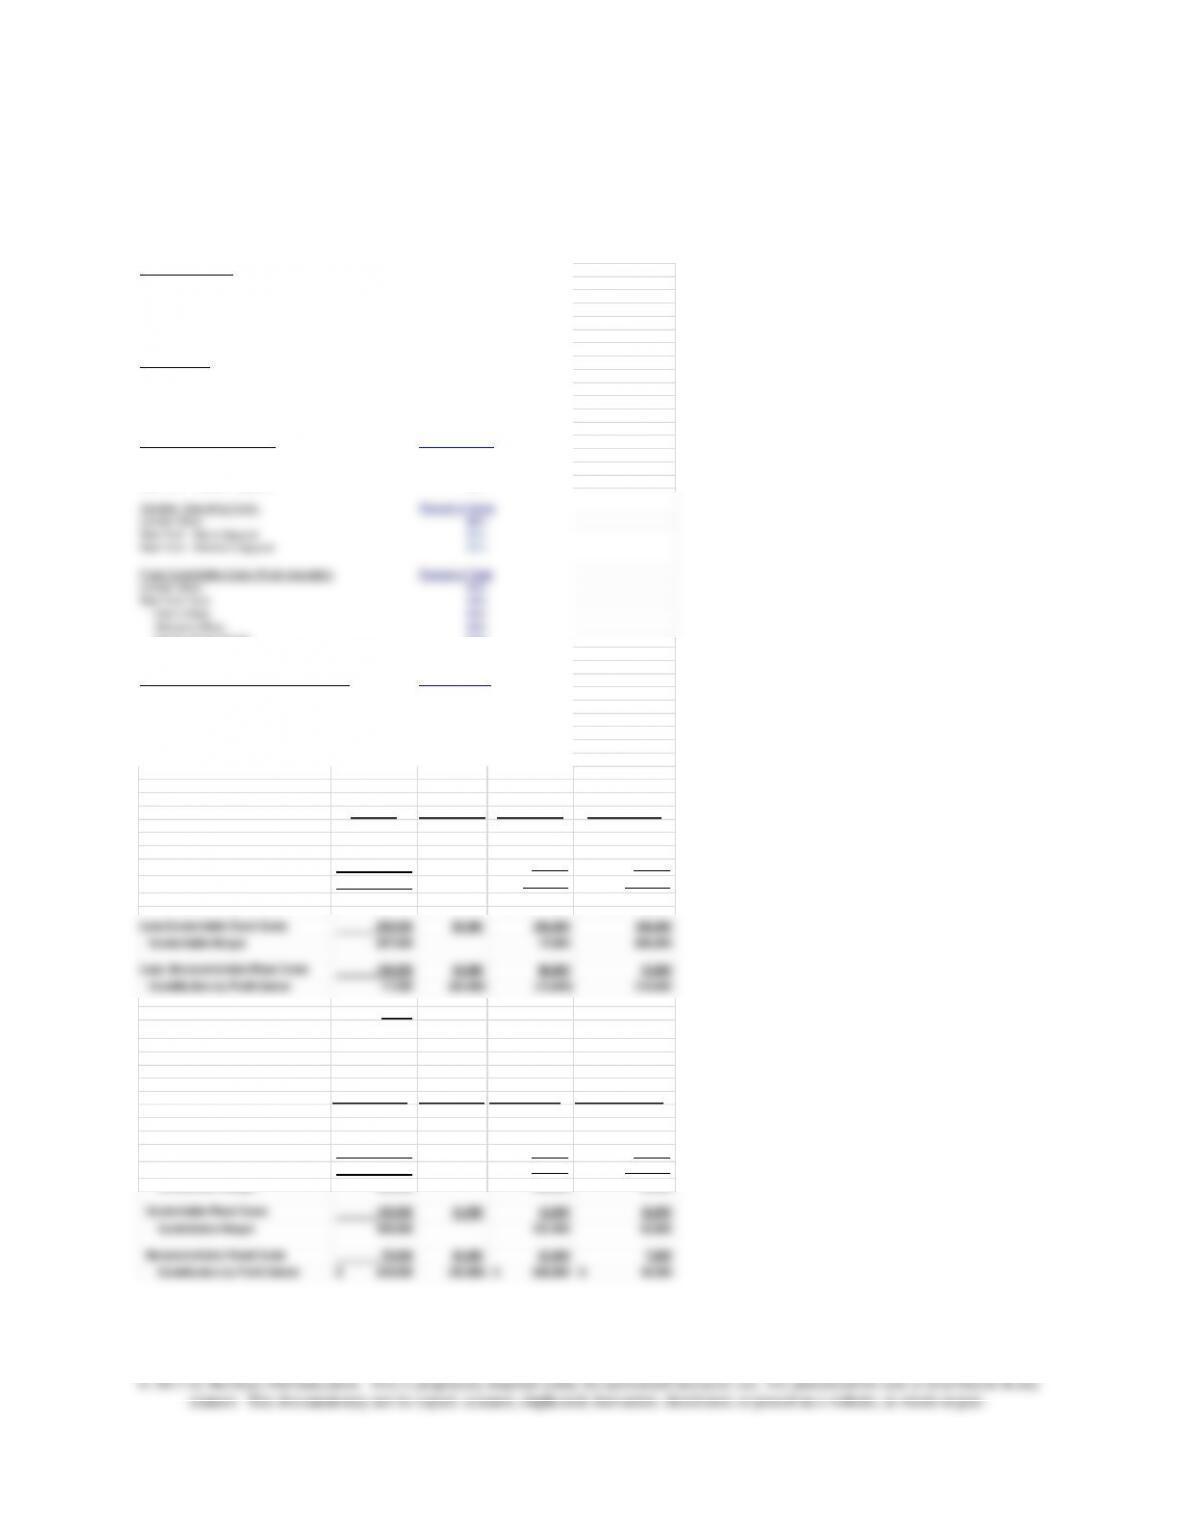
18–47 Contribution Income Statement; Excel Application(25 min)
Data (in thousands)
Total Net Sales 3,250,000$
Fixed Costs
Partly Traceable and Controllable 250,000
Partly Traceable but Noncontrollable 180,000
Nontraceable Costs 65,000
Total Net Sales
London Store 40%
New York Store 60%
New York – Men’s Apparel 40%
New York – Women’s Apparel 60%
Cost of Goods Sold (Variable) Percent of Sales
London Store 55%
New York – Men’s Apparel 40%
New York – Women’s Apparel 60%
Variable Operating Costs Percent of Sales
London Store 36%
New York – Men’s Apparel 22%
New York – Women’s Apparel 32%
Fixed Controllable Costs (Partly traceable) Percent of Total
London Store 40%
New York Total 40%
– Men’s Wear 45%
-Women’s Wear 40%
-Could not be Traced 15%
Could not be Traced to London or New York 20%
Fixed Noncontrollable Costs (Partly traceable) Percent of Total
London Store 50%
New York Total 40%
-Could not be Traced to Men or Women’s Wear 60%
-Men’s Wear 30%
-Women’s Wear 10%
Total Variable Costs 2,743,000 1,183,000 1,560,000
Contribution Margin 507,000 117,000 390,000
Less:Controllable Fixed Costs 250,000 50,000 100,000 100,000
Controllable Margin 257,000 17,000 290,000
Less: Noncontrollable Fixed Costs 180,000 18,000 90,000 72,000
Contribution by Profit Center 77,000 (68,000) (73,000) 218,000
Less: Nontraceable Costs 65,000
Operating Income 12,000$
Breakdown for the New York Store
New York Store Not Allocated – Men’s Wear -Women’s Wear
Net Sales 1,950,000$ 780,000$ 1,170,000$
Variable Costs:
COGS 1,014,000 312,000 702,000
Variable Operating Costs 546,000 171,600 374,400
Noncontrollable Fixed Costs 72,000 43,200 21,600 7,200
Contribution by Profit Center 218,000$ (58,200) 229,800$ 46,400$

Chapter 18 – Strategic Performance Measurement: Cost Centers, Profit Centers, and the Balanced Scorecard
18–51
18-47 (continued –1)
The formulas for the above spreadsheet are as follows:
Data (in thousands)
Total Net Sales 3250000
Fixed Costs
Partly Traceable and Controllable 250000
Partly Traceable but Noncontrollable 180000
Nontraceable Costs 65000
Total Net Sales
London Store 0.4
New York Store 0.6
New York – Men’s Apparel 0.4
New York – Women’s Apparel 0.6
Cost of Goods Sold (Variable) Percent of Sales
London Store 0.55
New York – Men’s Apparel 0.4
New York – Women’s Apparel 0.6
Variable Operating Costs Percent of Sales
London Store 0.36
New York – Men’s Apparel 0.22
New York – Women’s Apparel 0.32
Fixed Controllable Costs (Partly traceable) Percent of Total
London Store 0.4
New York Total 0.4
– Men’s Wear 0.45
-Women’s Wear 0.4
-Could not be Traced to Men’s or Women’s 0.15
Could not be traced to New York or London 0.2
Variable Costs:
COGS =D45+E45 =D43*C15 =((C11*C16)+(C12*C17))*E43
Operating Costs =D46+E46 =C20*D43 =((C11*C21)+(C12*C22))*E43
Total Variable Costs =D47+E47 =(D45+D46) =(E45+E46)
Contribution Margin =D48+E48 =(D43-D45-D46) =(E43-E45-E46)
Less:Controllable Fixed Costs =C4 =C4*C30 =C4*C25 =C4*C26
Controllable Margin =B48-B50 =(D48-D50) =(E48-E50)
Less: Noncontrollable Fixed Costs =C5 =C5*C38 =C5*C33 =C5*C34
Contribution by Profit Center =B51-B53 =B54-D54-E54 =(D51-D53) =(E51-E53)
Less: Nontraceable Costs =C6
Net Income =B54-B56
Breakdown for the New York Store
=A10 Not Allocated =A27 =A28
Net Sales =E43 =E43*C11 =E43*C12
Variable Costs:
COGS =E45 =C16*D63 =C17*E63
Variable Operating Costs =E46 =C21*D63 =C22*E63
Noncontrollable Fixed Costs =E53 =C35*B73 =C36*B73 =C37*B73
Contribution by Profit Center =E54 =B74-D74-E74 =(D71-D73) =(E71-E73)
Chapter 18 – Strategic Performance Measurement: Cost Centers, Profit Centers, and the Balanced Scorecard
18–52
18-47 (continued -2)
2. The global issues for High Fashion include foreign currency
translation, as the U.S. dollar fluctuates relative the U.K. pound. For
example, the U.S. dollar increased in value approximately 25%
relative to the pound during 2008 but the two currencies have been
relatively stable since then (as of April 2012). The higher value of the
net effect of the currency change is hard to determine, but it is
important for the company to anticipate an effect on income as a
result of any currency fluctuation.
Other global issues include the state of the economies of the
different countries where High Fashion is doing business. In 2011
and early 2012, the U.K. was in recession and the U.S. economy
was very weak. Economists in mid-2011 had not stated clearly
in the types of clothing carried at the various locations, the hours the
stores are open, and new product offerings, among other measures.
In keeping with the principles of strategic performance measurement
and decentralization, the local store managers should have discretion
in how they respond to the declining economy. The profit center is a
useful tool overall for evaluating performance, but given the economic
changes, the firm should broaden its approach to evaluation to
Chapter 18 – Strategic Performance Measurement: Cost Centers, Profit Centers, and the Balanced Scorecard
18–53
18–48 Allocating the Costs of the Legal Department(20 min)
The discussion here is based in part on the article cited below.
The question about allocation of legal department costs raises a number of
key issues which will likely arise in the discussion of the case:
• can legal costs be traced to SBUs that caused or used the legal
assistance?
• are legal costs controllable?
• what is the effect on SBU managers’ behavior and motivation if the
firm allocates legal costs based on revenues, total assets, or some
other measure of size?
• what is the effect on SBU’s managers’ behavior and motivation if the
firm allocates legal costs on the basis of usage?
• what is the effect on SBU’s managers’ behavior and motivation if the
firm treats the legal department as a profit SBU, and allows the other
units to obtain legal services within the firm or to purchase them from
outside legal counsel?
• why not outsource the legal function?
In addressing these questions, some students will argue that the use of
revenues or assets (or any other measure of size) to allocate the legal
costs is arbitrary, and will have hopefully no effect on motivation or
employees to seek legal advice (particularly in regard to compliance with
Sarbanes-Oxley Act’s requirements for a code of ethics and related
requirements), and that it would not provide the experience and continuous
oversight that can be provided by an in-house staff.
18–54
18–48 (continued -1)
Allocating legal costs on the basis of usage raises the question of whether
the legal issues involved are controllable by the units. If so, then this
ethical climate within the firm.
Resource: Bruce R. Gerhardt, “Who Should Pay for In–house Lawyers,”
Cost Management, August 2005, pp. 21-24.
18–55
18–49 Validating the Balanced Scorecard; Spreadsheet Application
(35 min)
1. The balanced scorecard is a more comprehensive approach to
strategic performance measurement. In addition to profit, it includes
measures of performance also for customer service, operational
performance, and improvements in and contributions from operating
personnel.
2. The correlation matrix for the data are shown below. Some
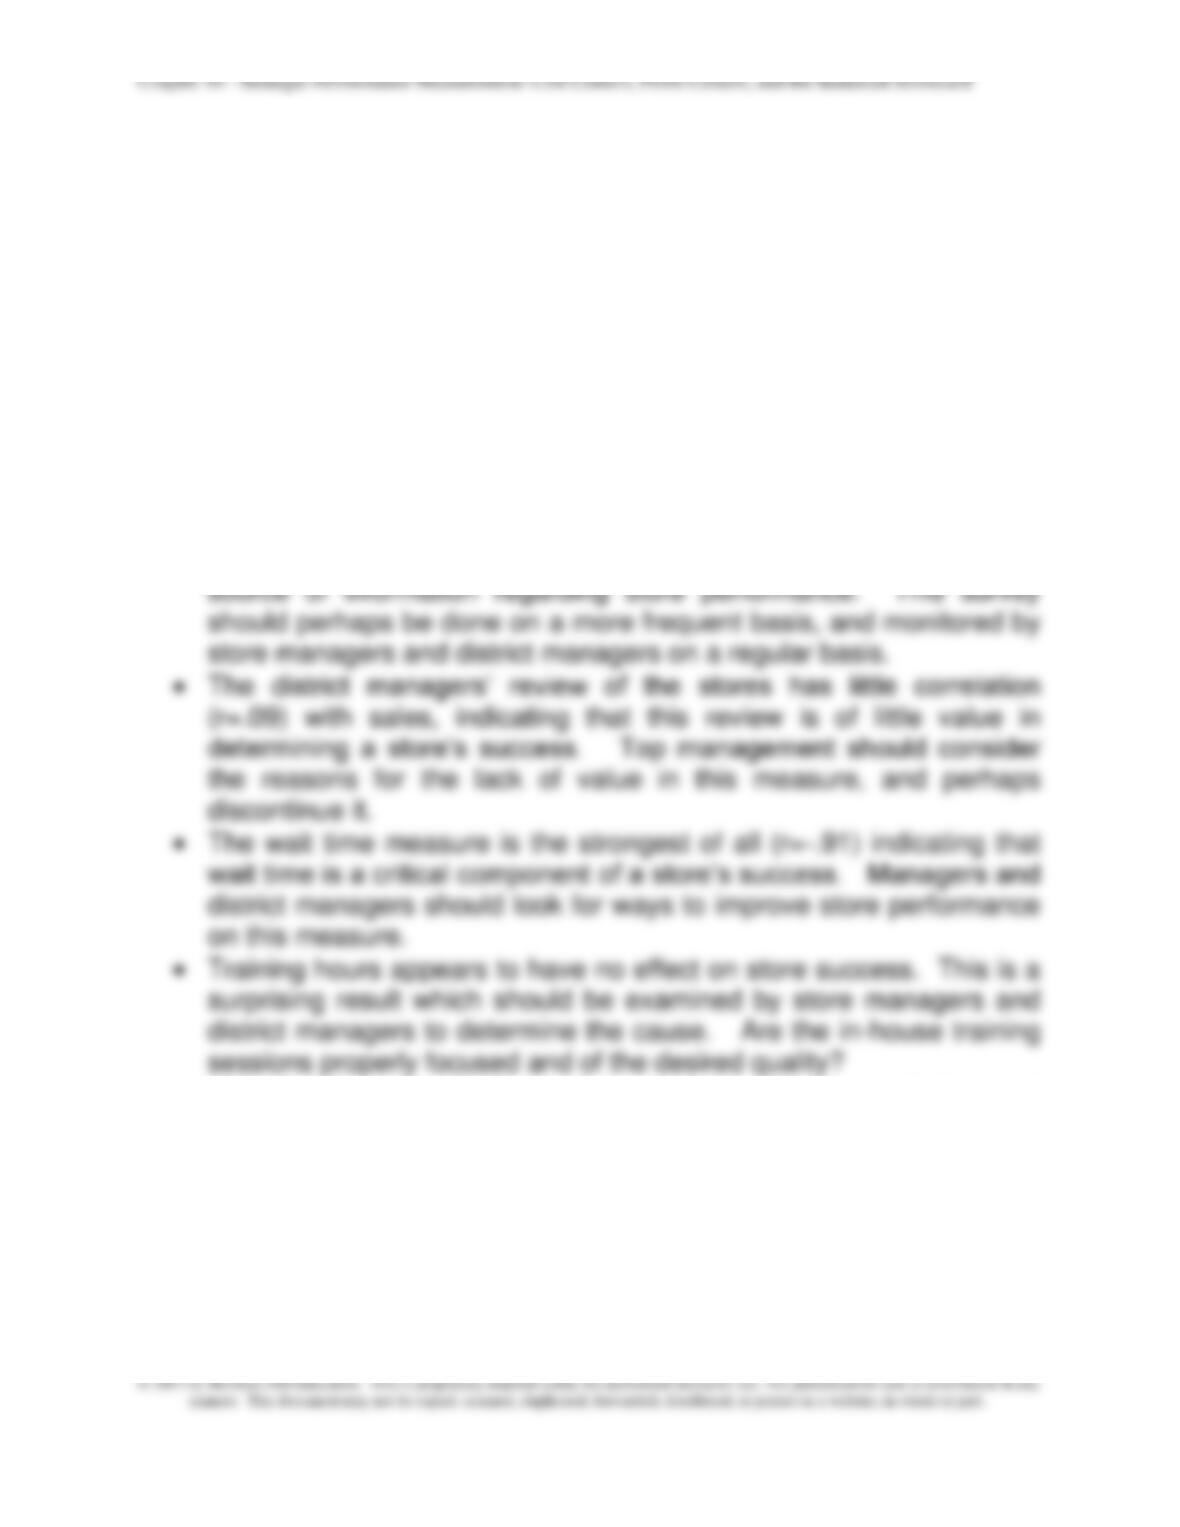
observations are as follows:
• There is a high correlation (r= .88) on the customer survey data with
the sales increase variable, indicating that the survey is a valuable
• Note that there is a high negative correlation between wait time and
customer survey results, as expected from the above observations.
Wait time is a key factor for customers, and appears to figure
significantly in their survey responses.
• There is an indication that some of the older stores are the poorest
performers. Is this due to location or lack up updating in product and
facilities. What is behind this finding?
Chapter 18 – Strategic Performance Measurement: Cost Centers, Profit Centers, and the Balanced Scorecard
18–56
18–49 (continued -1)
The change in sales at each of the stores is driven by a number of factors
in addition to those in the analysis shown here. For example, the
economic environment at each store could be changing for better or worse.
Also, a given store might be impacted by the opening or closing of a
competitive store in its area. A full validation study would attempt to
capture as many of these additional variable as possible.
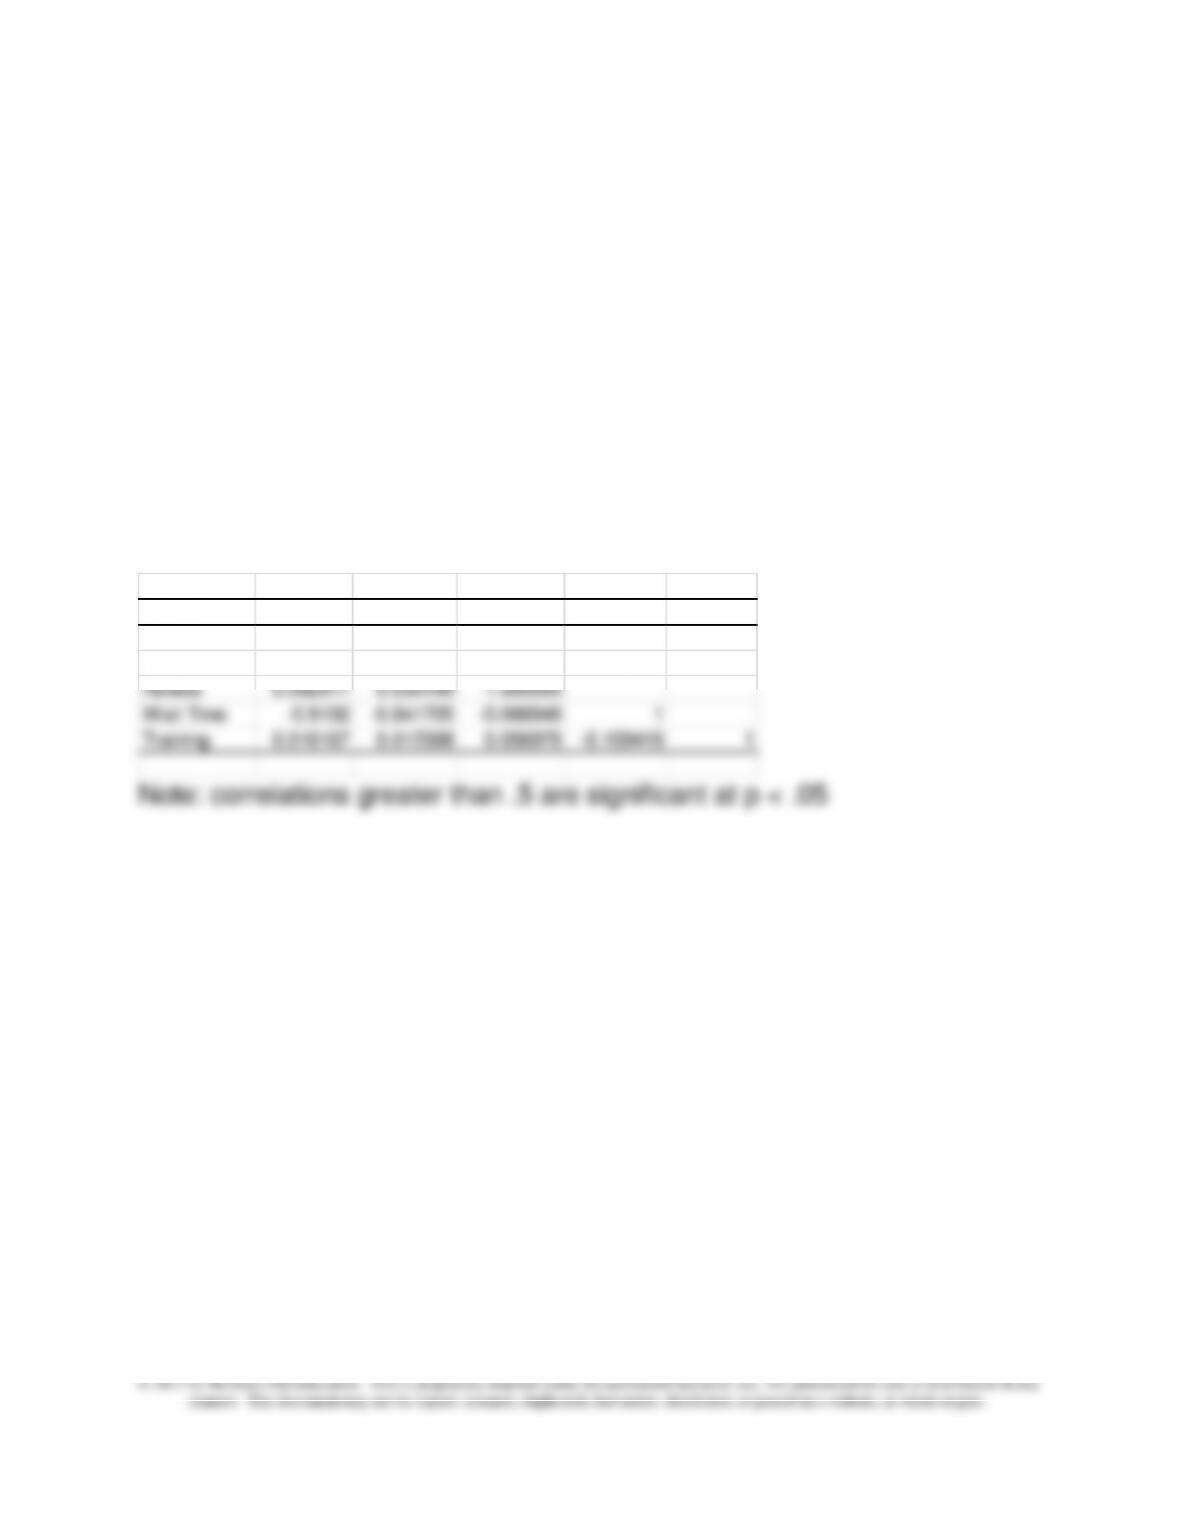
The correlations results for the data:
Sales Survey Review Wait Time Training
Sales 1
Survey 0.882604 1
Review 0.092917 0.030199 1.000000
Wait Time -0.9102 -0.841705 –0.066946 1
Training 0.016167 0.012398 0.056979 -0.109419 1
Note: correlations greater than .5 are significant at p < .05
Chapter 18 – Strategic Performance Measurement: Cost Centers, Profit Centers, and the Balanced Scorecard
18–57
18-50 Contribution Income Statement for Profit Centers; Strategy;
International (60 min)
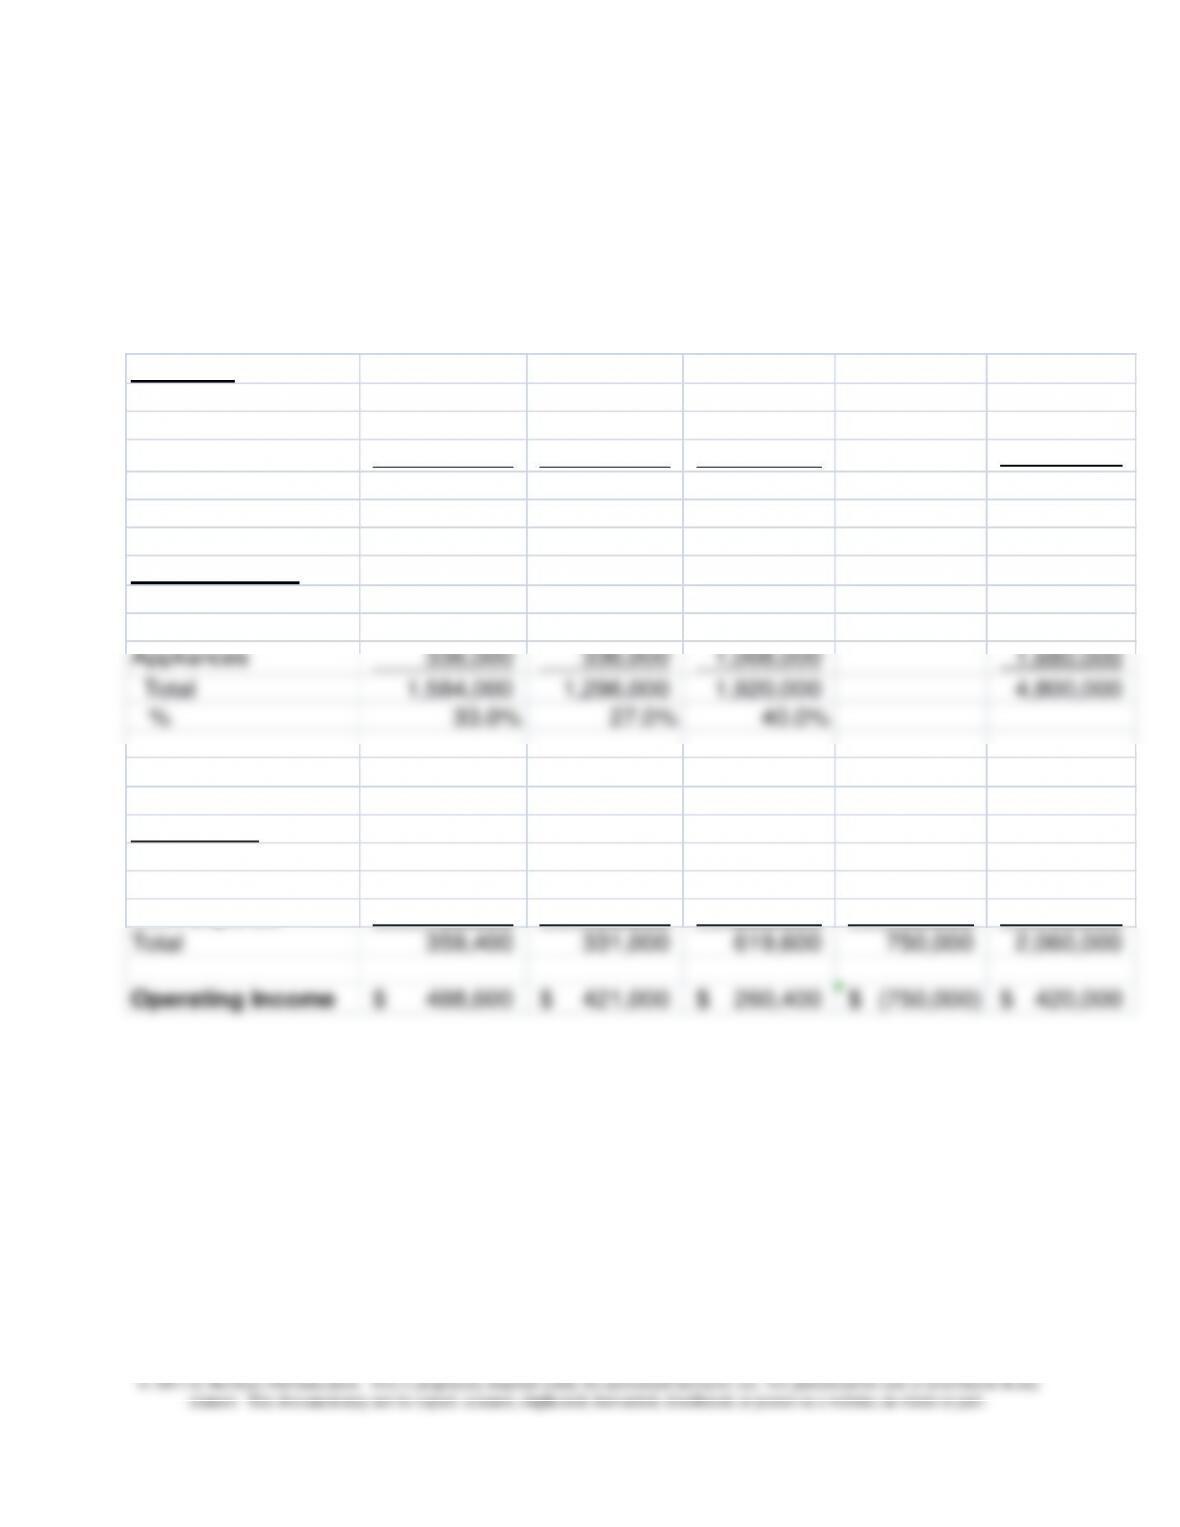
1. Stratford Corporation
Statement of Income by Geographic Area
For the Fiscal Year Ended April 30, 2013
Revenue U.S. Canada Europe
Unallocated
Total
Pharmaceutical 512,000$ 128,000$ 640,000$ 1,280,000$
Sports 1,440,000 1,440,000 720,000 3,600,000
Appliances 480,000 480,000 1,440,000 2,400,000
Total 2,432,000 2,048,000 2,800,000 7,280,000
Variable Costs
Pharmaceutical 384,000 96,000 480,000 960,000
Sports 864,000 864,000 432,000 2,160,000
Appliances 336,000 336,000 1,008,000 1,680,000
Total 1,584,000 1,296,000 1,920,000 4,800,000
% 33.0% 27.0% 40.0%
Contribution Margin
848,000 752,000 880,000 2,480,000
Fixed Costs
Factory Overhead 165,000 135,000 200,000 500,000
Depreciation 134,400 96,000 169,600 400,000
GSA Expense 60,000
100,000
250,000
750,000
1,160,000
Total 359,400 331,000 619,600 750,000 2,060,000
Operating Income 488,600$ 421,000$ 260,400$ (750,000)$ 420,000$
Chapter 18 – Strategic Performance Measurement: Cost Centers, Profit Centers, and the Balanced Scorecard
18–58
18-50 (continued -1)
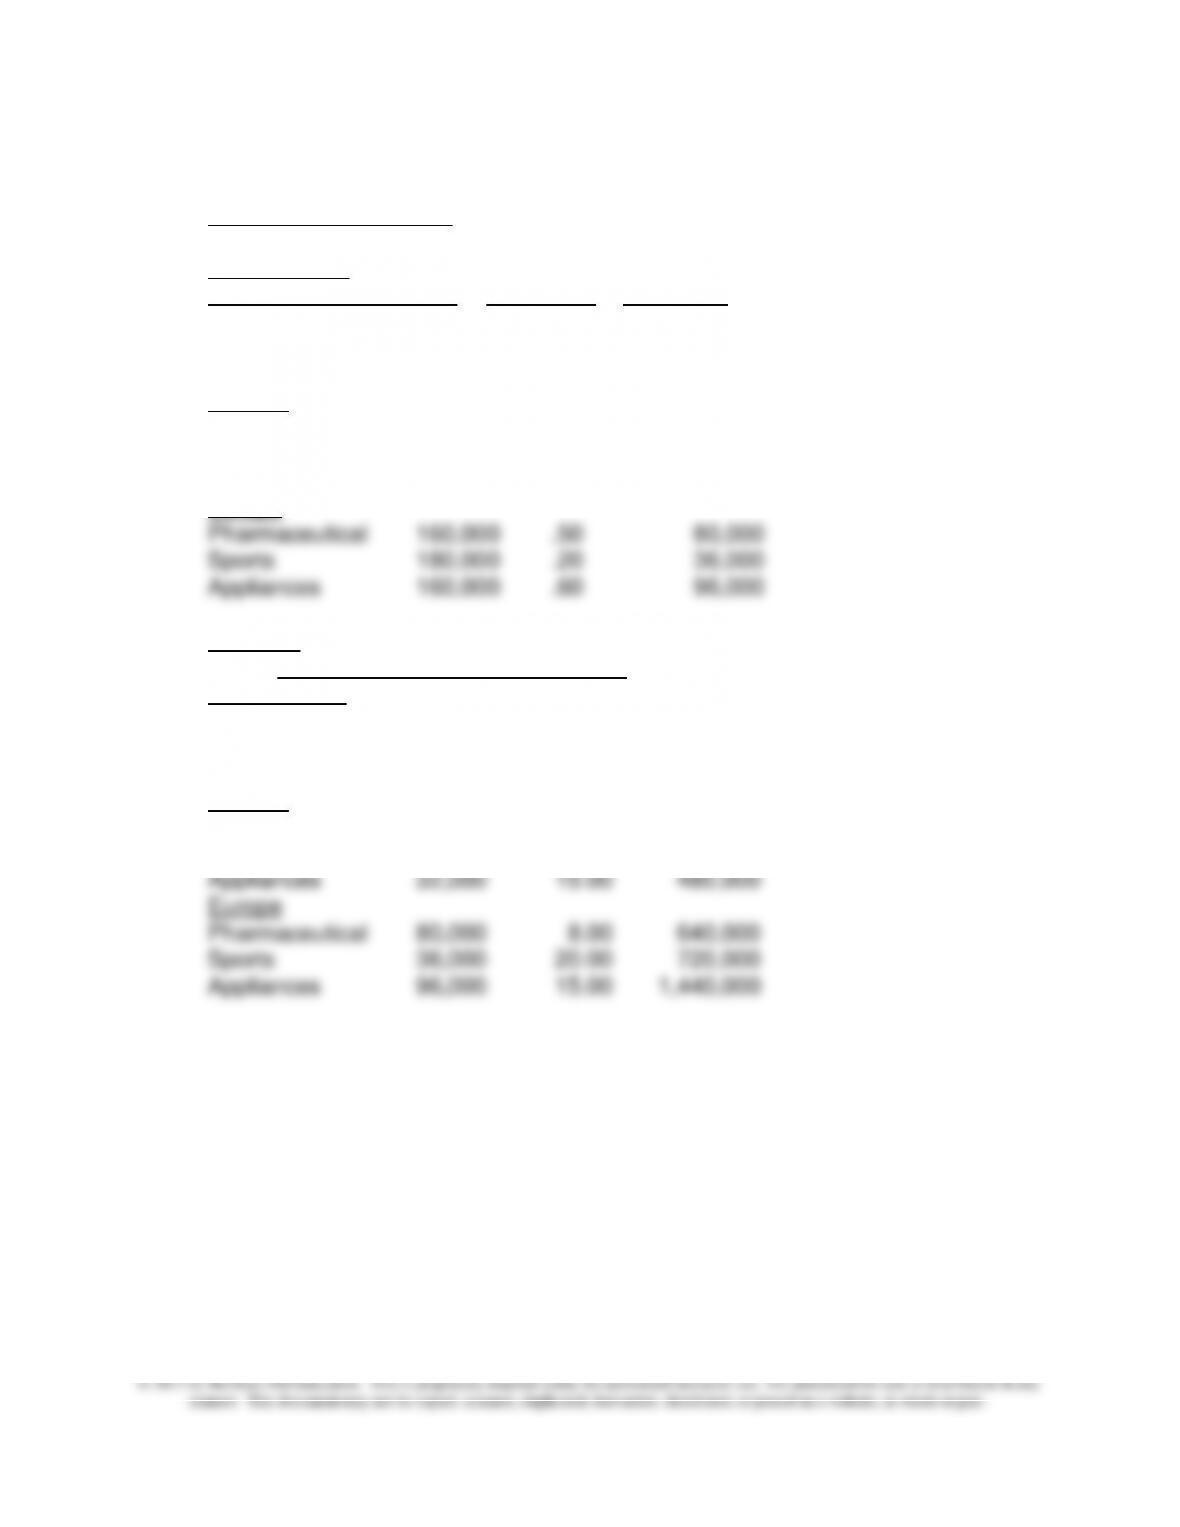
Supporting Calculations
Sales in Units
United StatesTotal Units X % of Sales = Units Sold
Pharmaceutical 160,000 .40 64,000
Sports 180,000 .40 72,000
Appliances 160,000 .20 32,000
Canada
Pharmaceutical 160,000 .10 16,000
Sports 180,000 .40 72,000
Appliances 160,000 .20 32,000
Europe
Revenue
Units Sold x Unit Price = Revenue
United States
Pharmaceutical 64,000 $8.00 $512,000
Sports 72,000 20.00 1,440,000
Appliances 32,000 15.00 480,000
Canada
Pharmaceutical 16,000 8.00 128,000
Sports 72,000 20.00 1,440,000
18–59
18–50 (continued -2)
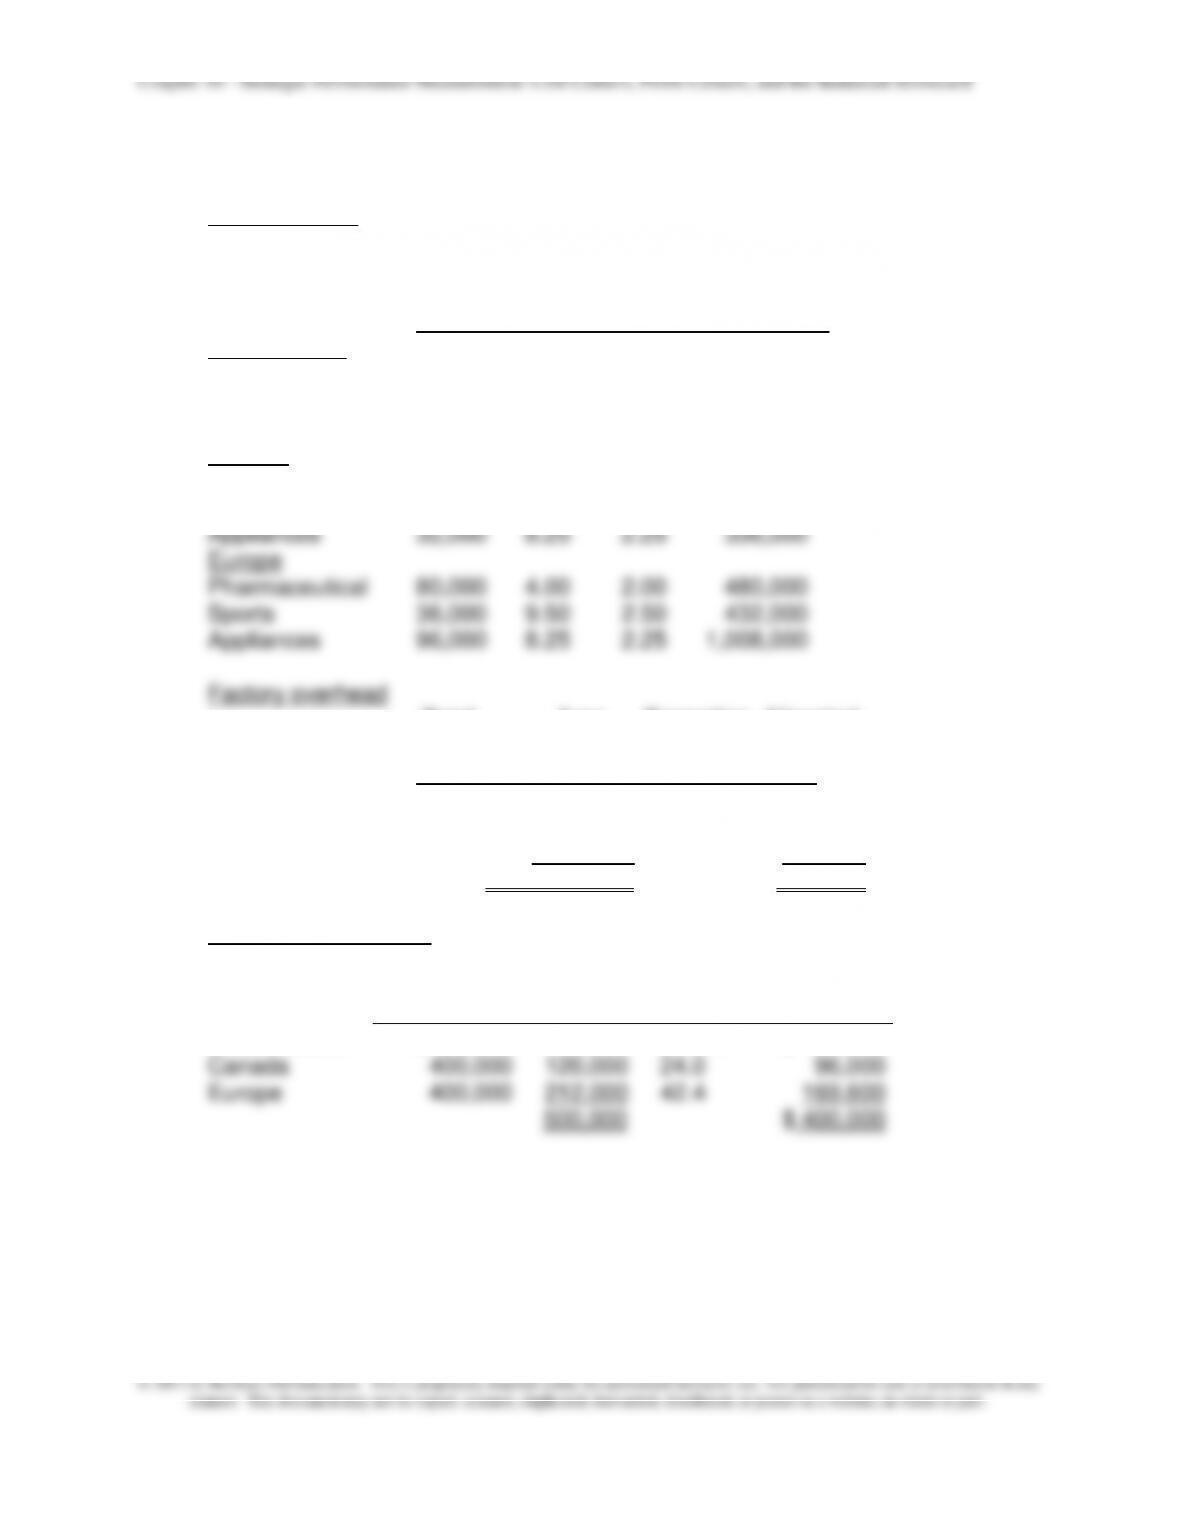
Variable Costs
Variable Variable Total
Units Mfg Selling Variable
Sold Cost/unit Cost/Unit Cost
(1) (2) (3) (1)x[(2)+(3)]
United States
Pharmaceutical 64,000 $4.00 $2.00 $384,000
Sports 72,000 9.50 2.50 864,000
Appliances 32,000 8.25 2.25 336,000
Canada
Pharmaceutical 16,000 4.00 2.00 96,000
Sports 72,000 9.50 2.50 864,000
Total Area Proportion Allocated
Factory Variable of Factory
Overhead Costs Total Cost
United States $500,000 $1,584,000 33% $ 165,000
Canada 500,000 1,296,000 27% 135,000
Europe 500,000 1,920,000 40% 200,000
$4,800,000 $ 500,000
Depreciation expense
Area Proportion
Total Units of Allocated
Depreciation Sold Total Depreciation
United States $400,000 168,000 33.6% $ 134,400
Chapter 18 – Strategic Performance Measurement: Cost Centers, Profit Centers, and the Balanced Scorecard
18–60
18–50 (continued -3)
2. Areas where Stratford Corporation should focus its attention in
order to improve corporate profitability include the following:
The income statement by product line shows that the
pharmaceutical product line may not be profitable. The
pharmaceutical product line does have a positive contribution.
However, because the fixed costs assigned to the product line result
in a loss, Stratford should investigate:
—the possibility of increasing the selling price of these products.
—cutting variable costs associated with this product line.
—discontinuing the manufacture of pharmaceuticals and
concentrating on the other product lines that are more profitable.
The income statement by geographic area shows that the
European market is the least profitable sales area. In order to
3. As a large multinational company, Stratford should develop a
strategic performance measurement system that includes the critical
success factors for such a company. These are likely to include the
effects of foreign exchange fluctuations, differences in taxes between
Europe, Canada, and the United States, as well as currency and