Chapter 18 – Strategic Performance Measurement: Cost Centers, Profit Centers, and the Balanced Scorecard
18–31
Reference: Pierce, L. and J. Snyder. (2008). “Ethical Spillovers in Firms:
Evidence from Vehicle Emissions Testing.” Management Science 54 (11):
pp 1891-1903.
18–39 Allocation of Central Costs; Profit Centers (30 min)
1. Allocation based on revenue
Allocation Base Pine Valley Oak Glen Mimosa Birch Glen Total
Revenue $5,350 $7,995 $8,857 $6,550 $28,752
Percentage 18.6074% 27.8068% 30.8048% 22.7810%
Alocated Cost $3,522 $5,264 $5,831 $4,312 18,930$
Operating Margin $1,828 $2,731 $3,026 $2,238
Operating Margin % 34.2% 34.2% 34.2% 34.2%
Note that the allocation based on revenue shown above means that
the operating margin (operating margin/revenue) is the same for all
administrative and executive salaries are closely related to revenue.
Also, the cost of front office personnel is likely to be related to same
measure of the number of customers of the resort. Perhaps the
number of rooms is a better measure of the usage of the cost of front
office personnel.
2. There are a number of possible answers. A useful starting point for
class discussion might be the following solution:
The four allocation bases are revenues, square feet, number of
Chapter 18 – Strategic Performance Measurement: Cost Centers, Profit Centers, and the Balanced Scorecard
18–32
18-39 (continued -1)
Square Feet: carpet cleaning, contract to repaint rooms; it could be
argued that these costs are driven by the size of the areas to be
cleaned and painted
Total cost: $450 = $50 + $400
Number of rooms: front office personnel, housekeeping, room
maintenance; the number of guests drives these costs, and the
number of rooms is used as a surrogate
Revenue cost pool: advertising, depreciation on reservations
computer system, administrative and executive salaries. These are
the office costs that cannot be traced to one of the above costs
drivers (square feet, number of rooms, assets), but using the ability to
3. Cost Allocation
This part can be compared to the application of ABC costing in
chapter 5; the goal is to allocate costs in a manner that most nearly
reflects the consumption of the costs.
The allocation using the multiple cost pools is preferred because it
allocates costs in a manner more closely related to the cause-effect
Chapter 18 – Strategic Performance Measurement: Cost Centers, Profit Centers, and the Balanced Scorecard
18-39 (continued –2)
Allocation Based on Cost Pools
Allocation Base Pine Valley Oak Glen Mimosa Birch Glen Total
Revenue $5,350 $7,995 $8,857 $6,550 $28,752
Percentage 18.6074% 27.8068% 30.8048% 22.7810%
Square feet 55,475 76,599 41,774 83,664 257,512
Percentage 21.5427% 29.7458% 16.2222% 32.4894%
Number of Rooms 86 122 66 174 448
Percentage 19.1964% 27.2321% 14.7321% 38.8393%
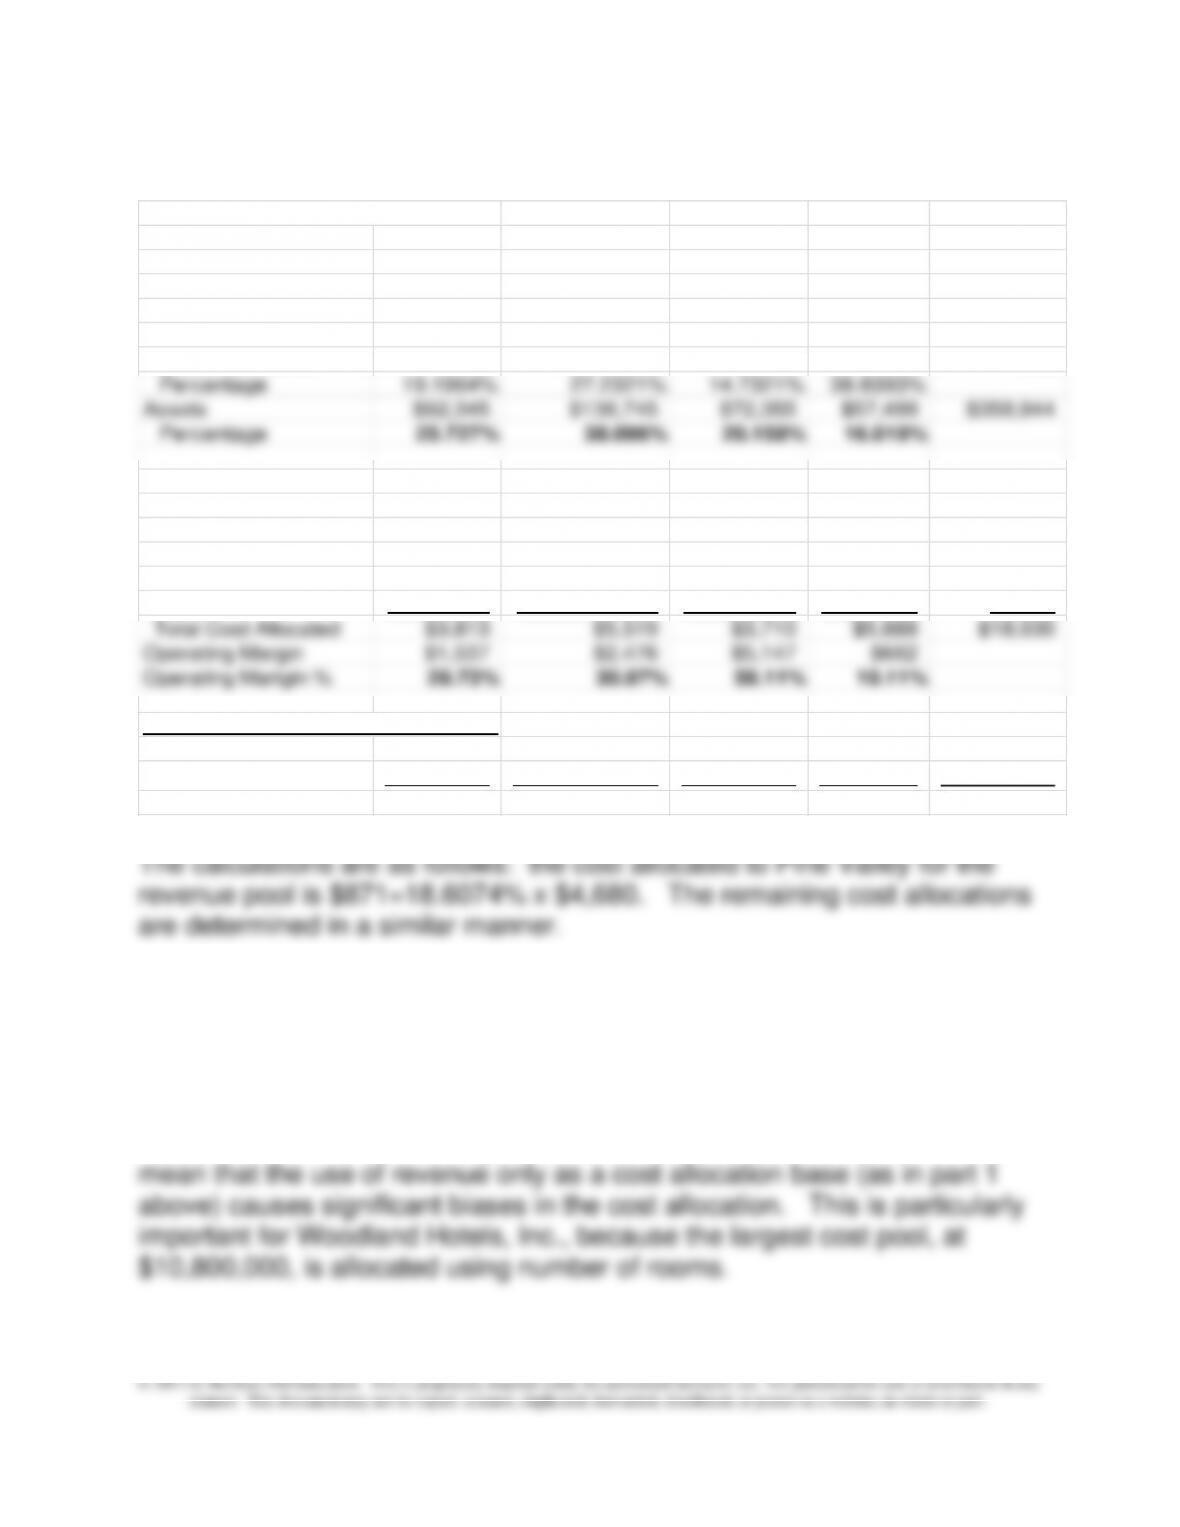
Assets $92,345 $136,745 $72,355 $57,499 $358,944
Percentage 25.727% 38.096% 20.158% 16.019%
Cost Allocation
Allocated Base Pine Valley Oak Glen Mimosa Birch Glen Total
Revenue $871 $1,301 $1,442 $1,066 $4,680
Square feet 97 134 73 146 $450
Number of Rooms 2,073 2,941 1,591 4,195 $10,800
Assets 772
1,143
605
481
$3,000
Total Cost Allocated $3,813 $5,519 $3,710 $5,888 $18,930
Operating Margin $1,537 $2,476 $5,147 $662
Operating Marigin % 28.73% 30.97% 58.11% 10.11%
Comparison of Allocation Methods
Allocation Pool–Based 3,813$ 5,519$ 3,710$ 5,888$ 18,930$
Revenue-Based 3,522 5,264 5,831 4,312 18,930$
Difference 290$ 255$ (2,121)$ 1,575$
The allocation rates for each of the four cost drivers are determined above.
Note the large differences between the rates for revenue and for the
number of rooms; relative to Oak Glen, Pine Valley is a smaller resort with
Chapter 18 – Strategic Performance Measurement: Cost Centers, Profit Centers, and the Balanced Scorecard
18–34
18–39 (continued –3)
Based on the relationship between revenue and number of rooms,
the result is that Pine Valley and Oak Glen’s cost allocation and operating
margin are similar under the revenue-only and the multiple-driver
Chapter 18 – Strategic Performance Measurement: Cost Centers, Profit Centers, and the Balanced Scorecard
18–35
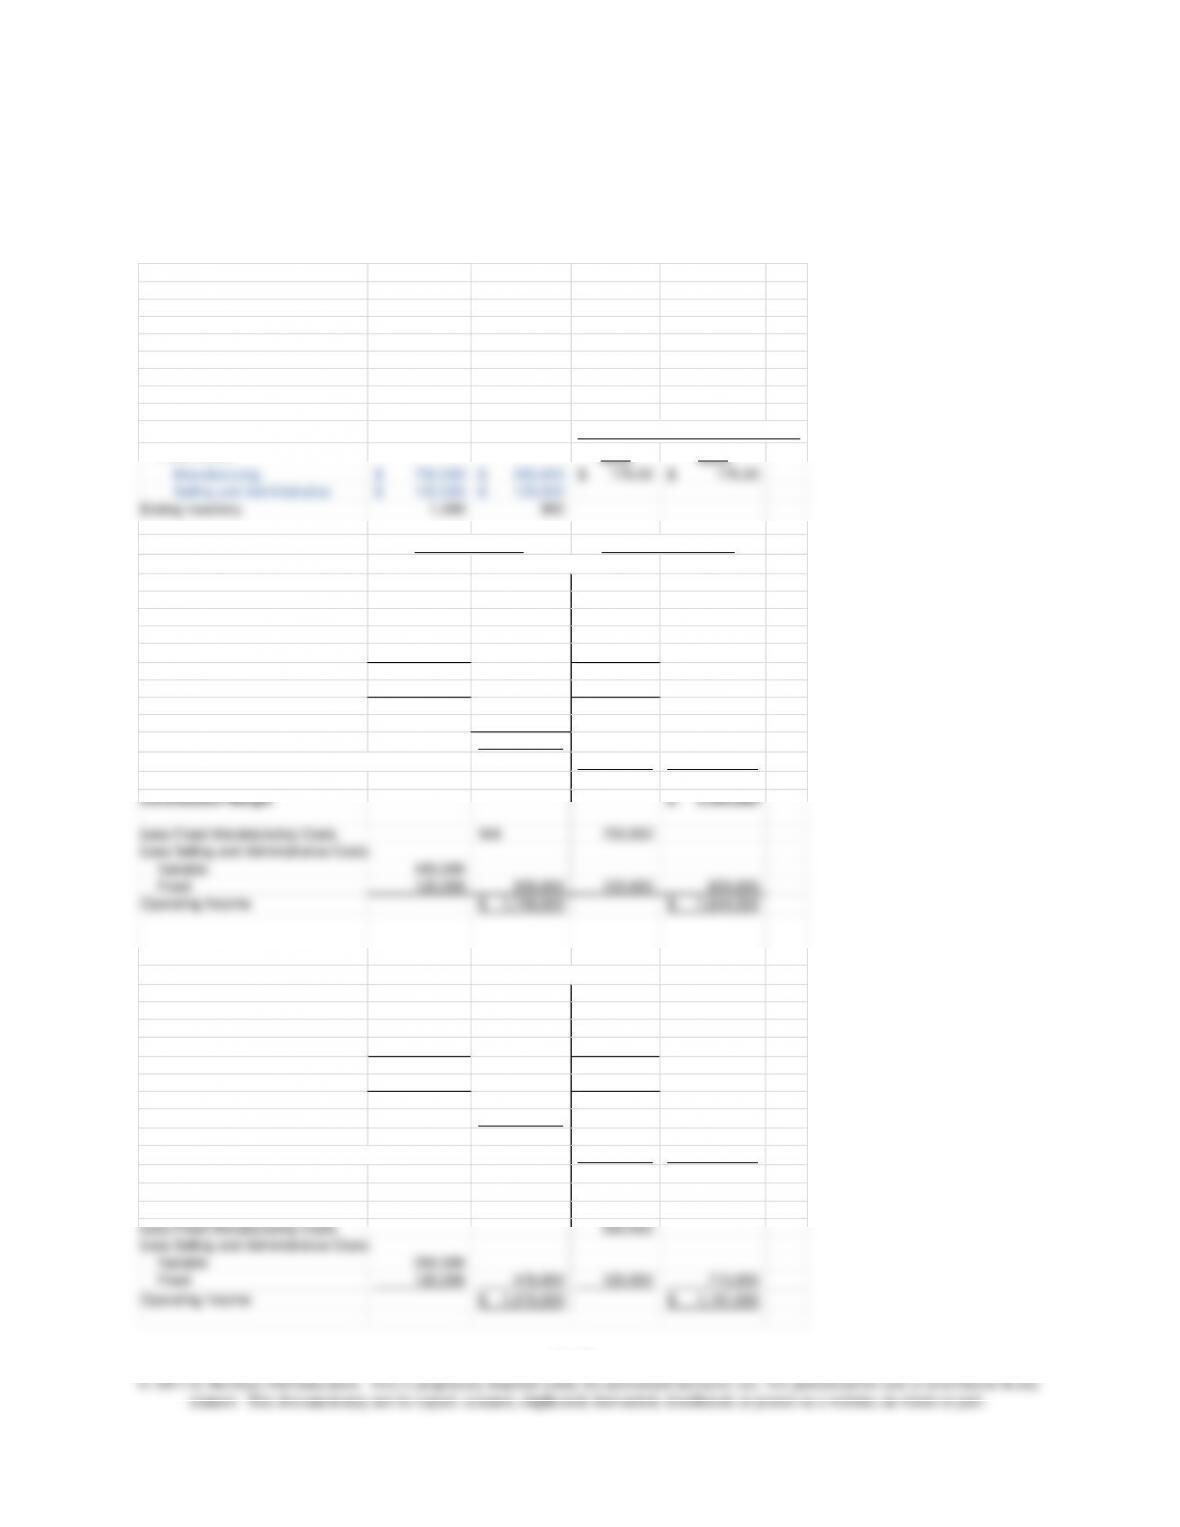
18-40 Profit Centers: Comparison of Variable and Full Costing (20
min)
1.
DATA SUMMARY 2012 2013
Units
Beginning Inventory 0200
Price 3.00$ 3.00$
Sold 1,800 2,200
Produced 2,000 2,000
Unit Variable Costs
Manufacturing 0.60$ 0.60$
Selling and Administrative 0.40$ 0.40$
Fixed Costs
Selling and Administrative 500$ 500$
Manufacturing – Total 1,000$ 1,000$
– Per unit 0.50$ 0.50$
Full Manufacturing Cost per unit 1.10$ 1.10$
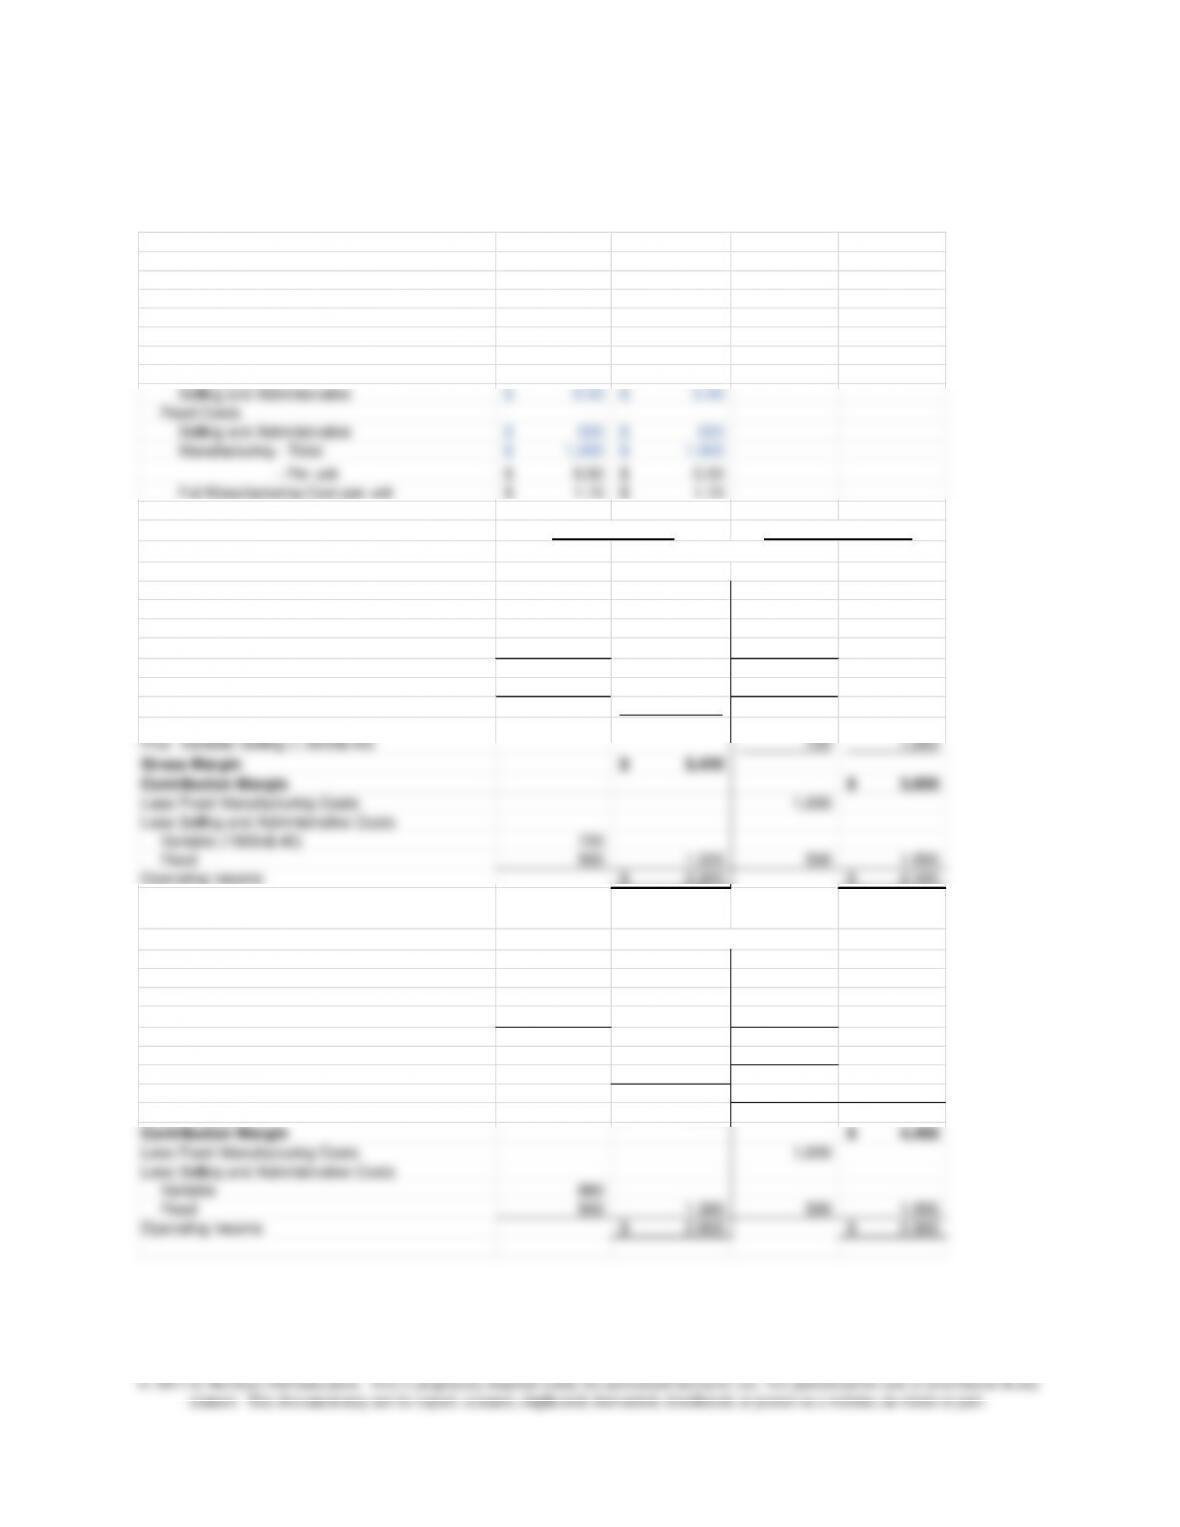
PART TWO
Income Statement for 2012
Sales (1,800 x $3) 5,400$ 5,400$
Less: Cost of Goods Sold
Beginning Inventory – –
Cost of Production (2,000 x $1.10; 2,000x$.6) 2,200$ 1,200$
Contribution Margin 3,600$
Less Fixed Manufacturing Costs 1,000
Less Selling and Administrative Costs
Variable (1800x$.40) 720
Fixed 500 1,220 500 1,500
Operating Income 2,200$ 2,100$
Income Statement for 2013
Sales 6,600$ 6,600$
Less: Cost of Goods Sold
Beginning Inventory 220$ 120$
Less Selling and Administrative Costs
Variable 880
Fixed 500 1,380 500 1,500
Operating Income 2,800$ 2,900$
Full Costing
Variable Costing
Chapter 18 – Strategic Performance Measurement: Cost Centers, Profit Centers, and the Balanced Scorecard
18–36
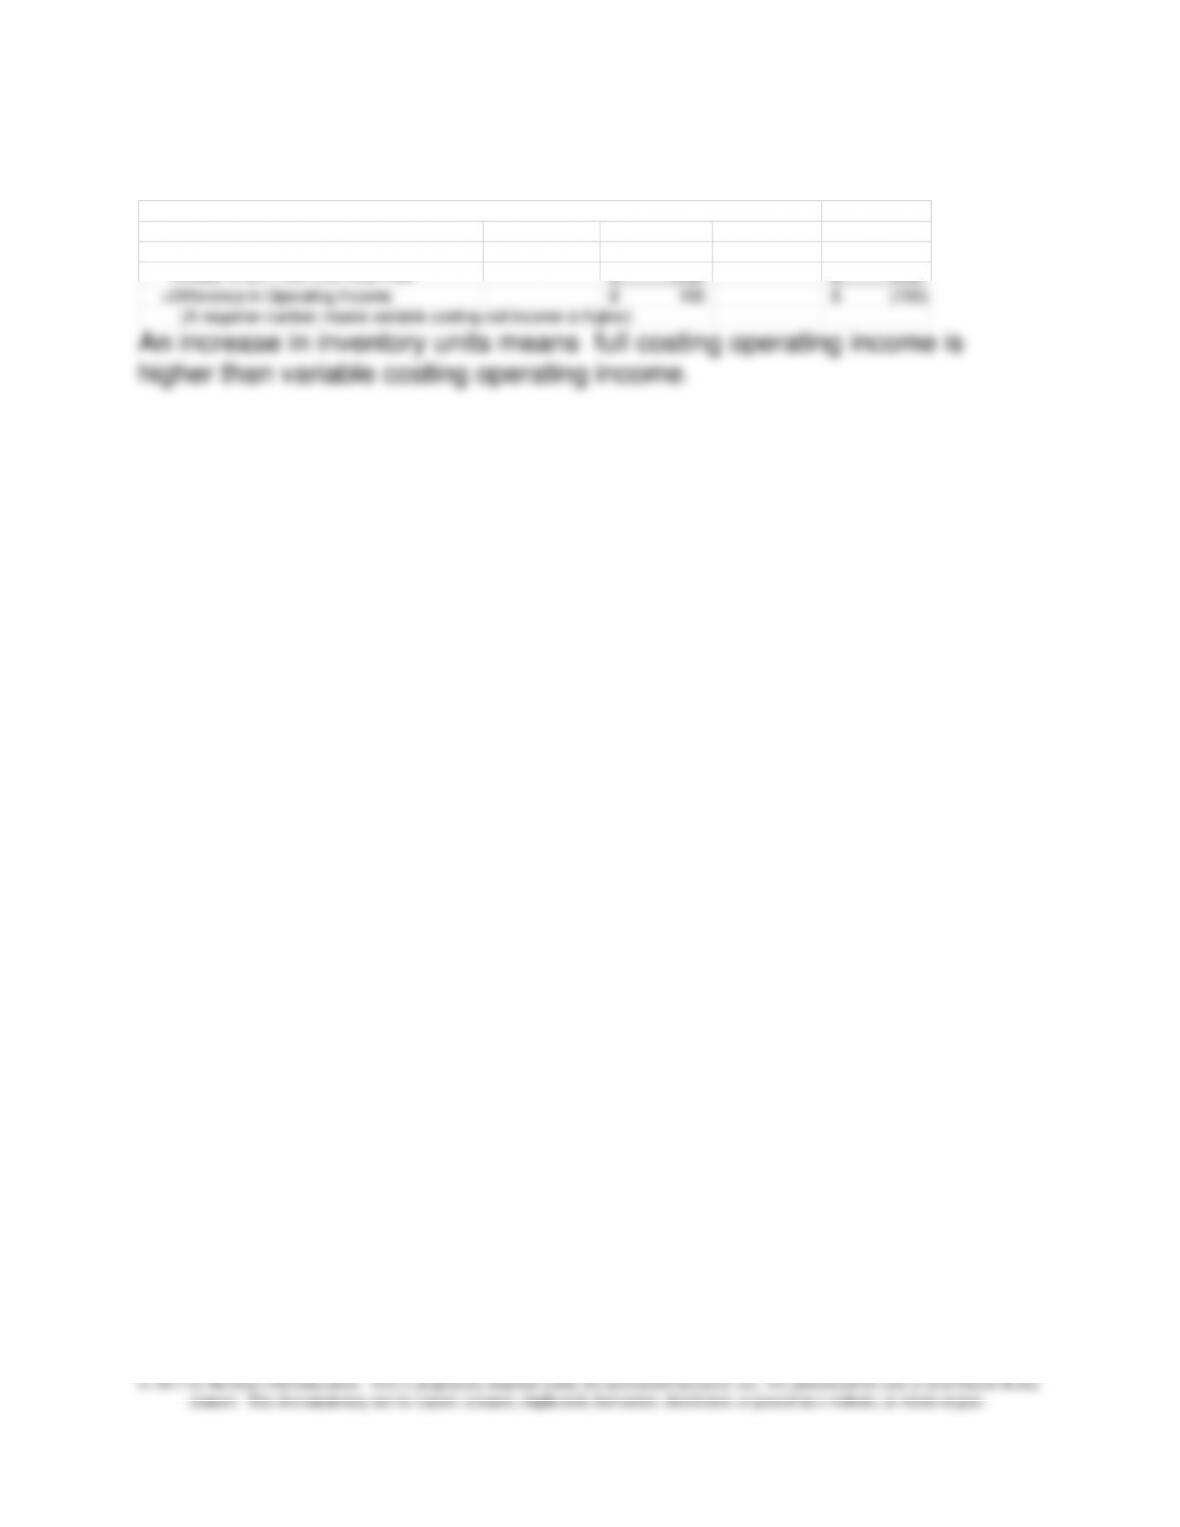
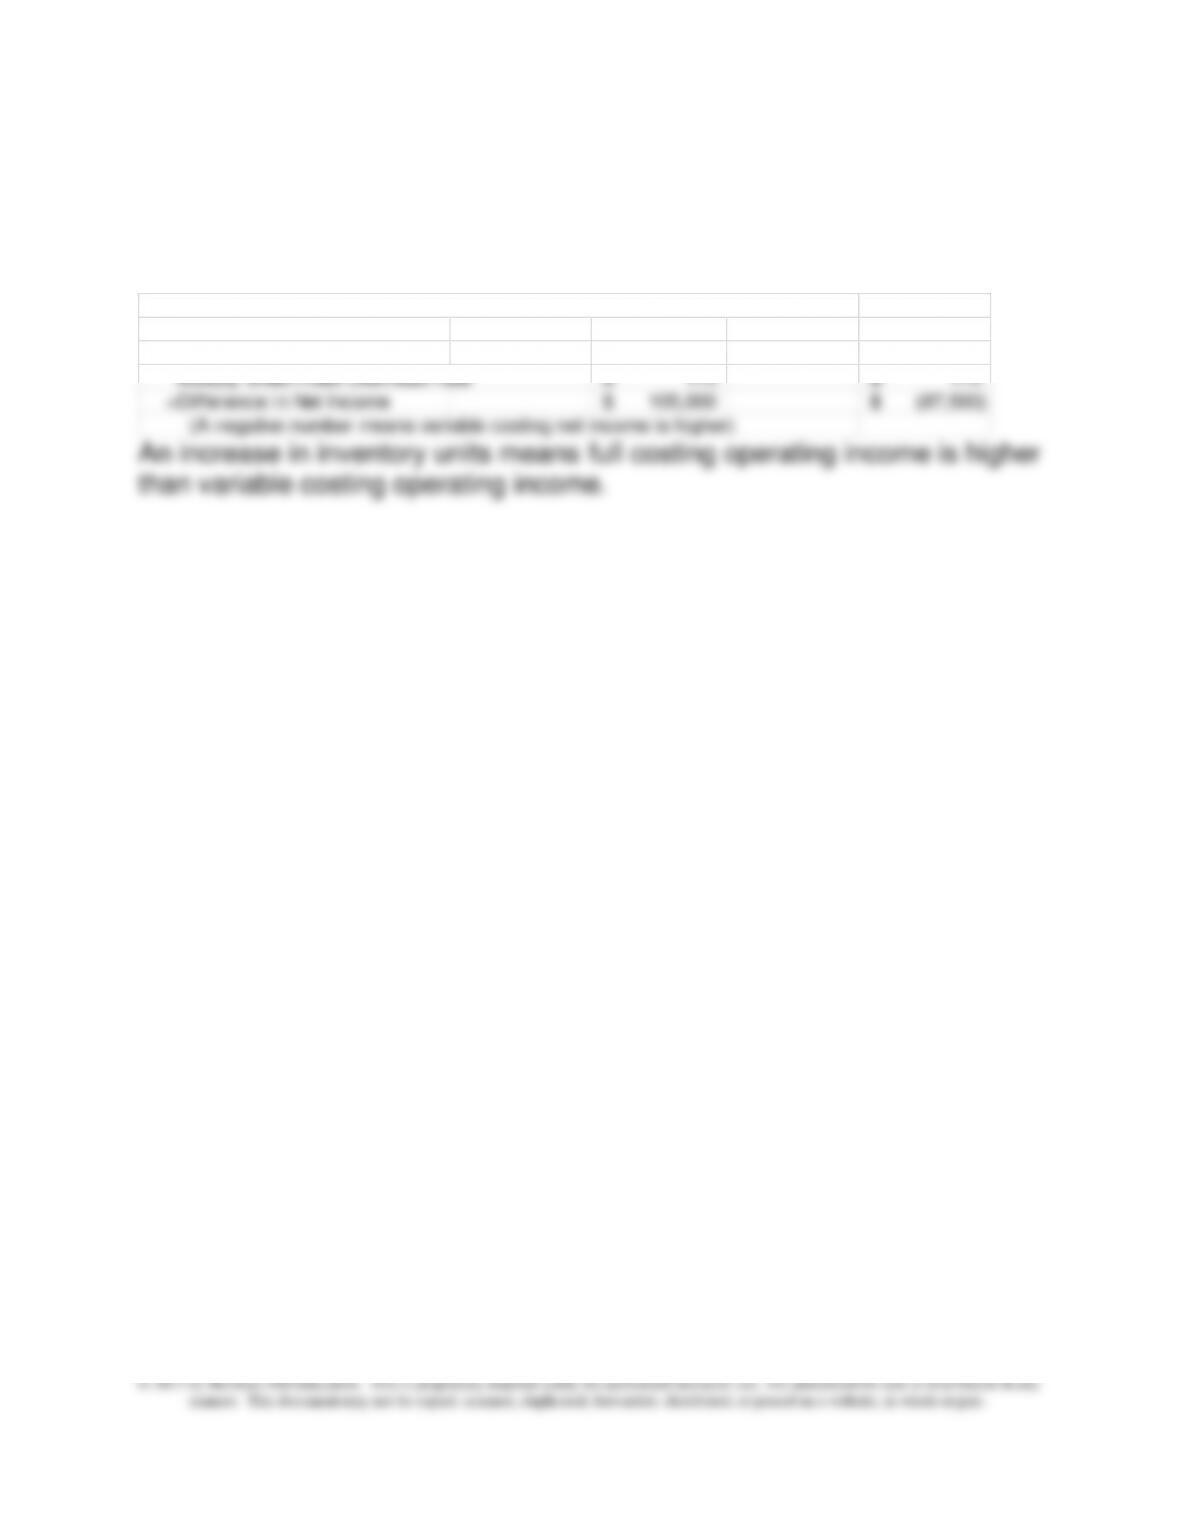
18-40 (continued -1)
Reconciling Difference in Operating Income between Full and Variable Costing
2012 2013
Change in Inventory in Units 200 (200)
Multiply times Fixed Overhead Rate 0.50$ 0.50$
=Difference in Operating Income 100$ (100)$
(A negative number means variable costing net income is higher)
An increase in inventory units means full costing operating income is
higher than variable costing operating income.
A decrease in inventory units means variable costing operating income is
higher than full costing operating income.
Chapter 18 – Strategic Performance Measurement: Cost Centers, Profit Centers, and the Balanced Scorecard
18–37
18-41 Full versus Variable Costing (25 min)
1.
DATA SUMMARY 2012 2013
Units
Beginning Inventory 0 1,000
Price 55.00$ 55.00$
Sold 24,000 26,000
Produced 25,000 25,000
Unit Variable Costs
Manufacturing 16.00$ 16.00$
Selling and Administrative 0.50$ 0.50$
Fixed Costs
Selling and Administrative 500$ 500$
Manufacturing – Total 200,000$ 200,000$
– Per unit 8.00$ 8.00$
Full Manufacturing Cost per unit 24.00$ 24.00$
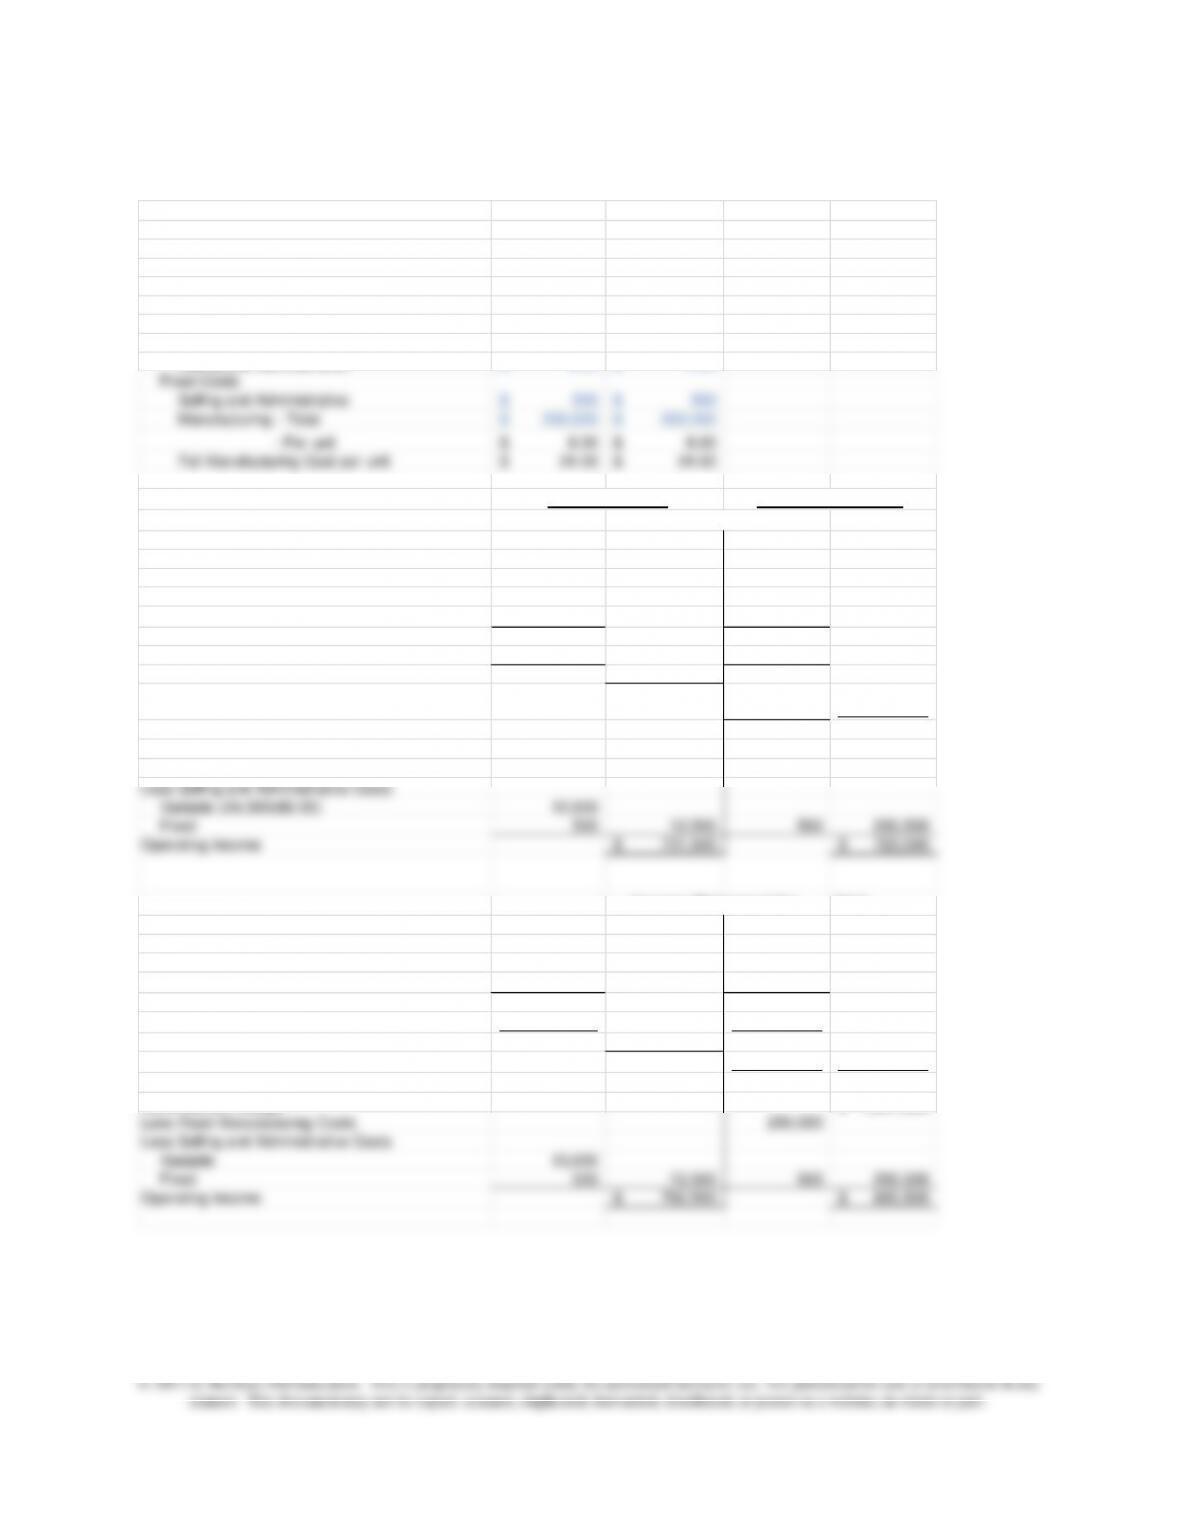
PART TWO
Income Statement for 2012
Sales (24,000 x $55) 1,320,000$ 1,320,000$
Less: Cost of Goods Sold
Beginning Inventory – –
Cost of Production (25,000x$24;25,000x$16) 600,000$ 400,000$
Available for Sale 600,000 400,000
Less Ending Inventory (1,000x$24;1,000x$16) 24,000 16,000
Cost of Goods Sold 576,000 384,000
Less Fixed Manufacturing Costs 200,000
Less Selling and Administrative Costs
Variable (24,000x$0.50) 12,000
Fixed 500 12,500 500 200,500
Operating Income 731,500$ 723,500$
Income Statement for 2013
Sales 1,430,000$ 1,430,000$
Less: Cost of Goods Sold
Beginning Inventory 24,000$ 16,000$
Cost of Goods Produced 600,000 400,000
Available for Sale 624,000 416,000
Less Ending Inventory – –
Cost of Goods Sold 624,000 416,000
Plus Variable Selling and Administrative 13,000 429,000
Operating Income 792,500$ 800,500$
Full Costing
Variable Costing
Chapter 18 – Strategic Performance Measurement: Cost Centers, Profit Centers, and the Balanced Scorecard
18–38
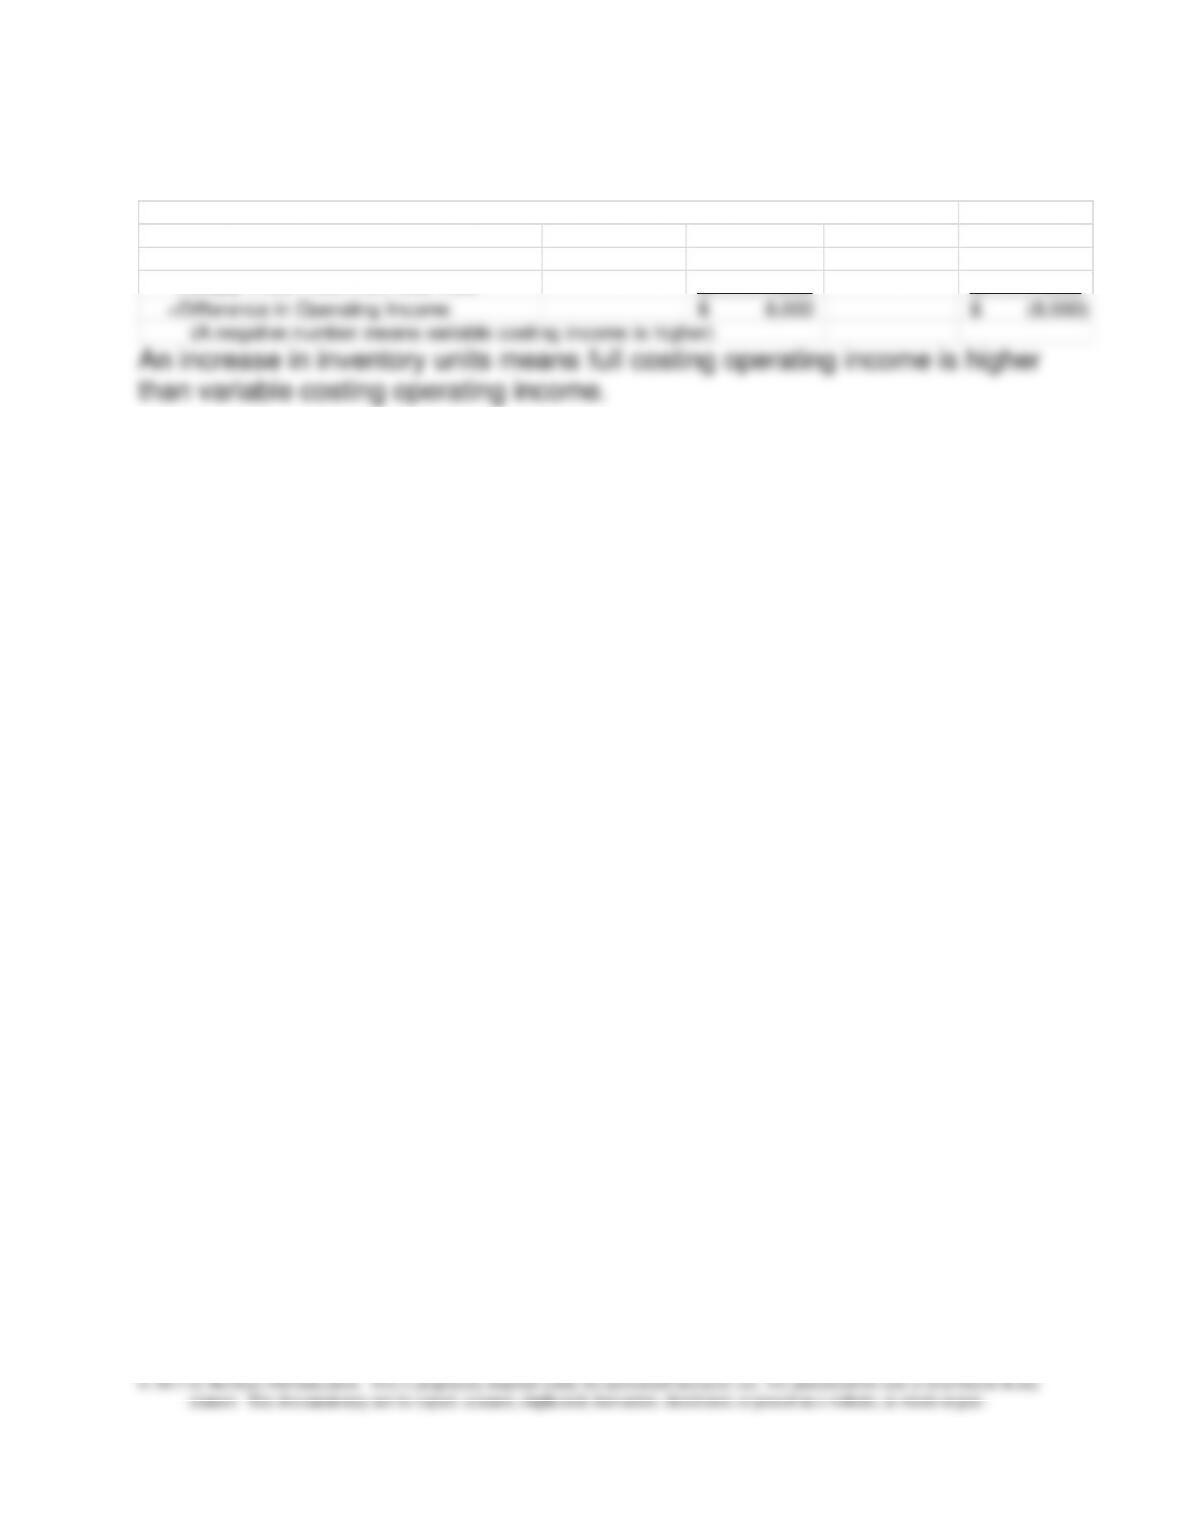
18-41 (continued –1)
Reconciling Difference in Operating Income between Full and Variable Costing
2012 2013
Change in Inventory in Units 1,000 (1,000)
Multiply times Fixed Overhead Rate 8.00$ 8.00$
=Difference in Operating Income 8,000$ (8,000)$
(A negative number means variable costing income is higher)
An increase in inventory units means full costing operating income is higher
than variable costing operating income.
A decrease in inventory units means variable costing operating income is
higher than full costing operating income.
Chapter 18 – Strategic Performance Measurement: Cost Centers, Profit Centers, and the Balanced Scorecard
18–39
18-42 Profit Centers: Comparison of Variable and Full Costing
(Underapplied Overhead) (30 min)
1., 2.
DATA SUMMARY 2012 2013
Units
Beginning Inventory 800 1,400
Price 2,095$ 1,995$
Sold 3,200 2,800
Actual Production 3,800 2,300
Budgeted Production 4,000 3,400
Unit Variable Costs
Manufacturing 1,200$ 1,200$
Selling and Administrative 125$ 125$
Fixed Costs 2012 2013
Manufacturing 700,000$ 595,000$ 175.00$ 175.00$
Selling and Administrative 120,000$ 120,000$
Ending Inventory 1,400 900
PART TWO
Income Statement for 2012
Sales 6,704,000$ 6,704,000$
Cost of Goods Sold:
Beginning Inventory 1,100,000 960,000
Cost of Goods Produced 5,225,000 4,560,000
Adjust: Production Volume Variance 35,000
Adjusted Cost of Goods Sold 4,435,000
Plus Variable Selling and Administrative 400,000 4,240,000
Gross Margin 2,269,000$
Contribution Margin 2,464,000$
Less Fixed Manufacturing Costs N/A 700,000
Less Selling and Administrative Costs
Variable 400,000
Fixed 120,000 520,000 120,000 820,000
Operating Income 1,749,000$ 1,644,000$
Income Statement for 2013
Adjust: Production Volume Variance 192,500
Adjusted Cost of Goods Sold 4,042,500
Plus: Variable Selling and Administrative 350,000 3,710,000
Gross Margin 1,543,500$
Contribution Margin 1,876,000$
Less Fixed Manufacturing Costs 595,000
Less Selling and Administrative Costs
Variable 350,000
Fixed 120,000 470,000 120,000 715,000
Operating Income 1,073,500$ 1,161,000$
Fixed Manufacturing Cost Per Unit
Full Costing
Variable Costing
Chapter 18 – Strategic Performance Measurement: Cost Centers, Profit Centers, and the Balanced Scorecard
18–40
18–42 (continued -1)
2. (continued)
Reconciling Difference in Net Income betwee Absoprtion and Variable Costing
2012 2013
Change in Inventory in Units 600 (500)
Multiply times Fixed Overhead Rate 175$ 175$
=Difference in Net Income 105,000$ (87,500)$
(A negative number means variable costing net income is higher)
An increase in inventory units means full costing operating income is higher
than variable costing operating income.
A decrease in inventory units means variable costing operating income is
higher than full costing operating income.
Additional Note on the Production Volume Variance: A recent CFO
magazine item notes how the use of full cost accounting in the auto
industry has biased profit reporting in that industry. See, Marielle Segarra,
“Accounting: Lots of Trouble,” CFO, March 2012, pp. 29-30.
Chapter 18 – Strategic Performance Measurement: Cost Centers, Profit Centers, and the Balanced Scorecard
18–41
3.
Memo
TO: Mr. Mark Hancock
FROM:
DATE:
The difference in operating income between variable costing
and full costing is due to the fact that the level of units in finished
goods inventory increased by 600 units (from 800 to 1,400) in 2012
and decreased by 500 units (from 1,400 to 900) in 2013. The
variable cost income statements do not include fixed manufacturing
costs in inventory, but treat these costs instead as a cost of the
current period. Thus, variable costing income statements are not
affected by changes in inventory levels.
You may use the variable cost income statements as a more
reliable measure of operating income when fixed manufacturing costs
are high and inventory changes significantly, as in this case. The
income figures for the full costing method, in contrast, do include
fixed cost in inventory, and thus are biased by the changes in
variable cost statements.
Note that the production volume variance does not affect the
difference between variable and full costing income. The difference in
income is fully explained by the change in inventory multiplied times
the fixed overhead rate, as illustrated in the end of part 2 above.
18–42
18-43 Balanced Scorecard (15 min)
Solution for problem 2-35
1. Medical University’s strategy should encompass a focus on the
quality of its clinical care, education, and research. The relative size
of the healthcare system is important as a way to attract third party
payers, providers, and patients. A large hospital system tends to
offer a greater breadth of services, which often increases the
clinician’s level of expertise. A physician at a larger institution will
and public relations departments are very crucial to its success. It is
also essential that the healthcare system stay within its budget in
order to continue operations.
2. Yes. The balanced scorecard goes beyond simply monitoring
financial performance. Because the four areas: financial
performance, customer satisfaction, internal processes, and learning
3.
• Financial: operating margin, cost per discharge, days in accounts
receivable
• Customer: patient satisfaction, employee satisfaction, referring
Chapter 18 – Strategic Performance Measurement: Cost Centers, Profit Centers, and the Balanced Scorecard
18–43
18-43 (continued -1)
4. One of the hardest challenges is convincing employees that the
balanced scorecard is not simply a management tool. The reluctance
of employees to implement the balanced scorecard may prevent the
organization from achieving its strategic goals. In order to increase
their personal and professional goals. Organizations must explain
what the balanced scorecard means to its employees in order to
prevent them from dismissing the initiative as the latest strategic
management tool.
Chapter 18 – Strategic Performance Measurement: Cost Centers, Profit Centers, and the Balanced Scorecard
18–44
18-44 Balanced Scorecard (15 min)
Solution for problem 2-39; Balanced Scorecard for Fowler’s Farm
There are a number of possibilities for determining both the number
and types of perspectives for the balanced scorecard, and for
determining the critical success factors which belong under each
perspective. The answer below is representative of a balanced
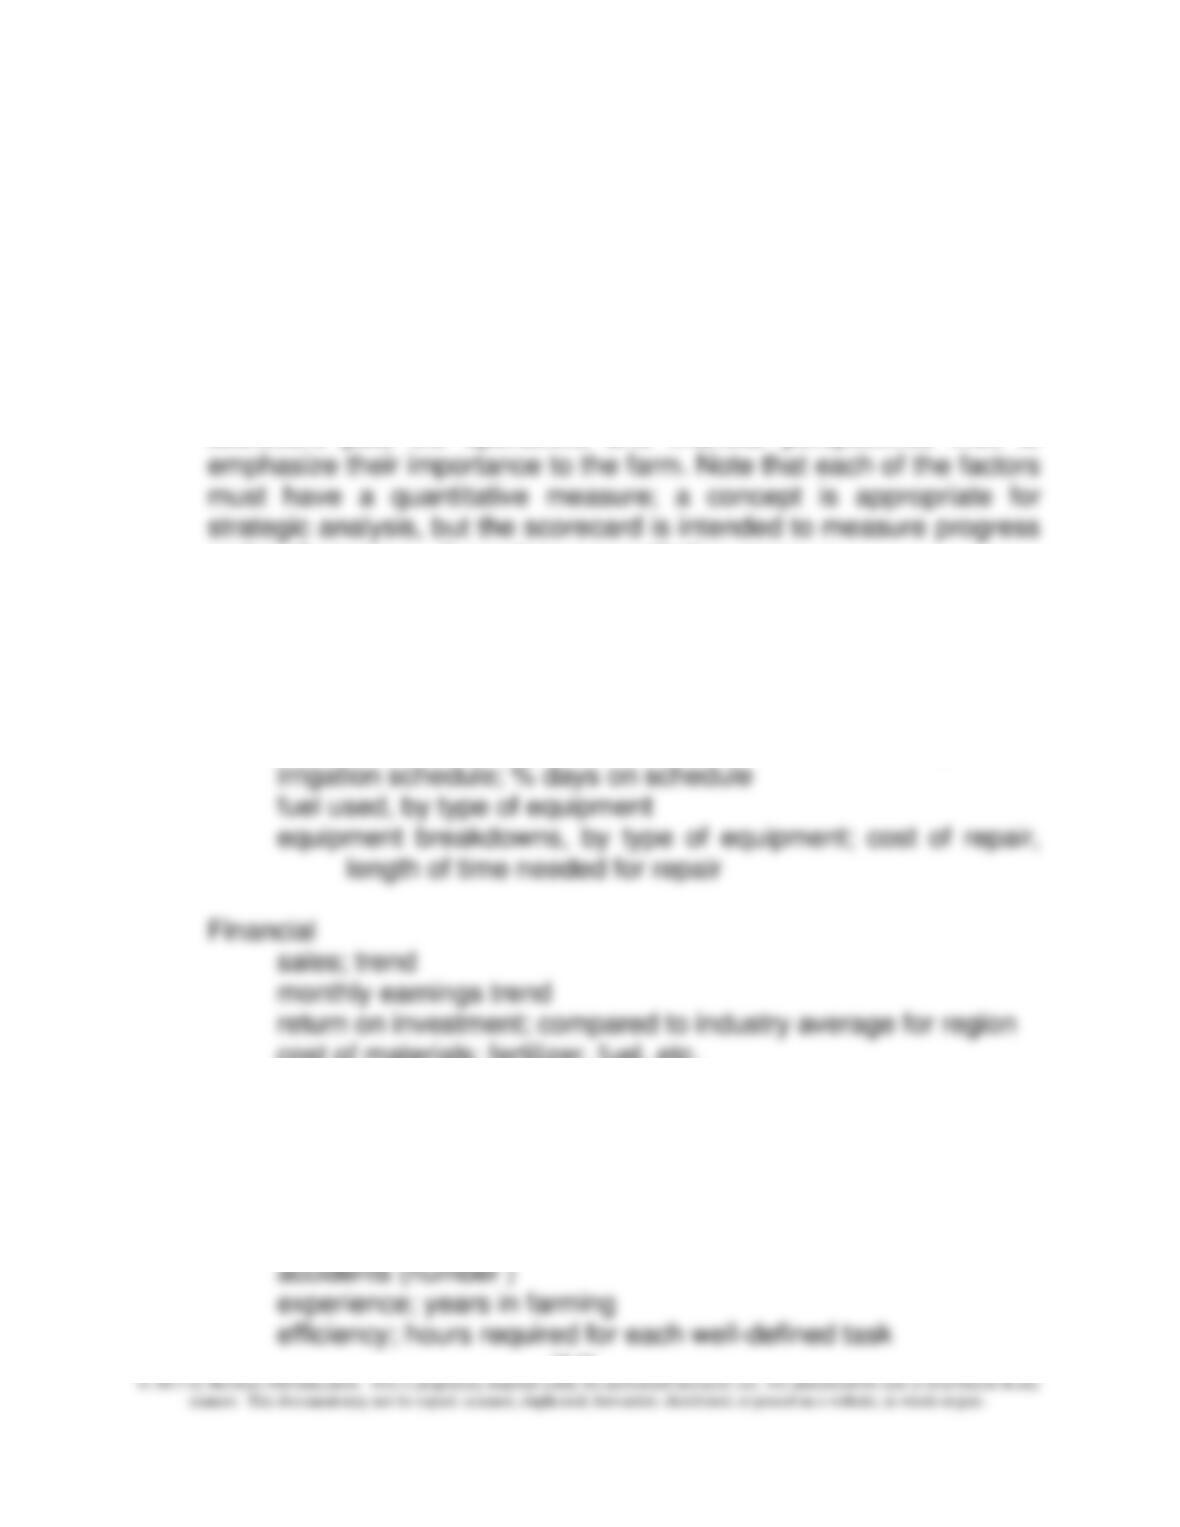
scorecard that would be a good fit for the Fowler farm. This
scorecard puts the operations and financial perspectives first, to
and performance – it requires a quantitative measure.
Operations
crop rotation; number of fields in rotation
inventory of supplies and parts, by type of equipment, cost and
date purchased
weather forecast, days missed, important weather changes
cost of materials; fertilizer, fuel, etc.
cost of labor; by type of employee
prices received for each major product
interest cost
Employees
turnover (number and percent)

Chapter 18 – Strategic Performance Measurement: Cost Centers, Profit Centers, and the Balanced Scorecard
18–45
18-44 (continued –1)
Regulatory Compliance and Environmental
compliance with local, state and federal laws on tobacco
farming
compliance with FDA regulations regarding handling raw milk
usage of restricted chemicals known to have negative
environmental effects (amount, percent)
Customer
orders shipped on time (number and percent)
quality complaints (number, percent)