
Chapter 17 – The Management and Control of Quality
17–74
some public information available on its efforts to address global warming.
17–58 (Continued-2)
4. As indicated in the referenced HBR piece (October 2007, pp. 30, 34), companies that
have sub-par performance in the environmental area face potential risks for four
reasons:
a) Reputation risk
backlashes)
5. Role of the management accountant: environmental performance, as evidenced by
the corporate-performance scorecard used by Climate Counts, fundamentally
involves measurement, reporting, and analysis. Presumably, the management
accountant has a competitive advantage in these areas and, therefore, should be
able to add value to the organization by participating in the design of a
comprehensive management accounting and control system—one that includes
Chapter 17 – The Management and Control of Quality
17–75
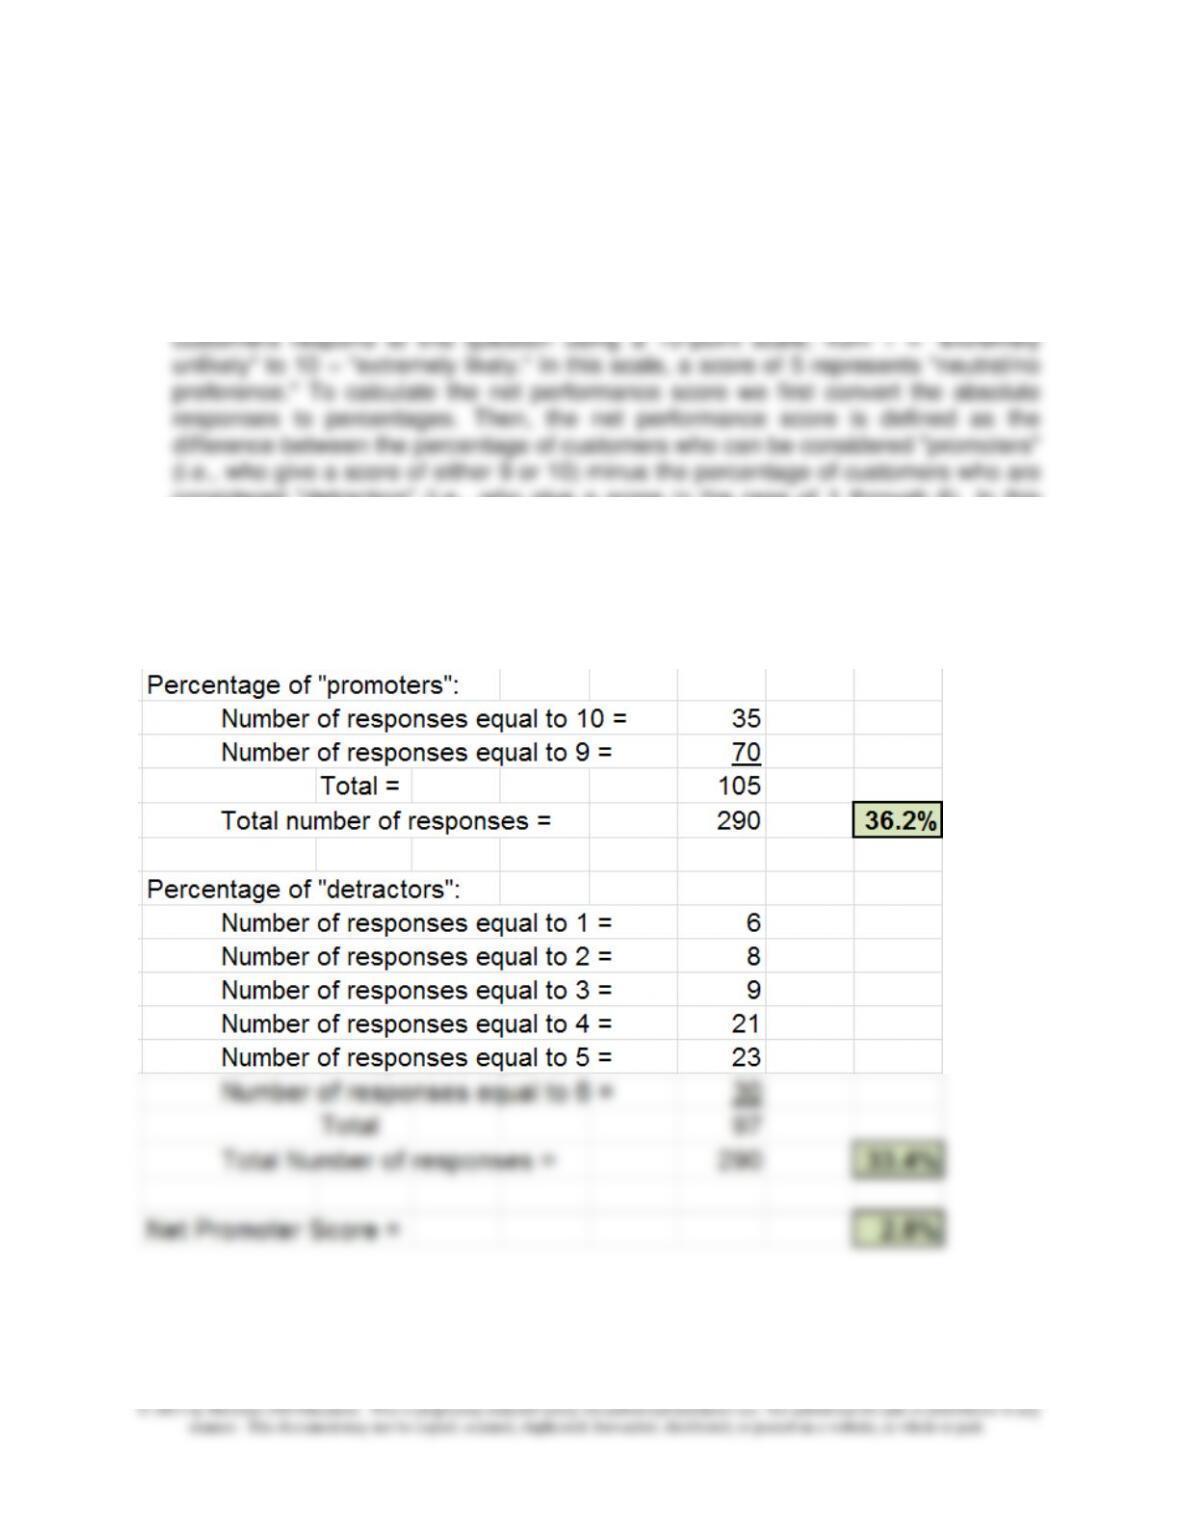
17–59 Net Promoter Score (30 minutes)
1. The “net promoter score” is an example of a non-financial customer-related
performance indicator. It is calculated based on responses to the following question
posed to an organization’s customers: “How likely is it that you would recommend
our firm/company to a friend or to a colleague?” As indicated in this exercise,
considered “detractors” (i.e., who give a score in the rage of 1 through 6). In this
calculation, scores of 7 and 8 are ignored—these are assumed not to provide
information regarding customer loyalty.
2. Net promoter score based on the assumed data/customer responses is 2.8%, as
follows:

Chapter 17 – The Management and Control of Quality
17–76
17–59 (Continued)
3. The net promoter score is recommended as a nonfinancial customer-related
performance measure based on research that indicates that a customer’s
willingness to recommend a company is positively correlated with future growth and
profitability of the company. The net promoter score can be viewed as a measure of
customer loyalty. The underlying argument is that a traditional measure of customer
loyalty, customer retention, is not a good indicator of a customer’s loyalty. This is
because customers may remain as a customer either because there are no
loyalty.
The basic argument regarding the strategic importance of non-financial
performance indicators is best embodied in a comprehensive strategic
management system, such as the Balanced Scorecard (BSC). While it is true that
managing customer relationships requires financial performance indicators (e.g.,
from ABC systems), it is also true that such measures are incomplete. For one
thing, financial indicators are lagging indicators of performance. For another,
operating personnel and marketing personnel many times find non-financial
performance indicators more informative than financial indicators. Finally, non–
financial performance indicators, including customer-related metrics, provide
guidance for improving operations, processes, customer relationships, etc.—
information that is unavailable with financial performance indicators.
Source Documents for the Net Promoter Score:
1. F. Reichheld, The Ultimate Question: Driving Good Profits and True Growth (Boston,
MA: Harvard Business Press, 2008).
2. F. Reichheld, “The One Number You Need to Grow,” Harvard Business Review
(December 2003), pp. 46-54.

Chapter 17 – The Management and Control of Quality
17–77
17–60 Expected Quality Cost, Confidence Intervals, and Sample Size (45-60 Minutes—
requires some material from Chapter 8: Cost Estimation)
1. Paragon Manufacturing would be willing to spend $509,000 annually to implement
quality control inspection of the housings before assembly begins. This amount is
equal to the expected cost of rejections and repairs without quality control
inspection, calculated as follows.
Expected Value of Housings
Rejected During Assembly
(1) (2) (1) × (2)
Quantity Probability Outcome
90 0.40 36
70 0.30 21
50 0.20 10
30 0.10 3
70
Expected Value of Housings
Rejected During Performance Testing
(1) (2) (1) × (2)
Quantity Probability Outcome
50 0.50 25
40 0.15 6
20 0.15 3
10 0.20 2
36
Cost/direct labor hour = $12.00 + 18.00 = $30.00 per hour
Cost of repair material = $7.00 × 0.5 = $3.50 per housing
Rejection/repair cost per production lot
= $509,000

17–78
17–60 (Continued)
2. The sample size that Ross Webster should select from a lot of 800 housings is 265
units, calculated as follows:
nc = [(2.00)2 × (0.01) × (0.99)] ÷ (0.01)2
= 0.0396 0.0001
= 396
3. a. Two defective housings in a sample of 240 is a 0.0083 rejection (error)
Chapter 17 – The Management and Control of Quality
17–79
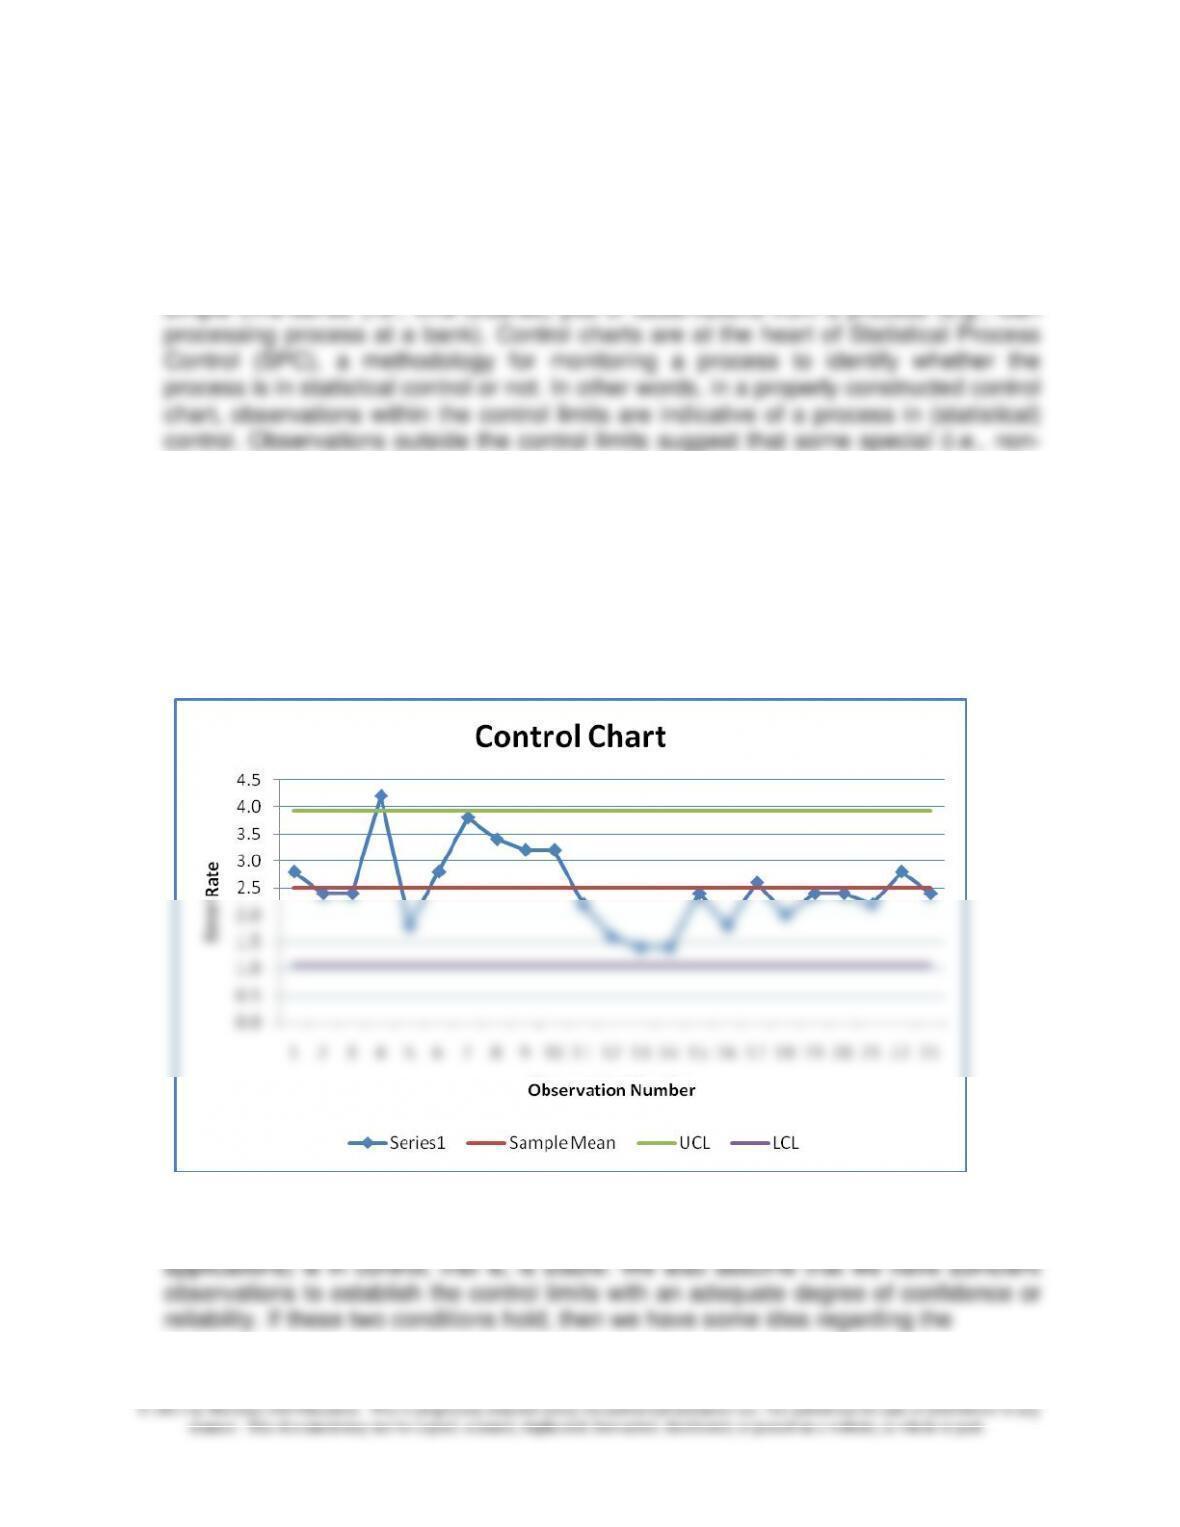
17–61 Constructing and Interpreting a Control Chart (45-60 Minutes)
1. A “control chart” might best be thought of as a time-series run chart with statistically
determined upper and lower control limits, around a target value (usually defined as
the mean value of the characteristic under examination). By contrast, a run chart is a
random) factor is at work.
2. Construction of Control Chart:
Sample mean of process = 2.50
Sample standard deviation = 0.72
No. of standard deviations = 2
Upper-Control Limit (UCL) = 3.94 (i.e., 2.50 + [2.0 × 0.72])
Lower-Control Limit (LCL) = 1.07 (i.e., 2.50 − [2.0 × 0.72])
3. Interpretation of control limits: we assume that the sample observations were
obtained during the time that the underlying process (in this case, processing of loan

Chapter 17 – The Management and Control of Quality
17–80
“normal” or inherent variation of the process we are observing. We know that any
process is subject to variation over time. Our goal in constructing the Control Chart is
to develop a tool that will provide an indication of when, going forward, the process is
likely in or out of statistical control. Because we are working with some uncertainty,
control limit, there is very little chance that random causes are at work. That is, there
is a greater chance that something about the process might be awry.
4. As indicated above in (3), the basic approach to judging process control is statistical
in nature. That is, on the basis of whether or not actual observations fall within the
control limits we draw a conclusion as to whether the process is in control (i.e., the
variations we are observing have random, or non-systematic, causes) or out-of–
control. This approach is sometimes referred to as the “outlier” approach to
interpreting results from a Control Chart.
Another approach would be to look for what appear to be an abnormal number of
runs. The likelihood of a stable process generating, say, eight points in a row on the
same side of the centerline is like tossing a coin and getting “tails” eight times in a
explain the trend may be desirable.
Finally, we might look for cycles, or repeating patterns of observations. Again, rules–
of-thumb might be useful. We might, for example, look at 14 or 15 data points to see
whether these points alternate in an “up” and “down” fashion. Such repeating results
(cycles) might reflect shift–to-shift or operator-to-operator or machine–to-machine
variation.
5. Some plausible quality measures for non-manufacturing companies:
a) Hospitals—lab test accuracy, insurance claim accuracy, on-time delivery of meals
and medications

Chapter 17 – The Management and Control of Quality
17–81
17–61 (Continued)
d) Police Department—incidence of crime in the precinct, number of traffic violations
17–62 Research: Applying Lean Principles to “Knowledge Work” (60 minutes,
including reading time)
1. The term “lean,” as derived from the Toyota Production System, can be taken to
mean “relentless attention to detail, commitment to data-driven experimentation, and
charging employees with the ongoing task of increasing efficiency and eliminating waste
2. The term “knowledge work” is used by the authors of this article to mean any decision
process (or operation) that involves judgment and expertise (so–called “tacit
knowledge”—that is, knowledge “locked inside the worker’s head). Unlike many
manufacturing contexts (in which work processes can more or less be defined
unambiguously and therefore modeled), conventional wisdom holds that “knowledge–
principles.
3. Perhaps the most significant assertion is stated at the very end of the article (p. 110):
turning a knowledge operation into a lean system is difficult, but possible; this very
difficulty implies that the system will be hard for competitors to replicate. In other words,
similar to projects for which lean principles were not applied). On average, lean projects
were completed in 5% less time and 9% under budget (comparable non-lean projects,
on average, finished on time and 2% under budget).
4. The authors believe (based on their experience of over 1,800 projects at Wipro

Chapter 17 – The Management and Control of Quality
17–82
17-81 (Continued-1)
Continually Root Out/Eliminate Waste
The authors assert that even in knowledge work, there are routine activities that do not
involve judgment or expertise and that are therefore candidates for application of “lean
principles.”
The key, according to the authors, is to (p. 103) “get everyone in the organization to
systematically make waste visible and (then to) do something about it.” To accomplish
this, the authors offer the following specific strategies: teach everyone in the
organization to ask “the five whys” (as practiced at Toyota); encourage employees to
look for small forms of waste, not just big ones; use value-stream mapping to identify
both value-added activities and waste; and, periodically review the structure and content
of every job (thereby reinforcing the point of continuous improvement or the
organization’s long–term commitment to “lean”).
Strive to Make Tacit Knowledge Explicit (i.e., Specify the Work)
Basically, this objective challenges the notion that all knowledge (in knowledge-based
work) is inherently tacit. Rather, it implies that (p. 105) a “surprisingly large amount of
knowledge work can be specified.” In this regard, the authors offer a four-step process
to specifying knowledge work:
(a) Look for and then codify repeatable parts of the process.
(b) Don’t try to specify everything initially, if ever.
(c) Use data to get employee/worker buy-in (i.e., many highly trained
repetitive in nature and therefore capable of being codified)
Structure Communications (i.e., how workers should communicate with one
another)
The workplace today is truly global in nature: work teams may have members from all
over the world. Thus, an effective employee communication plan or structure should be
in place to determine how employee communications should take place.
Three suggestions are offered by the authors in terms of structuring communications:

Chapter 17 – The Management and Control of Quality
17–83
17-81 (Continued-2)
(a) Define who should be communicating, how often, and how (Wipro used
something called a “design structure matrix” to help in this regard)
(b) Create a shared understanding of what work is required and by whom—this,
in turn, allows employees to (p. 107) “spend time solving problems rather
than trying to figure out the job at hand.”
(c) Resolve disagreements with facts, not opinions
Use the Scientific Method to Solve Problems as Soon as Possible (i.e., Address
Problems Quickly and Directly)
To adapt the “scientific method” to knowledge work, the authors suggest the following:
(a) If a problem arises, ideally the person who created the problem should fix it
(people closest to a problem typically know the most about it; therefore,
(c) Solve problems as soon as possible after they emerge (the fresher the
information about a problem, the less subject it is to distortion and the easier
it becomes to find a fix for the problem)
Plan for an Incremental Journey: A Lean System Takes Years to Build
(a) Start small (e.g., use pilot projects, to explore for your organization whether a
lean approach is a viable option)
(b) Codify lessons learned
at hand is visionary and/or experimental don’t classify and view time needed
to come up with “wild ideas” as wasteful, and therefore subject to elimination)

Chapter 17 – The Management and Control of Quality
17–84
17-81 (Continued-3)
Engage Your Managers—Leaders Must Blaze the Trail
In the end state, frontline workers generate and implement new ideas. However, during
the developmental process (implementation of lean), the involvement and support of
middle and senior managers are critical:
(a) Project managers and other mid-level leaders should be heavily engaged in
Thus, senior management must treat the lean initiative as a long-term
change program that ultimately will make the organization more competitive.

Chapter 17 – The Management and Control of Quality
17–85
CHECK FIGURES
17–22 1 sigma = 317,310.51 defects per million; 3 sigma = 2,699.80 defects per million
17–23 No check figure.
17–24 No check figure.
implementation of JIT = $822,000; difference = $732,000
17–35 No check figure.
17–36 No check figure.
17–37 No check figure.
17–38 No check figure.
17–39 No check figure.
17–40 1. Manufacturing cost savings associated with the reduction in rework costs =
$119,700; 2. Financing cost savings associated with inventory reduction =
$18,000; 3. Total estimated savings due to quality-improvement program =
$137,700.
2013 = $955, 2014 = $405; Total Internal Failure Costs: 2013 = $930, 2014 =
$540; Total Cost of Quality (COQ): 2013 = $3,485, 2014 = $2,045.

17–86
17–51 1. Total Prevention Costs: 2013 = $220, 2014 = $530; Total Appraisal Costs:
2013 = $955, 2014 = $405; Total Internal Failure Costs: 2013 = $930, 2014 =
$540; Total Cost of Quality (COQ): 2013 = $3,485, 2014 = $2,045; 7. Revised
2014 ratios: Prevention Costs to Sales = 2.85%; Appraisal Costs to Sales =
2.06%; Internal Failure Cost to Sales = 1.10%; External Failure Costs to Sales =
1.45%.
$1,500,000; Annual Net Financial Benefit (Cost) of switching to JIT = $712,900.
17–58 No check figure.
17–59 2. Net promoter score = 2.8% (i.e., 36.2% − 33.4%)
17–60 1. Maximum amount Paragon Manufacturing would be willing to spend
annually= $509,000 (which is equal to the expected cost of rejections and
repairs without quality control inspection); 2. Sample size, nf = 265 units; 3a.