Unlock document.
This document is partially blurred.
Unlock all pages and 1 million more documents.
Get Access
Chapter 17 - The Management and Control of Quality
17-61
17-53 Cost-of-Quality (COQ) Reporting; Spreadsheet Application (45–60 Minutes)
1. LEE ENTERPRISES
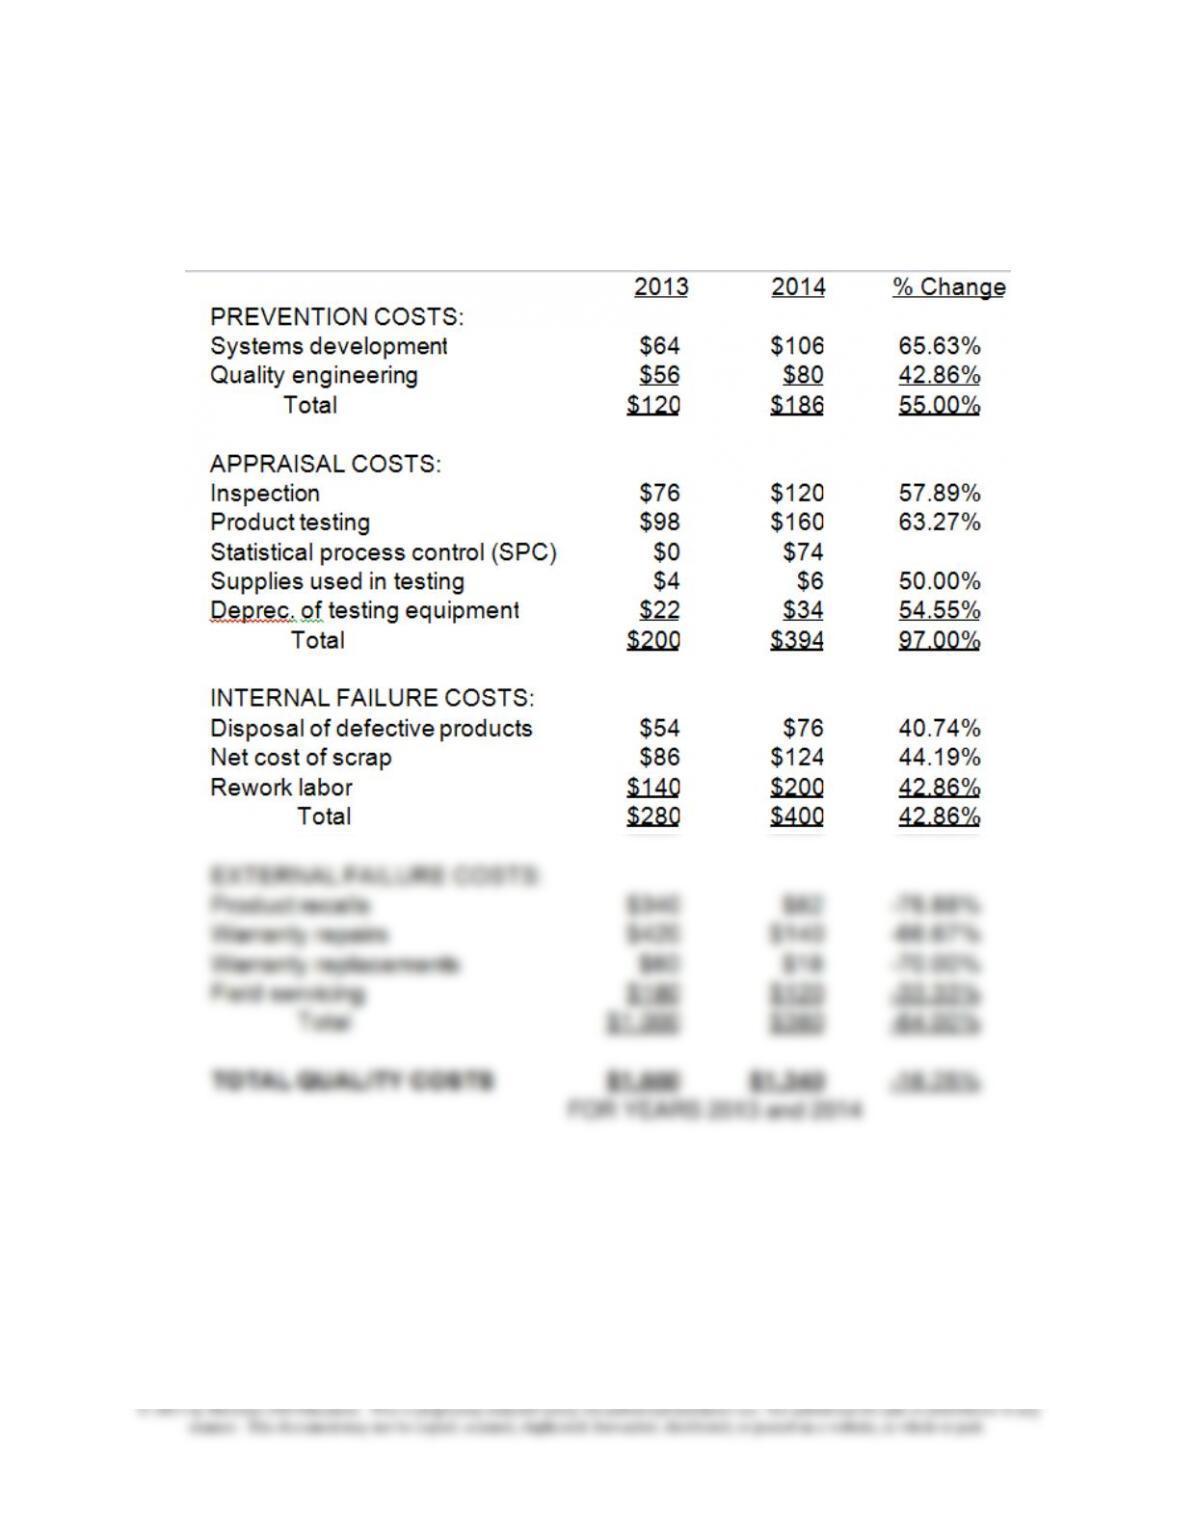
COST-OF-QUALITY REPORT
Chapter 17 - The Management and Control of Quality
17-62
17-53(Continued-1)
2.
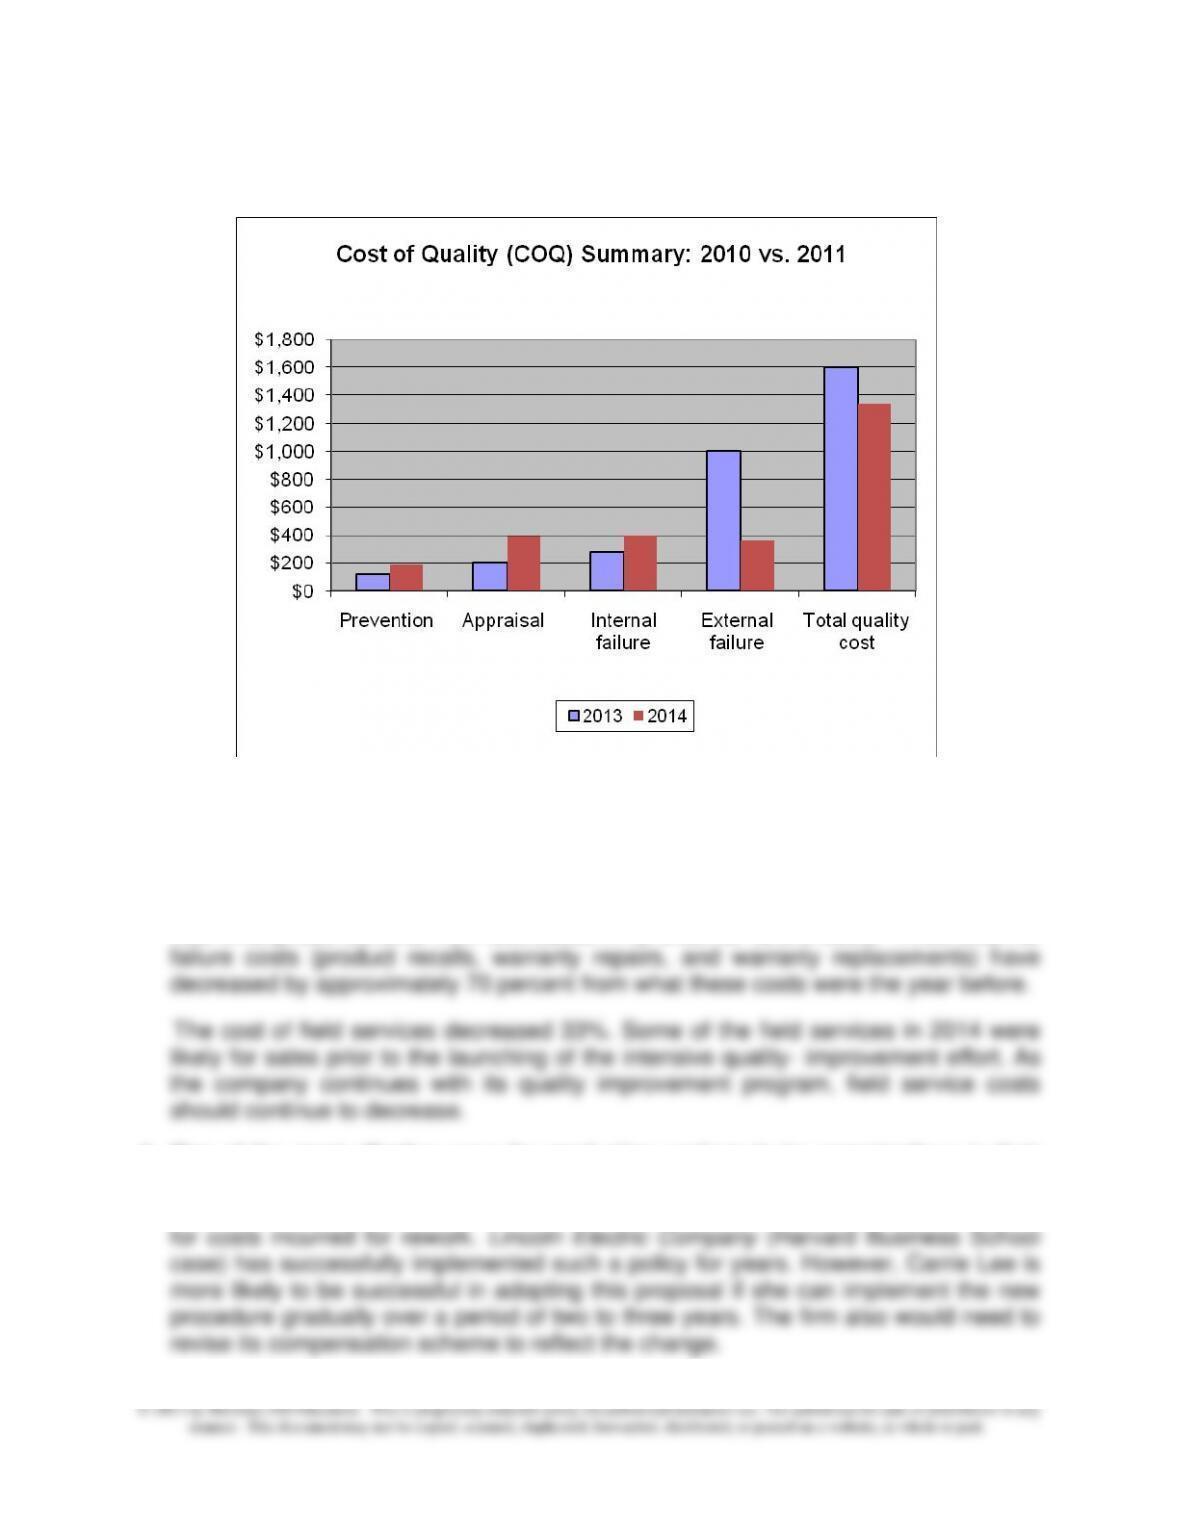
3. The report indicates that prevention, appraisal, and internal failure costs have
increased from 2013 to 2014. The external failure cost category decreased by 64%.
It is likely that the intensive efforts to improve quality has begun to pay off as,
indicated by a decrease of approximately 16% in total COQ from 2013 to 2014.
Lee Enterprises benefits from decreases in its external failure costs. Three external
4. One of the most effective ways for production workers to be conscientious in their
work is to hold them responsible for mistakes. Holding employees responsible for
their work can include a policy for workers to do rework on their own time and to pay
17-63
17-53 (Continued-2)
Note: Two linked Excel spreadsheet solution files for this Problem are embedded
below. You can open each spreadsheet “object” by doing the following:
1. Right click anywhere in the worksheet area.
2. Select “worksheet object” and then select “Open.”
3. To return to the Word document, select “File” and then “Close and return to...”
while you are in the spreadsheet mode. The screen should return you to this
Word document.
17-54 Relevant Costs and Quality Improvement (20–30 minutes)
1.
Lightening Bulk Company
Cost and Benefit Analysis of the Proposed
Scheduling and Tracking System
Cost of the new system (per year) $ 150,000
Expected benefits each year from the new system:
Contribution margin from sales increase:
(5,000 × 10%) × $200 × 40% = $ 40,000
The new scheduling and tracking system will most likely decrease the firm‘s pre-tax
cash flow per year. Thus, from a purely financial point of view the company cannot
justify the purchase of the new system.
2. Among other factors the manager needs to consider are: reliability and accuracy of
the estimates, including contribution margins, cost of tracking misplaced and lost
items (and their behavior patterns), and the estimated decreases in misplaced and
Pr. 17-53(a).xlsx
Pr. 17-53(b).xlsx

Chapter 17 - The Management and Control of Quality
17-64
3. Cost to handle lost or misplaced items in the country in question:
Misplaced items: 5,000 × 12.0% × 0.8 × $60 = $28,800
Chapter 17 - The Management and Control of Quality
17-65
17-55 Quality Improvement; Relevant Cost Analysis (50-60 Minutes)
1. Cost of new equipment and installation $12,000,000
Training 3,000,000
2. Quality cost if no change is made:
Rework (3,000 × 40%) × $2,000/unit = $ 2,400,000
Repair (3,000 × 15%) × $2,500/unit = 1,125,000
Appraisal 600,000
Inspection 3,000 × $50 = 150,000
Foregone contribution from lost sales:
Contribution margin per unit:
($12,000 × 85%) − $2,500 = $7,700
Lost sales units = (3,000 0.8) − 3,000 = × 750 5,775,000
Total current cost of quality per year = $10,050,000
Quality cost of the new process:
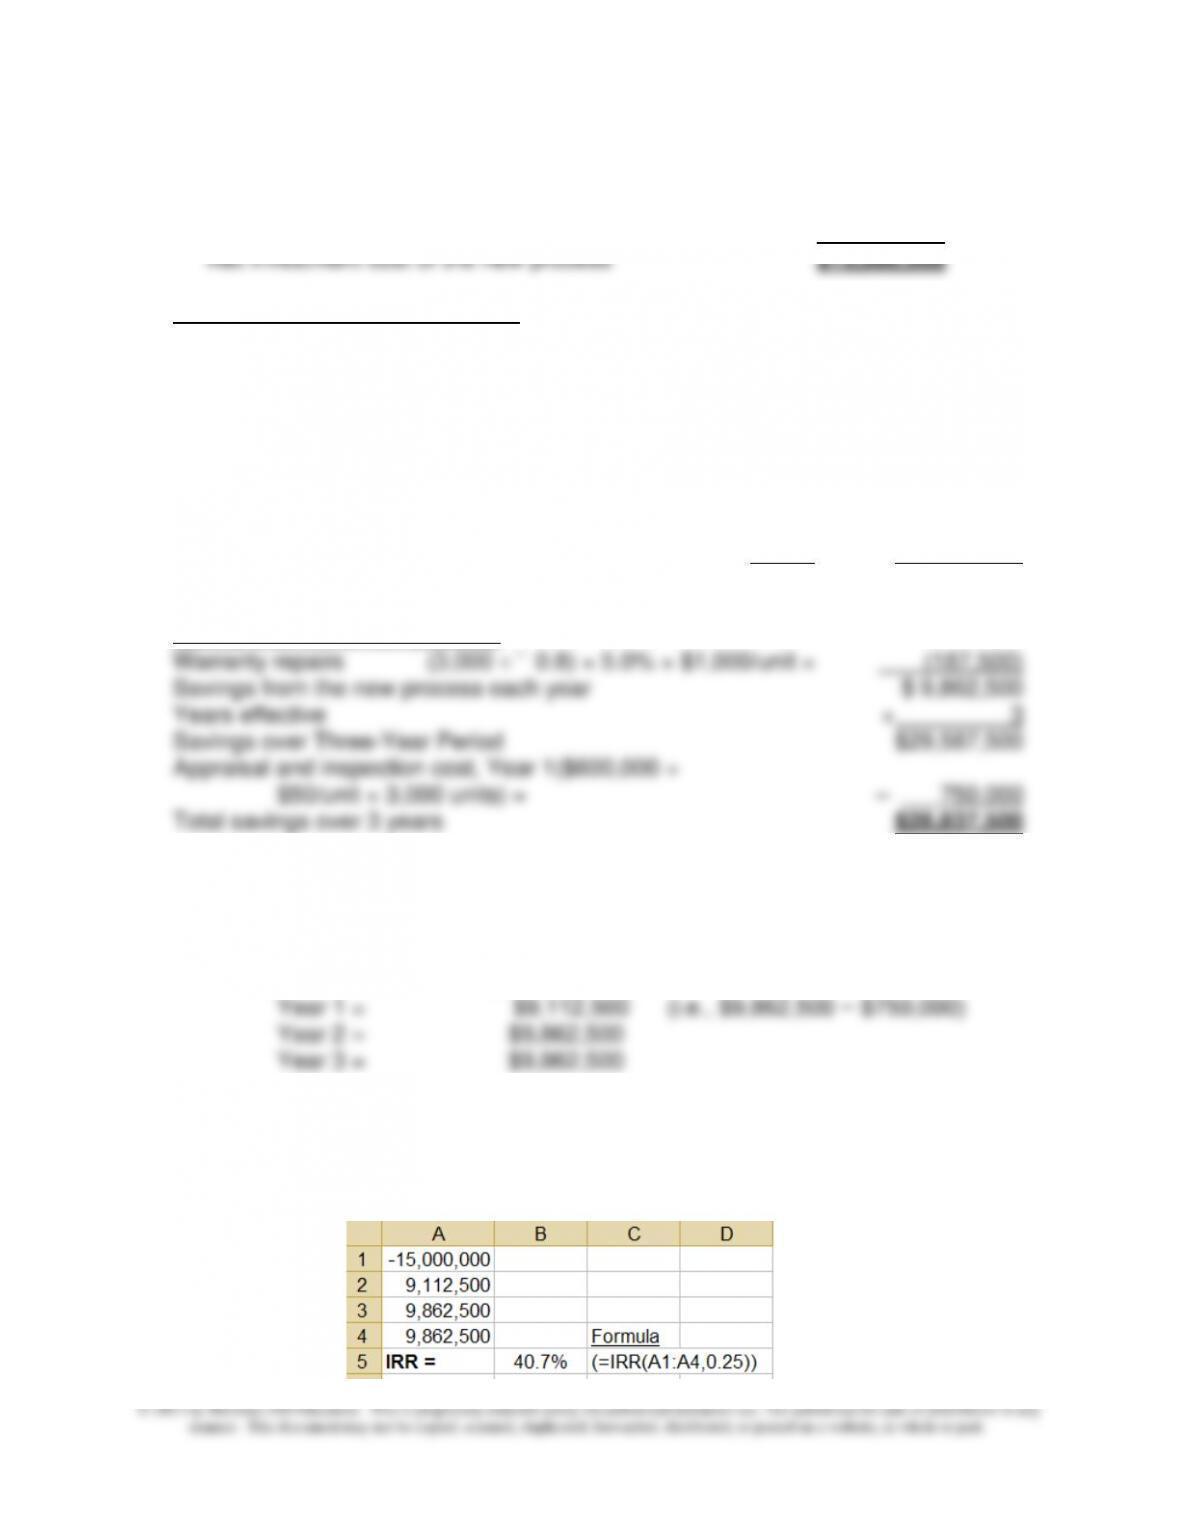
3. Yes. The cost of the new process is $15,000,000 and the expected benefits total
$28,837,500 over three years. The pattern of pre-tax cash flows for this investment
opportunity is as follows:
Year 0 = ($15,000,000)
Thus, the payback period for this proposed investment is less than two years. Its
internal rate of return (IRR) is approximately 41%, as shown in the following screen
shot from Excel:
17-66
17-55 (Continued)
4. The following factors should be considered before making the final decision:
a. Accuracy of cost estimates, including:
▪ contribution margin per unit
d. Time-value-of-money factor (discount rate) for capital budgeting decision-
making
5. The member of the board would be right if we ignore the financial payoff of the new
process and if the company is going to be in business for only three years. Having
high-quality products, especially for a high-end product such as the one the
company is selling, is crucial for a long-term success.
Chapter 17 - The Management and Control of Quality
17-67
17-56 Analyzing Cost of Quality (COQ) Reports (60 Minutes)
1. There is an extensive literature in the area of “change management” from which
students can draw in order to respond to this question. Based on this literature, the
following factors might be mentioned as being critical for an organization's
successful quality program:
▪ Evidence of top-management support, including motivational leadership and
to continuous, dynamic improvement; related to this is the need to develop an
effective reward system (i.e., link performance and compensation).
2.
BERGEN, INC
Quality Cost Report
Most Recent and Most-Distant Quarter
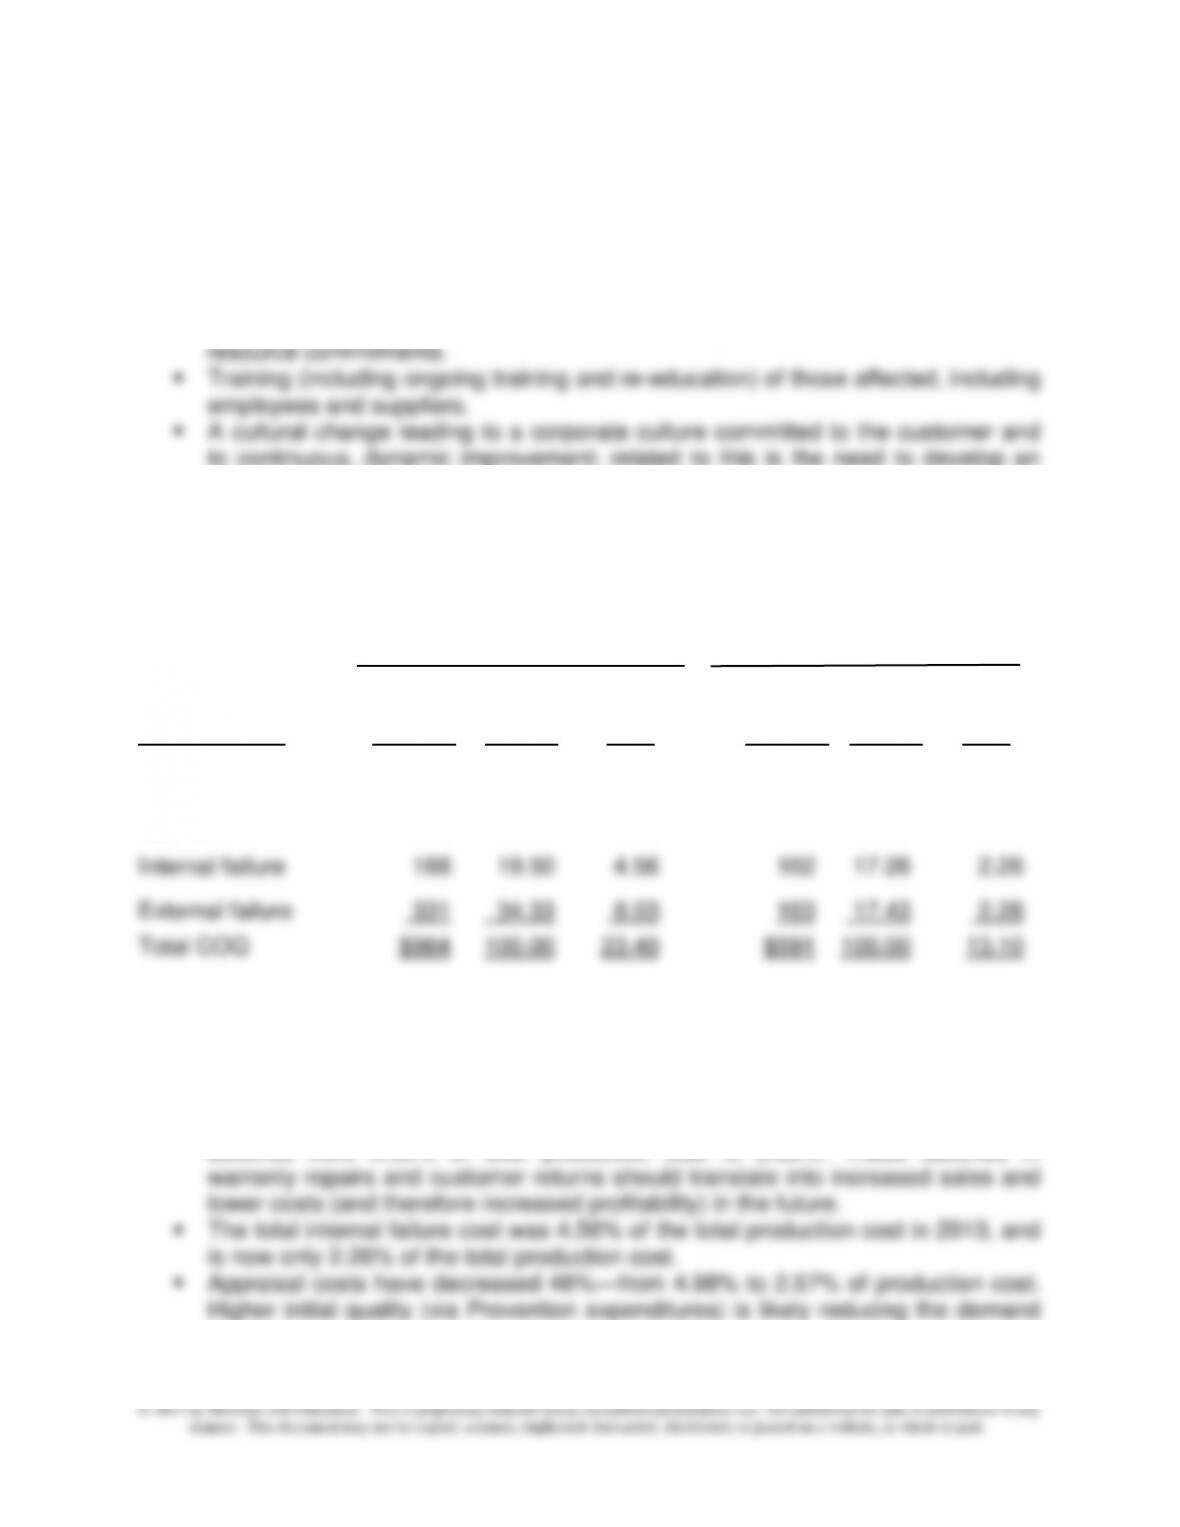
6/30/2013 9/30/2014
% of % of % of % of
Quality Amount Quality Prod. Amount Quality Prod
Cost Category (in ‘000) Cost Cost (in ‘000) Cost Cost
Prevention $240 24.90 5.83 $270 45.68 5.99
Appraisal 205 21.27 4.98 116 19.63 2.57
From an analysis of the COQ Report (oldest vs. most recent quarterly results) it would
appear that Bergen Inc.'s program has been successful because:
▪ Total COQ as a percentage of total production cost has declined from 23.4% to
13.1%.
▪ External failure costs, those costs signaling customer dissatisfaction, have
declined from 8.03% of total production cost to 2.28%. These declines in
for testing.
17-68
17-56 (Continued)
▪ Quality costs have shifted to the area of prevention where problems are solved
before the customer becomes involved. Prevention costs, such as maintenance,
3. Tony Reese's current reaction to the quality-improvement program is more favorable
as he is seeing the benefits of having the quality problems investigated and solved
before they reach the production floor. Because of improved designs, quality
last assertion can be tested through the collection of relevant nonfinancial quality
indicators.)
4. To measure the opportunity cost of not implementing the quality program, Bergen
Inc. could assume that:
a. Sales and market share would continue to decline and then estimate the
5. This question is designed to make students think about a proper role of a COQ
reporting system as part of a comprehensive framework for managing and
controlling quality, such as the framework presented in Exhibit 17.3. The main point
is that COQ data can be a valuable attention-director. For example, many
organizations (confirmed by our own in-class discussions with MBA students) are
quantify in financial terms the impact of these failures on profitability. In short,
“diagnostic control” of quality is probably better achieved through the application of
techniques borrowed from operations management (“cause-and-effect diagrams,”
Pareto charts, etc.) applied to nonfinancial measures of quality. This suggests,
therefore, that one characteristic of a comprehensive framework for managing and
controlling quality is the use of both financial and nonfinancial quality indicators.
Chapter 17 - The Management and Control of Quality
17-69
17-57 Benefits of Switching to JIT (50-60 Minutes)
1. A JIT manufacturing approach is considerably different from a conventional
manufacturing system. Under JIT, an output is produced only when
demanded by the customer (internal or external). At the core of JIT is a
strong commitment to quality (i.e., eliminating or reducing processing
kept on-hand as a “cushion” to compensate for error, waste, and
inefficiencies, or for unforeseen circumstances. “Normal” inefficiencies, in
fact, are built into overhead application rates.
2. The response to this question can be crafted around an examination of
Exhibit 17.3. As indicated in this exhibit, the management accountant,
because of expertise in the area of measurement, can supply to
management relevant cost information and relevant nonfinancial
performance indicators associated with a change in manufacturing process,
such as a move to JIT.
Specifically, the management accountant can help estimate the financial
savings associated with inventory reductions and with manufacturing
assess the overall benefits associated with the move to JIT. These
characteristics of the manufacturing process are important to monitor
because they can be leading indicators of future financial performance.
3. Annual benefits associated with the proposed move to JIT—in general,
improvements in quality, such as those associated with the adoption of JIT,
result in two separate benefits: increases in revenues (or, contribution
margin), and decreases in costs.
Chapter 17 - The Management and Control of Quality
17-70
17-57 (Continued-1)
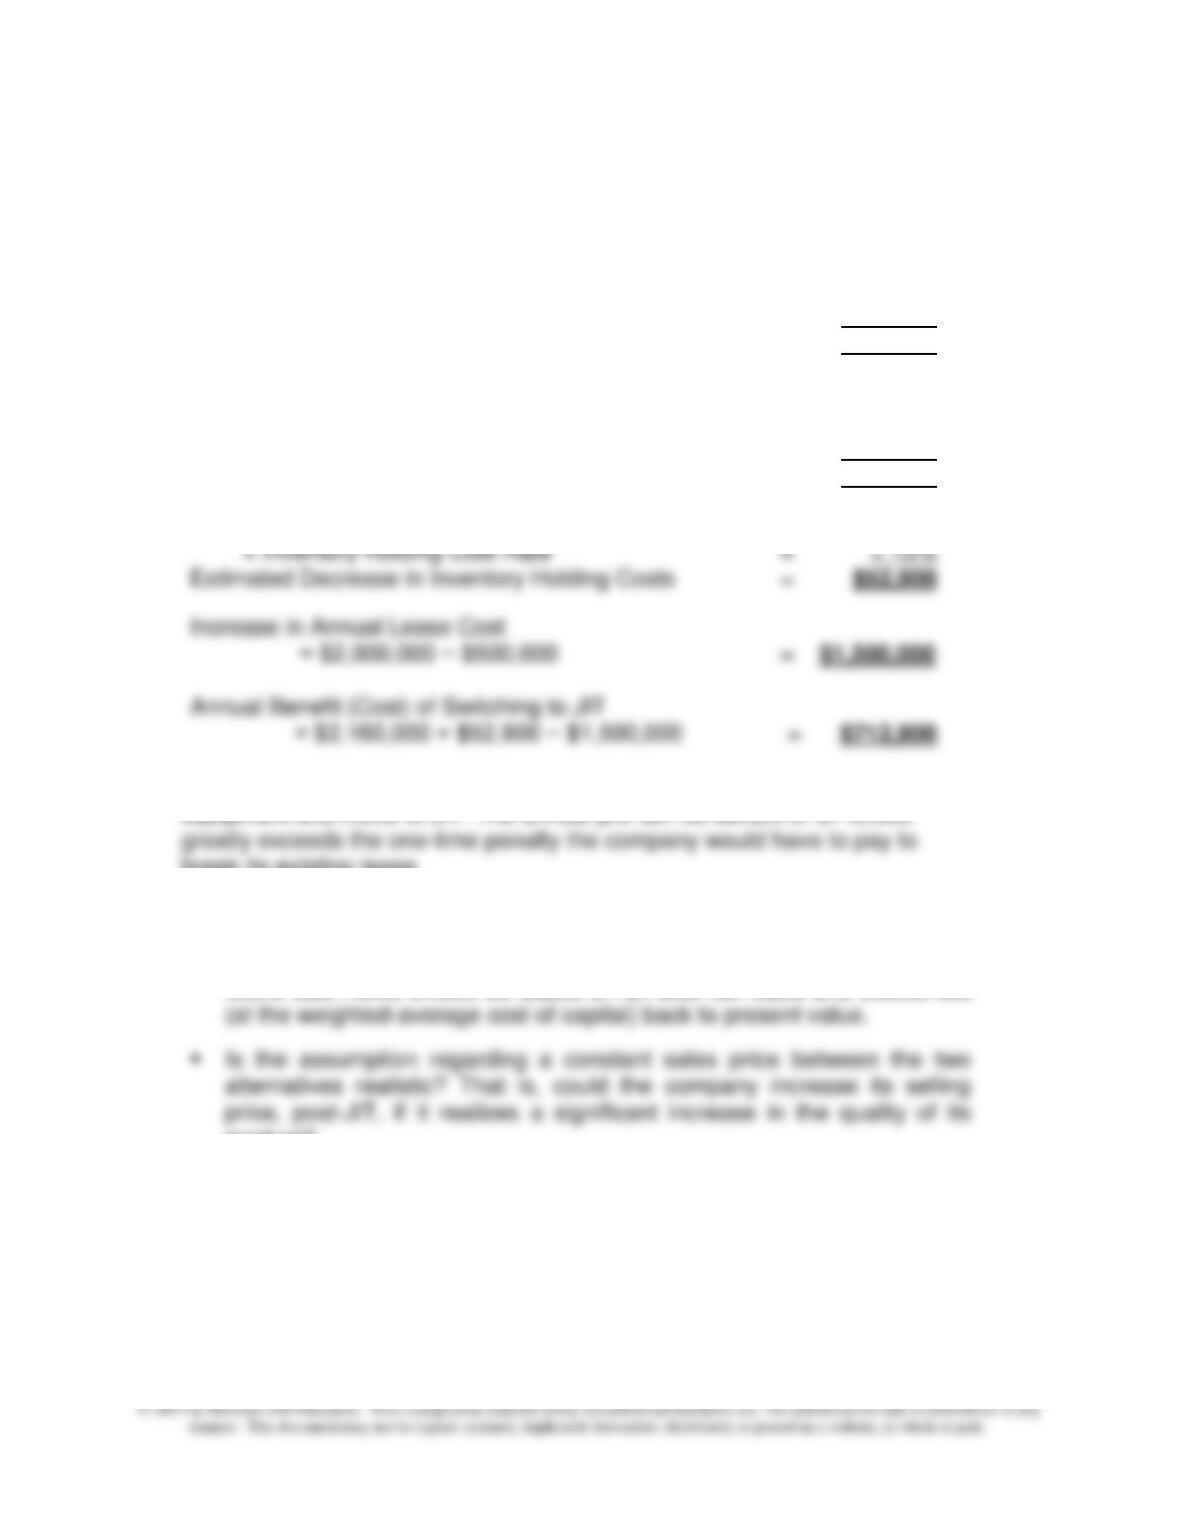
Estimated decrease in inventory carrying costs:
Pre-JIT Inventory Holdings:
Raw materials = 40,000 × $15 × (4 ÷ 12) = $200,000
WIP Inventory = 40,000 × $25 × (3 ÷ 12) = $250,000
Finished Goods = 40,000 × $40 × (2 ÷ 12) = $266,667
Average Inventory Holdings = $716,667
Post-JIT Inventory Holdings:
Raw Materials = 52,000 × $12 × (2 ÷ 12) = $104,000
WIP Inventory = 52,000 × $20 × (1.5 ÷ 12) = $130,000
Finished Goods = 52,000 × $30 × (1 ÷ 12) = $130,000
Average Inventory Holdings = $364,000
Difference in Average Inventory Holdings = $352,667
4. Based solely on the short-term financial effect, ABC should replace the
equipment and move to JIT. The annual pre-tax net benefit of $712,900
break its existing lease.
5. Additional considerations:
▪ This decision is technically a capital budgeting decision; as such, the
future cash flows should be stated on an after-tax basis and discounted
product?
Chapter 17 - The Management and Control of Quality
17-71
17-57 (Continued-2)
▪ JIT places significant pressures on employees and managers alike, to
constantly improve: is there an appropriate change agent in the
organization to lead this effort? Does the change have the full, and
planning efforts regarding the implementation of JIT?
▪ Has the cost of collecting, reporting, and interpreting key nonfinancial
quality indicators been factored into the analysis?
Chapter 17 - The Management and Control of Quality
17-72
17-58 Environmental Performance—Meeting Stakeholder Expectations (60 Minutes)
1. As indicated in the cited HBR piece, the following stakeholders are likely to be
interested in corporate disclosures regarding environmental performance:
2. The environmental performance scorecard created by Climate Counts
(http://www.climatecounts.org/pdf/Climate_Counts_Scorecard.pdf) consists of 22
items, broken down into four areas, as follows:
Review:
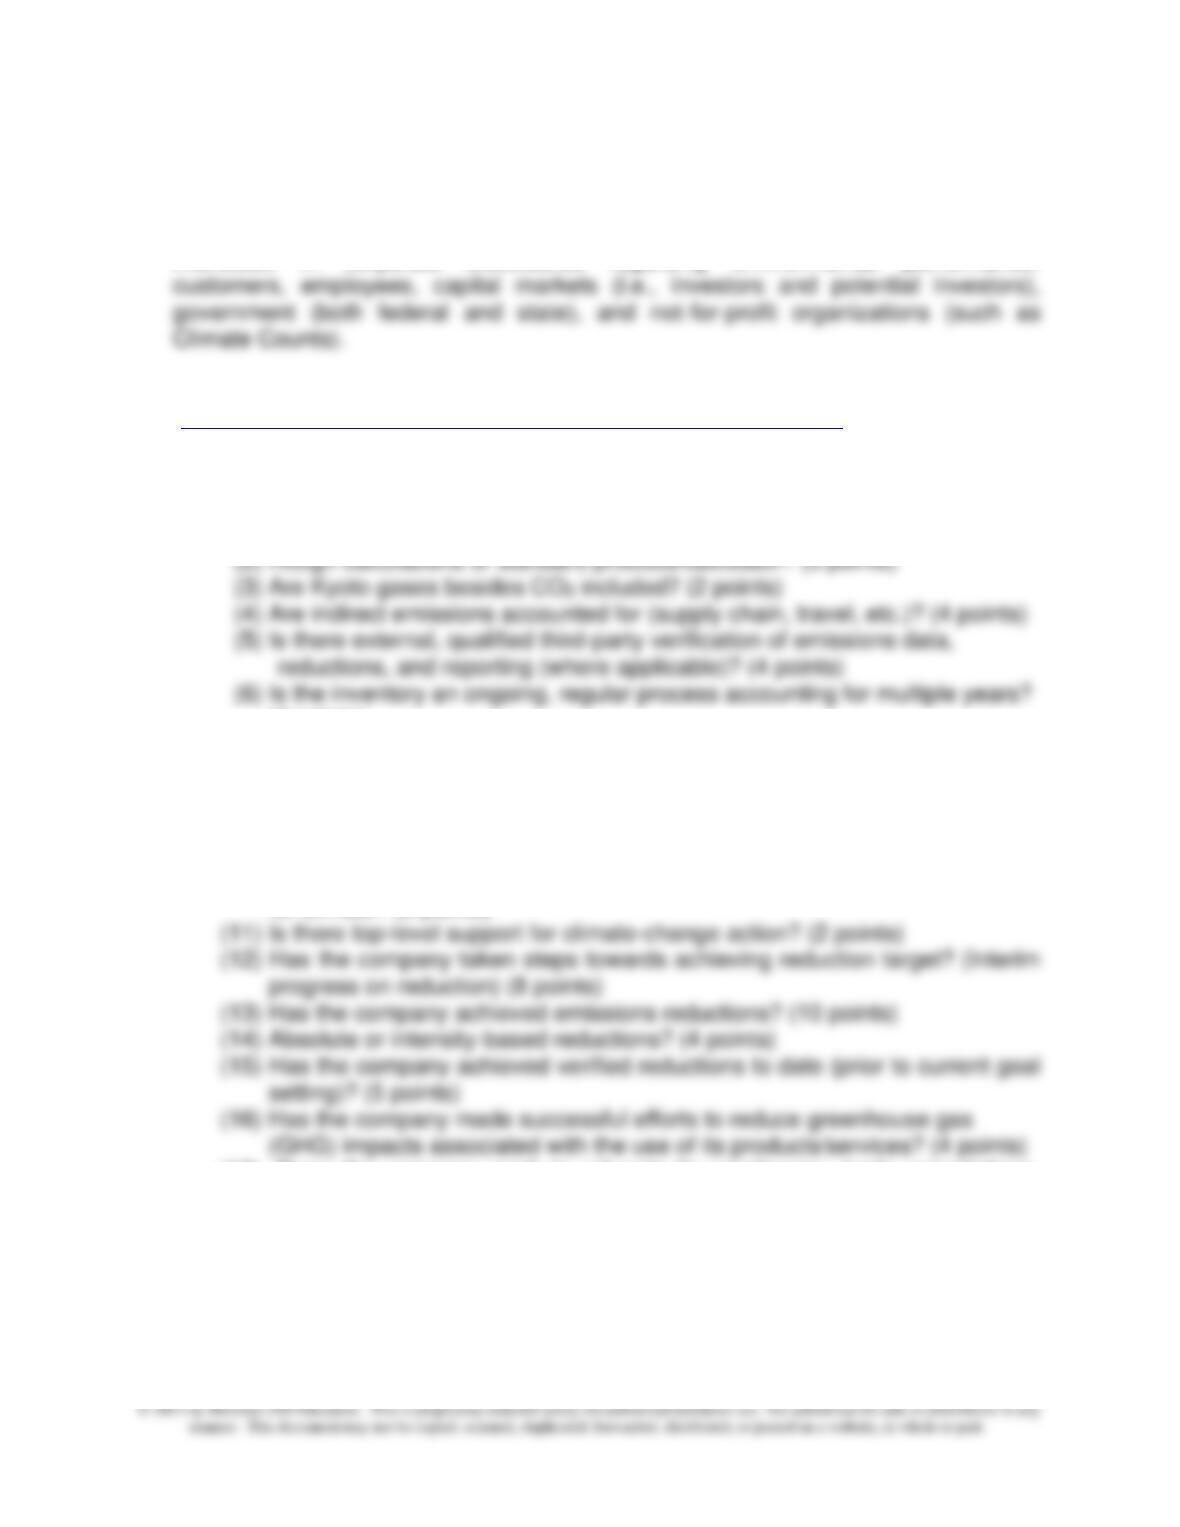
(1) GHS emissions inventory completed? (5 points)
(4 points)
Reduce:
(7) Has a clear goal been set? (4 points)
(8) Strength of baseline year used for the reduction goal? (3 points)
(9) Magnitude of reduction goal? (5 points)
(10) Have a measurement plan and organizational structure been established
for climate? (5 points)
(17) Does the company work to educate its employees, trade associations,
and/or customers on how they can reduce individual GHG emissions
(through direct education programs, incentives, or philanthropic projects?
(4 points)
(18) Does the company require suppliers to take climate change action or give
preference to those that do? (2 points)
Chapter 17 - The Management and Control of Quality
17-73
17-58 (Continued-1)
Policy Stance:
(19) Does the company support public policy that could require mandatory
Report:
(21) Is the company publicly reporting on emissions, risks, and actions? How is
information disclosed? Company-based (e.g., on their website or annual
report) or through a credible third-party program (e.g., CDP, GRI, etc.)? (10
points)
(22) Are emissions broken out by facility, business unit, country of operations,
or other meaningful sub-segments? (2 points)
3. As seen at http://www.climatecounts.org/scorecard_score.php?co=28 (accessed 25
November, 2011), IBM’s scorecard total for the current year is 82 (an increase of 3
points over last year’s score). It has scored highly in each of the areas, with the
possible exception of Policy Stance (4 out of 10 points). Its current score places it #2
among the 12 firms from the electronics sector. The website lists IBM as “striding,” as
follows:
Apple, on the other hand, scored last among 12 companies in the electronics industry
category (see http://www.climatecounts.org/scorecard_score.php?co=7, accessed 25
January, 2011). Apple’s current score is 60, a one-point change from last year, but
significantly above the score of three years ago (which score is mentioned in the HBR
article). Apple’s component scores are as follows: Review: 19/22 points. Apple has
resigned from the US Chamber of Commerce over the trade group's opposition to
comprehensive climate and energy legislation. Report: 8/12 points. Apple has made


