Chapter 17 – The Management and Control of Quality
17–31
17–37(Continued-1)
The instructor might want to use some of the following example disclosures from First
Energy Corporation (https://www.firstenergycorp.com/environmental.html) for illustrative
purposes:
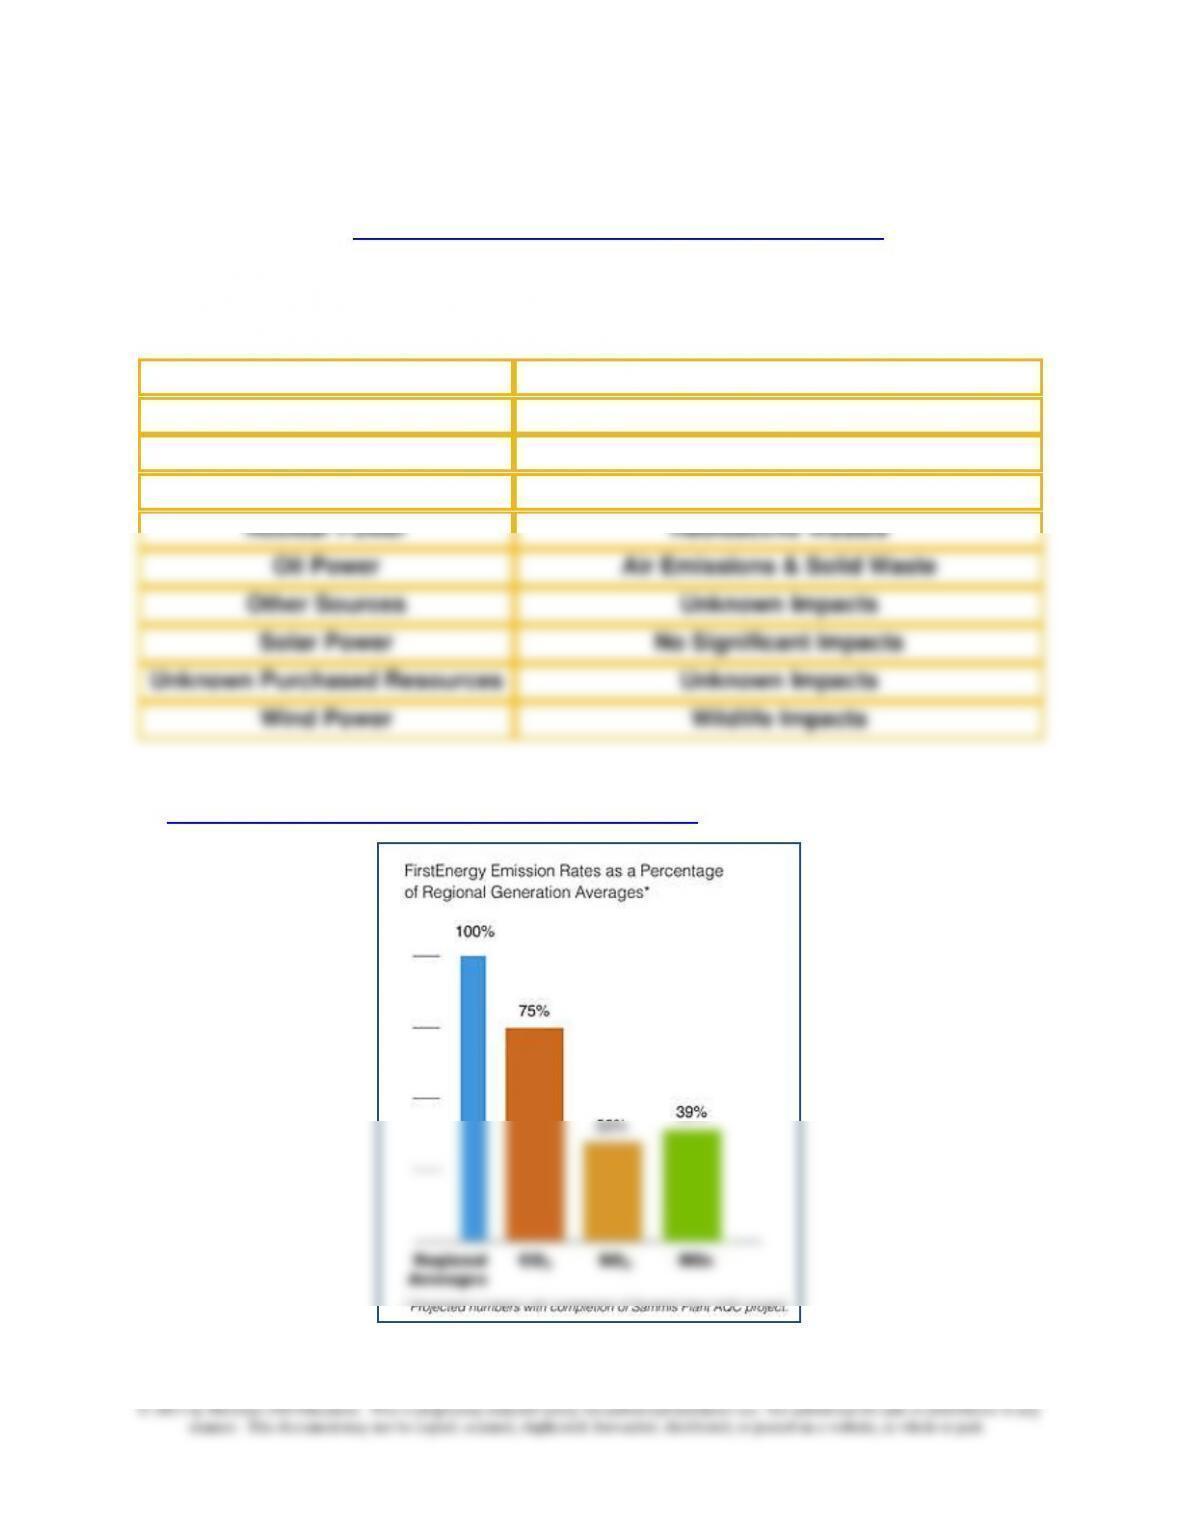
Environmental Characteristics Associated with Various
Sources of Power Generation
Biomass Power
Air Emissions & Solid Waste
Coal Power
Air Emissions & Solid Waste
Hydro Power
Wildlife Impacts
Natural Gas Power
Air Emissions & Solid Waste
Nuclear Power
Radioactive Wastes
Oil Power
Air Emissions & Solid Waste
Other Sources
Unknown Impacts
Solar Power
No Significant Impacts
Unknown Purchased Resources
Unknown Impacts
Wind Power
Wildlife Impacts
Air Emission Disclosure: First Energy Corporation, 2011
(https://www.firstenergycorp.com/environmental.html, accessed 25 November 2011)
website updated: 08 September 2011
Chapter 17 – The Management and Control of Quality
17–32
17–37(Continued-2)
Note: The following chart is no longer available on the FirstEnergy website, but is
viewed as instructive nonetheless.
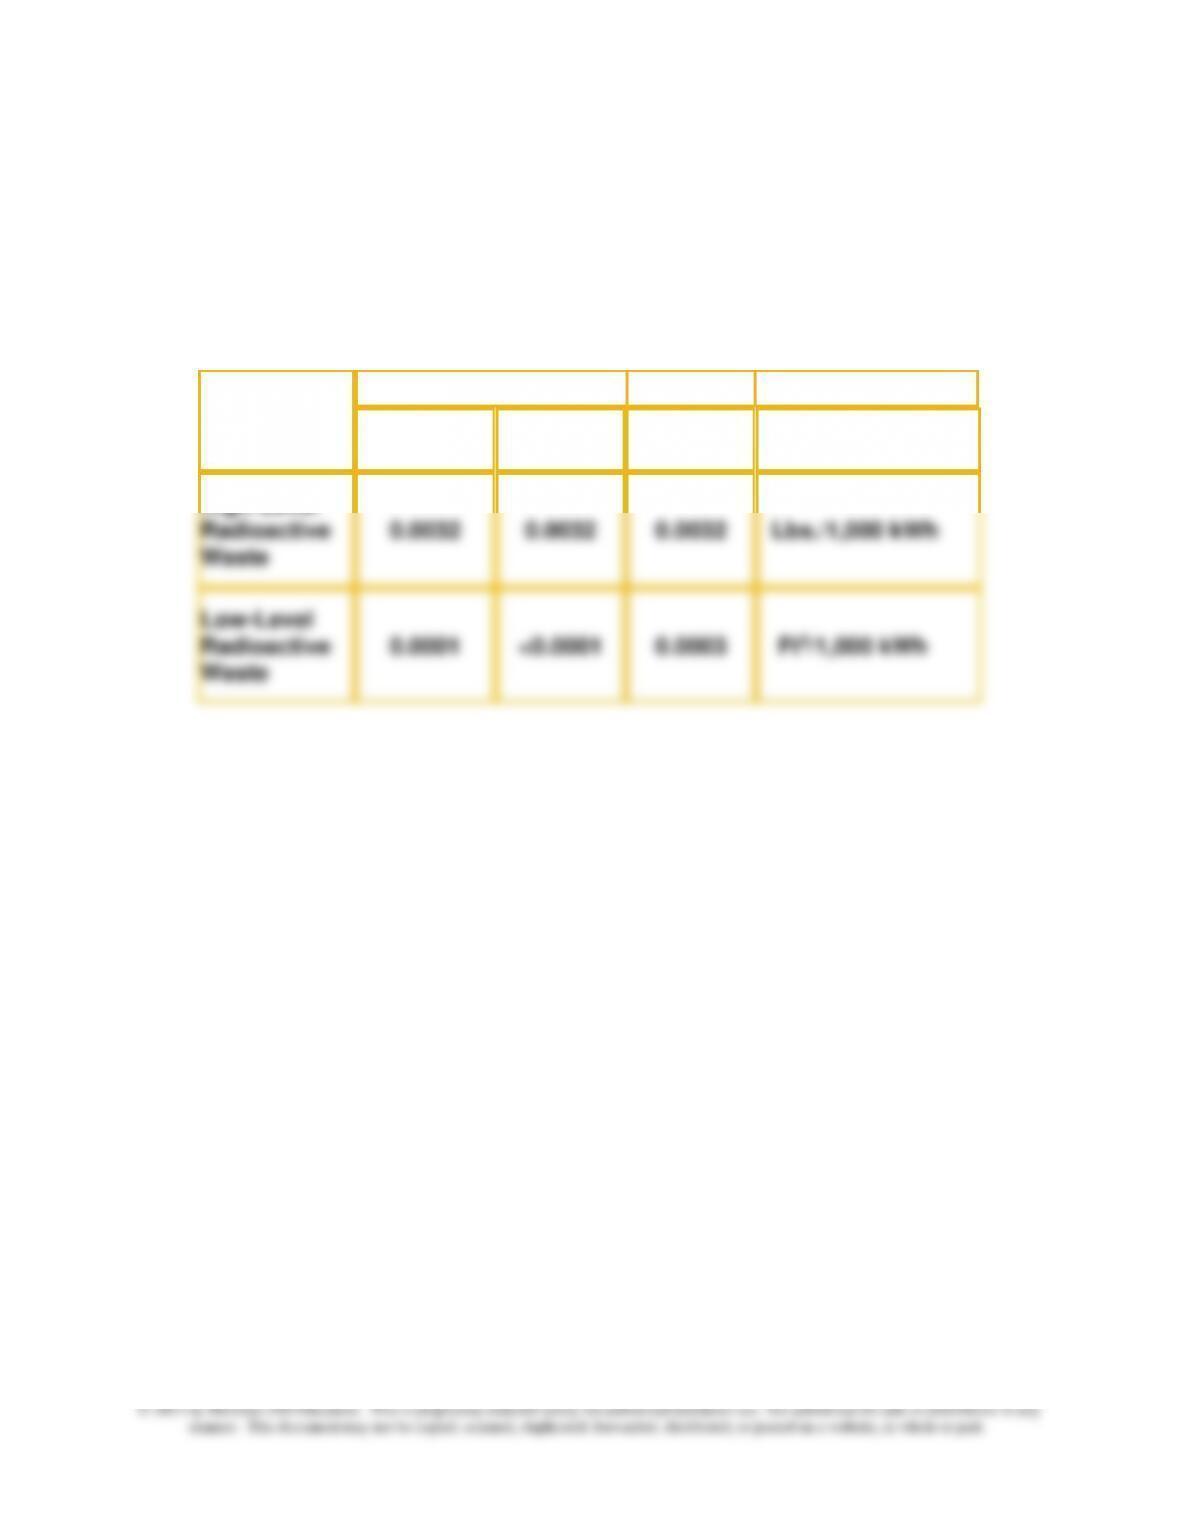
Radioactive Waste Produced:
Projected (2007) vs. Actual (First Three Quarters 2007)
and Projected Data for 2008
2007
2008
Projected
Quantity
Actual
Quantity
Projected
Quantity
Measure
High-Level
Radioactive
Waste
0.0032
0.0032
0.0032
Lbs./1,000 kWh
Low-Level
Radioactive
Waste
0.0001
<0.0001
0.0003
Ft3/1,000 kWh
Chapter 17 – The Management and Control of Quality
17–33
17–38 Assessing the Use and Role of Nonfinancial Performance Indicators (45-60
Minutes)
1. Nonfinancial performance indicators pertain to areas such as customer loyalty and
employee satisfaction. The authors of this cited article argue that monitoring and
reporting such measures as part of a comprehensive management accounting and
control system is important because:
• as represented by the framework known as The Balanced Scorecard (BSC),
performance in these areas represents a precursor to financial performance
drivers of competitive advantage in the so–called “knowledge economy”
• such performance measures can aid top management in terms of the
resource-allocation decisions it must make (across divisions, product lines,
managers, etc.)
• these indicators can, if appropriately developed, be used to assess
managerial performance
2. The authors hypothesize that many organizations are not able to reap the benefits of
including nonfinancial performance indicators in their management accounting and
control systems because:
• haphazard selection of the set of nonfinancial performance indicators—many
organizations simply fail to choose and act on the right measures; in short,
proliferation of performance measures, many of which are not useful
predictors of financial performance)
Chapter 17 – The Management and Control of Quality
17–34
17–38 (Continued)
• there is a natural tendency (i.e., bias) for managers to choose performance
measures that make these managers “look good;” this is especially a concern
increase progressively over time. Among other things, this approach is
consistent with a long-term (strategic) use of nonfinancial performance
indicators.
• measurement errors—that is, companies choose performance indicators that
are not psychometrically sound (i.e., evidence regarding the validity of the
measures is not established)
3. The Institute of Management Accountants (IMA) has recently (December 11, 2008) a
revised its definition of “management accounting” (http://www.imanet.org [requires
log-in name and password]). This statement indicates that management accounting:
… is a profession that involves partnering in management decision–
making, devising planning and performance-management systems, and
an organization’s strategy. This implies a substantive role in the design of an effective
control system that includes both financial and nonfinancial performance measures.
Source: Christopher D. Ittner and David F. Larker, “Coming Up Short on Nonfinancial
Performance Measurement,” Harvard Business Review (November 2003), pp. 88-95.
Chapter 17 – The Management and Control of Quality
17–35
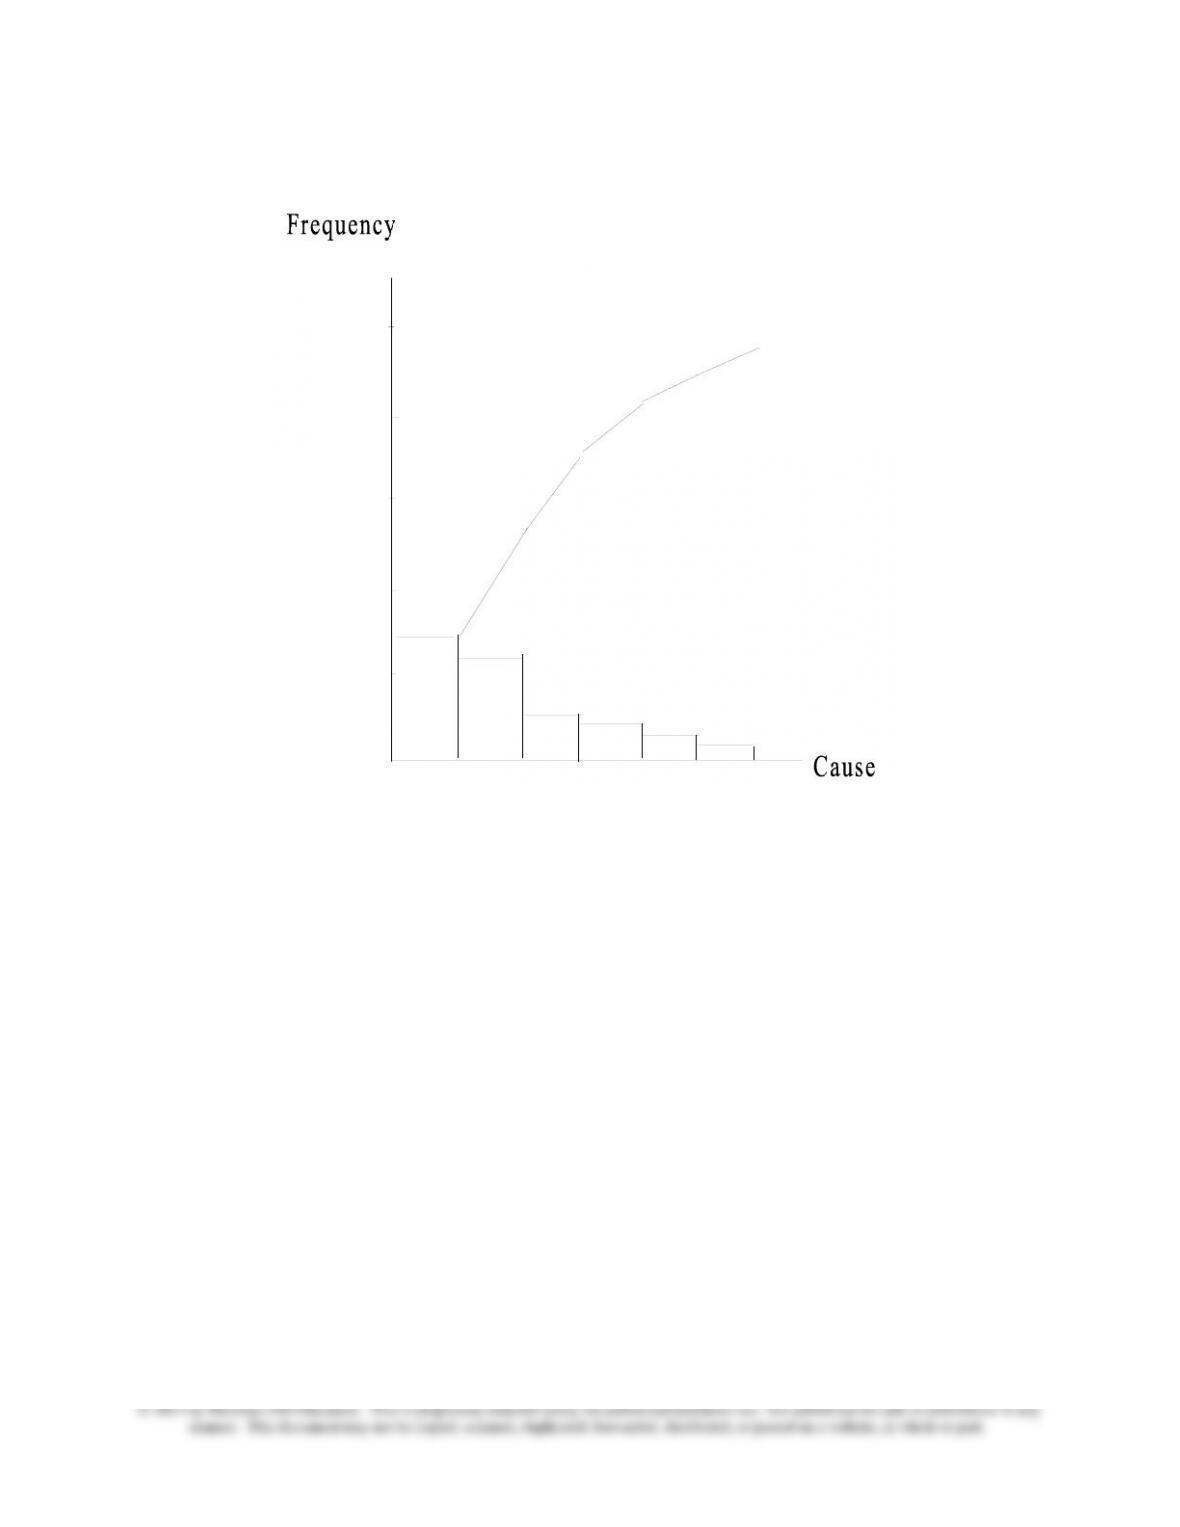
17–39 Pareto Diagram (15 minutes)
(1) (2) (3) (4) (5) (6)
(1) Personal emergency (32) (4) Unexpected visitor (11)
(2) A child’s illness (26) (5) Overslept (9)
(3) Personal illness (12) (6) Car broke down (8)
Pareto Charts (Diagrams) can be used for diagnostic control purposes, that is,
to identify the primary causes of an identified quality problem (such as
“absenteeism”) and, as such, to identify possible solutions to the problem. These
charts are named after the Italian economist Vilfredo Pareto; they provide a
prioritization of causes of an indicated quality problem, based on frequency of
occurrence. Thus, they focus attention on causes that could offer the greatest
potential for improving quality. A loose interpretation of the information contained
in Pareto charts is that a relatively small number (e.g., 20%) of causes represent
a majority (e.g., 80%) of reasons for the quality failure (here, absenteeism).

17–36
17–40 Relevant Cost Analysis—Quality Improvements (20-30 Minutes)
Estimated cost savings resulting from the recently enacted quality program come from
two sources:
1. Manufacturing cost savings associated with the reduction in rework costs:
= (reduction in reject rate) × (annual volume of output) × (total rework cost per
unit)
= (0.05 − 0.035) × 15,000 units × [($480 − 70 − 200) + ($362 – 80) + ($80 −
3. Total estimated savings due to quality improvement program
= rework cost savings + inventory financing cost savings
Chapter 17 – The Management and Control of Quality
17–37
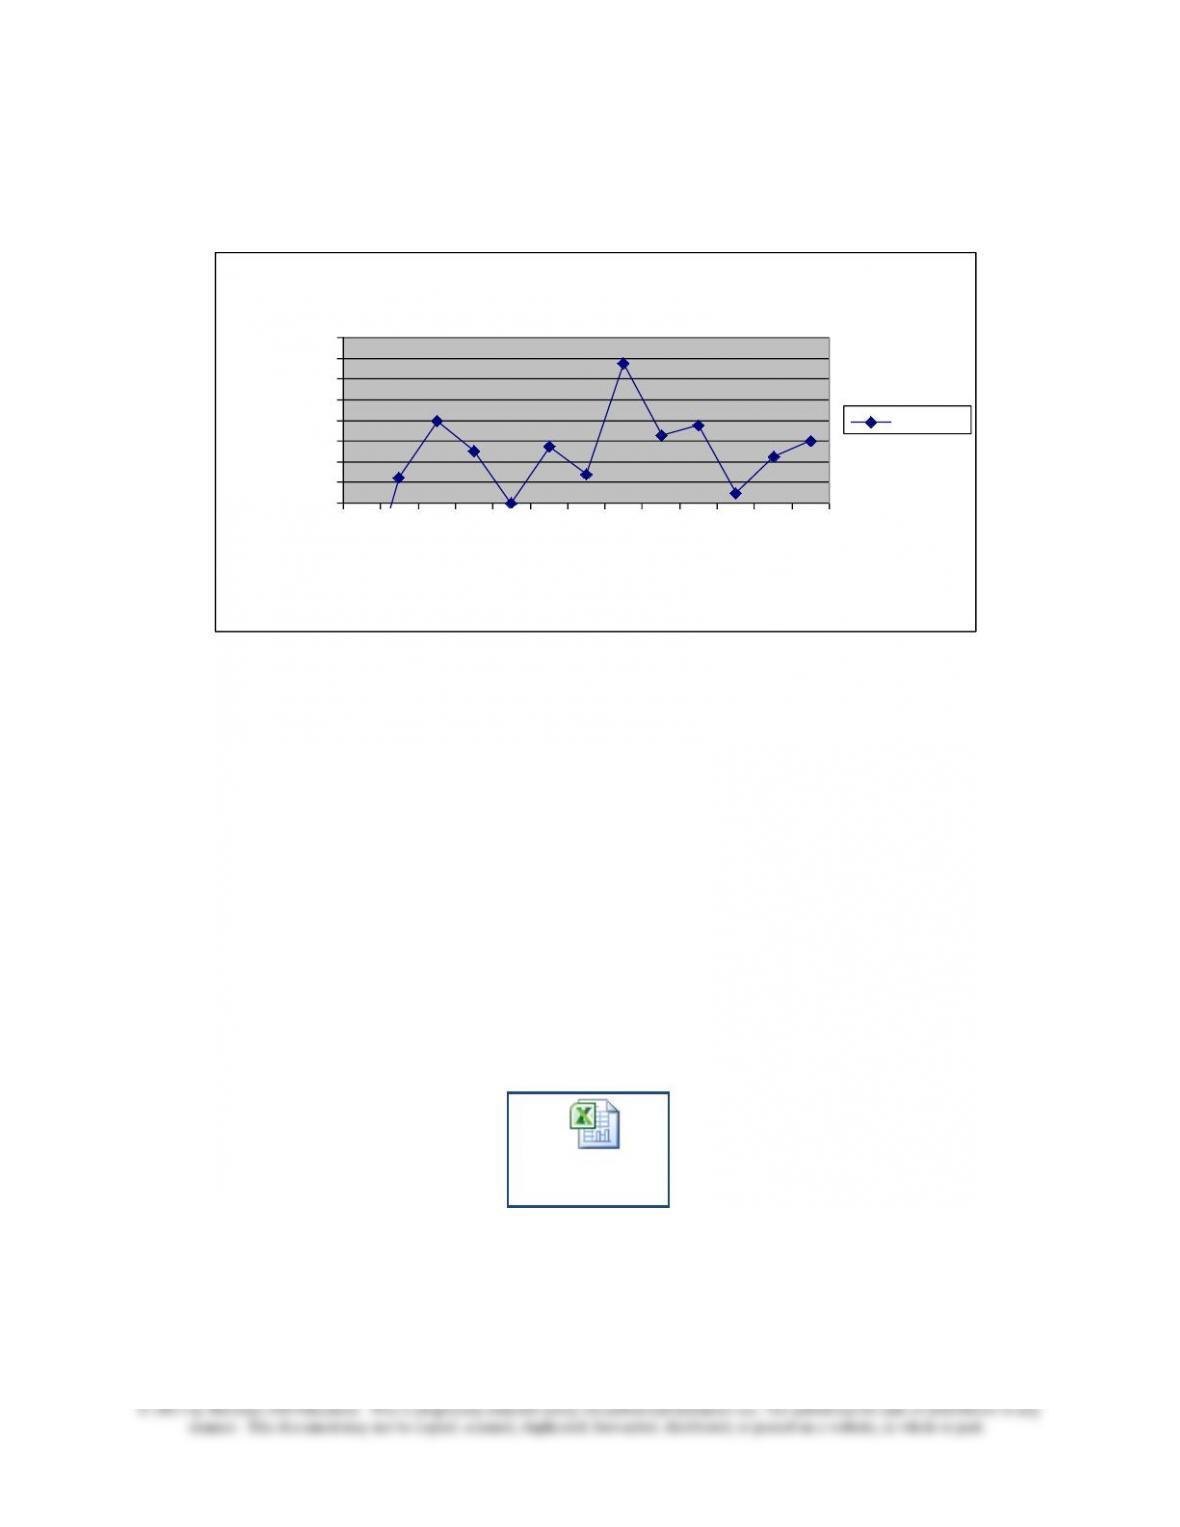
17–41 Control Chart; Spreadsheet Application (45 Minutes)
1. Control Chart—Manufacturing Cycle Times (Weekly Data)
Control Chart: Destin Company
10
12
14
16
18
20
22
24
26
Week #
1
2
3
4
5
6
7
8
9
10
11
12
Week #
Manufacturing Cycle Time
(Weekly Average)
Average
2. The target cycle time is 14.0 minutes; the lower control limit is 12.0 minutes and
the upper control limit is 16.0 minutes. As indicated in the accompanying Excel file,
the mean of the 12 weekly observations is 15.2, while the sample standard
deviation is 3.6 minutes (which seems high).
Note: An Excel spreadsheet solution file for this exercise is embedded in this
document. You can open the spreadsheet “object” that follows by doing the
following:
1. Right click anywhere in the worksheet area below.
2. Select “worksheet object” and then select “Open.”
3. To return to the Word document, select “File” and then “Close and return to…”
while you are in the spreadsheet mode. The screen should then return you to
the Word document.
Ex. 17-41.xlsx
Chapter 17 – The Management and Control of Quality
17–38
17–41 (Continued)
3. As indicated in part (2), the mean of the sample observations (15.2) is not that far
from the target value (14.0). However, inspection of the control chart suggests
wide variability in the process, which is confirmed by the sample standard deviation
of the 12 observations around the mean value of the dataset. As well, we note that
warranted.
4. Management can determine the upper and lower control limits on their control
charts through experience (e.g., trial and error) or through the use of statistical
procedures. When these control limits are determined statistically (based on
Chapter 17 – The Management and Control of Quality
17–39
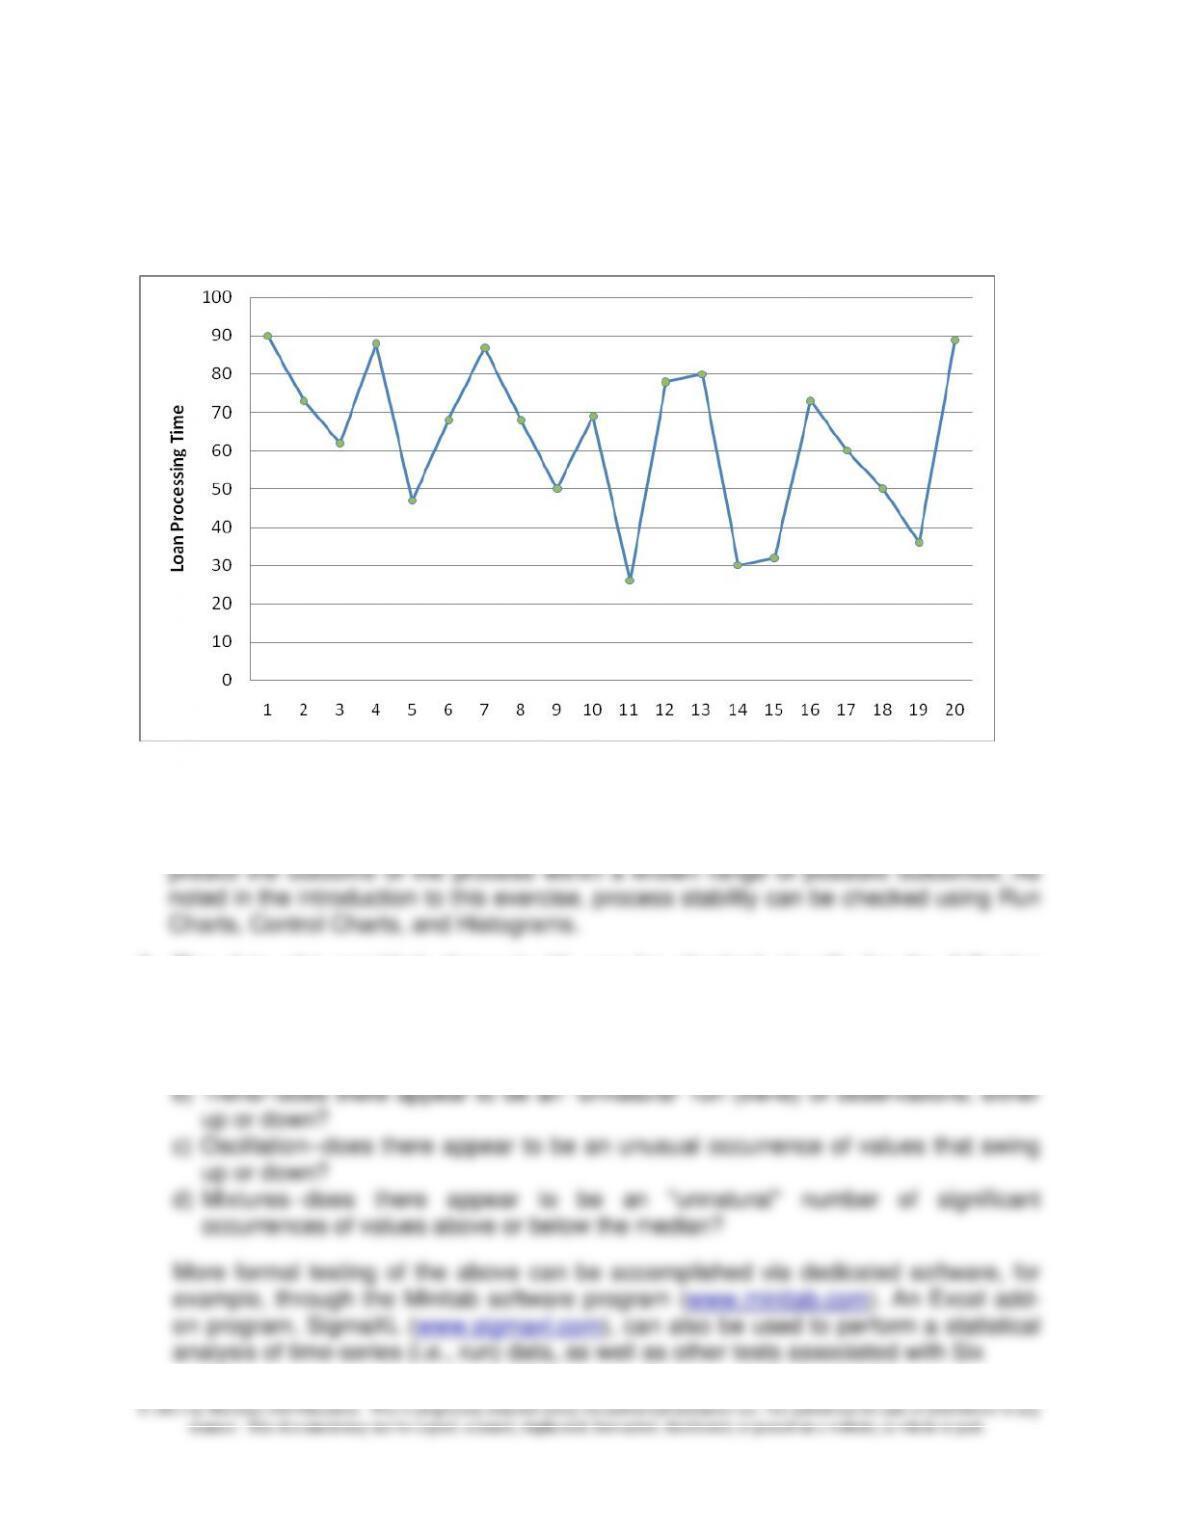
17-42 Using Run Charts to Examine Process Stability; Spreadsheet Application (30-
45 Minutes)
1. Time-series data plot:
Median Processing Time = 68.00; Mean (average) Processing Time = 62.80
2. The term “process stability” generally refers to how a process (in this case, loan
processing activity) performs over time. Having a stable process implies that you can
3. The data plot provided above in (1) can be checked visually for the following
indicators of process stability (or instability):
a) Clustering—is there what appears to be an “unnatural” grouping of values around
a certain observation?

Chapter 17 – The Management and Control of Quality
17–40
Sigma processes.
17–43 Benefits and Challenges of Lean (60minutes)
To: Management of MyOrg
From: I M Student
Re: Lean Accounting
You have asked me to provide information regarding: (1) the definition of “lean,” (2) the
strategic value of adopting lean principles, (3) anticipated costs of moving to lean, (4)
implications for cost-system design, and (5) sources for additional information. Below is
my response to your request.
1. The notion of “lean” can perhaps best be described as a philosophy or strategy of
meeting customer expectations in an increasingly competitive environment. As such,
the term is broad in that it encompasses changes in the way business processes are
executed as well as embracing the notion of continuous improvement coupled with
the elimination of waste and inefficiency. It was probably within this context that the
notion of the “lean enterprise” was coined. In such an organization, we usually find
changes in organizational structure: reduction of managerial layers accompanied by
an increased span of control. In turn, this change is supposed to result in faster and
more flexible decision-making. Finally, we note that some organizations, in
delivering its value proposition on time, error-free, and according to customer
expectations.
Note the distinction with “lean accounting,” which is a term normally used to describe
changes in the internal accounting system (i.e., the comprehensive management
accounting and control system) made to support the implementation of a “lean”
philosophy.
2. Strategically, the adoption of a lean philosophy can enable an organization to more
effectively deliver its stated value proposition to its targeted customer group. The
term “value proposition” is generally construed to mean meeting customer needs in
a unique, sustainable way—one that differentiates you from competitors. Thus, the
adoption of a lean philosophy should be of strategic importance to both cost–
3. Cost associated with the move to “lean” are similar to those associated with any
major philosophical shift for an organization:
Chapter 17 – The Management and Control of Quality
17–41
17–43 (Continued-1)
• Education—employees as well as managers need to be educated regarding the
the goals that accompany the switch to “lean.”
• Incentive System—to align employee actions with expectations and demands of
the “lean enterprise,” employee compensation and incentive plans might have to
be reconfigured.
While not specifically asked for, the instructor at this point might mention the
following anticipated benefits of moving to “lean:”
• Strategic benefits—see (1) and (2) above
• Short-term Cost Savings—associated with efficiency improvements/elimination of
wastes and the performance of non-value-added activities
• Reduction in Inventory-Holding Costs (both out-of-pocket and opportunity costs,
4. Management accounting systems should be constructed to support managerial
initiatives and prerogatives, such as transformation of an organization to a “lean
enterprise.” Broadly speaking, this change affects accounting-system design in at
least the following ways:
• Rather than periodic departmental-based cost reports, cost reporting is done on
a value-stream basis (see example in this chapter as well as Chapter 18 for
Chapter 17 – The Management and Control of Quality
17–42
overhead absorption and the calculation of direct-labor cost variances).
17–43 (Continued-2)
• Internal reporting is vastly decentralized (consistent with the “flattened”
organizational structure that may accompany a switch to “lean”), with information
prepared on a real-time basis; in this environment, the focus of the accounting
reports is on the efficacy of business processes that constitute each specified
value stream.
• As stated on p. 14 of the Statement of Management Accounting (IMA, 2006),
Value-Stream accounting includes relevant non-financial metrics, such as:
▪ productivity of the value stream as a whole (e.g., sales per person)
▪ performance to customer demand
▪ involvement activities of team members
▪ safety
5. Sources of additional information regarding “lean” and “accounting for lean:”
a. B. Maskell and B. Baggaley, Practical Lean Accounting: A Proven System for
Measuring and Managing the Lean Enterprise. New York: Productivity Press,
2004.
b. N. J. Sayer and B. Williams, Lean for Dummies. Hoboken, NJ: Wiley Publishing,
Inc., 2007.
c. Breakthrough Management Group, The Complete Idiot’s Guide to Lean Six
Sigma. New York: Penguin Group (USA), Inc., 2007.
d. R. J. Schonberger, Best Practices in Lean Six Sigma Process Improvement: A
Deeper Look, Hoboken, NJ: John Wiley & Sons, Inc., 2008.
e. A. van der Merwe and J. Thompson, “The Lowdown on Lean Accounting: Should
Management Accountants Get on the Bandwagon—or not?” Strategic Finance
(February 2007), pp. 26-33.
f. J. P. Brosnahan, “Unleash the Power of Lean Accounting,” Journal of
Accountancy (July 2008), pp. 60-66.
g. R. J. Schonberger, “Lean Performance Management (Metrics Don’t Add Up), Cost
Management (January/February, 2008). (Copyright Thompson/RIA, 2008.)
h. B. H. Maskell and F. A. Kennedy, “Why Do We Need Lean Accounting and How

Chapter 17 – The Management and Control of Quality
17–43
Does It Work?” The Journal of Corporate Accounting & Finance (March/April,
2007). (Copyright Wiley Periodicals, Inc., 2007.)
17–43 (Continued-3)
i. R. Cooper and B. Maskell, “How to Manage Through Worse-Before-Better,” MIT
Sloan Management Review (Summer 2008), pp. 58-65.
j. Websites:
http://www.leanaccountingnews.com
http://www.leanaccountingsummit.com
http://www.maskell.com/lean_accounting.html
http://www.imanet.org/resources_and_publications.aspx
Chapter 17 – The Management and Control of Quality
17–44
17–44 Implementation of Lean Accounting (20–30 Minutes)
This question is intended for class discussion. Here are some examples of points that
could be included in the discussion. The overview is that while many of the
implementation steps have been taken, the process of implementing a new system,
lean accounting, is likely to be a continuing challenge, as problems arise, new
employees are added, and changes in the competitive environment require the VSM to
be adapted.
1. As described in the problem, Watlow has implemented the first four of the
principles of lean: Customer value, Value Streams, Pull and Flow (inventory
reduction), and Empowerment (coordination and communication for employees).
2. Though not included in the description of Watlow’s implementation of lean, it is
likely that significant training was needed to prepare Watlow’s employees for the
new system, lean accounting. The challenge facing Watlow is to continue this
3. It will likely be a challenge for Watlow to sustain the energy and goodwill that was
generated in the employees as they felt included and valued in the
4. Will the implementation, by producing operating efficiencies, require the
reduction in facilities or the lay-off of certain personnel, or can this excess
capacity be utilized in new ways? What would be the impact on morale if
employees are laid off?
Source: Jan P. Bosnahan, “Unleash the Power of Lean Accounting,” Journal of
Accountancy, July 2008, pp. 60-66.

Chapter 17 – The Management and Control of Quality
17–45
17–45 Toyota—Keeping It Lean (15 Minutes)
Toyota, as a lean manufacturer, has employee empowerment as a key success factor.
Employee empowerment, the communication and coordination of employees, is a
principle of both lean manufacturing and of the Toyota Production System. It is
particularly important for Toyota, because of the strength of the culture of continuous
improvement at the company which has been one of hallmarks of its success.
Toyota’s continued success depends on its effectiveness in integrating new employees
quickly into the culture of continuous improvement, so that productivity and quality
continue to improve. Both quality and productivity are a concern for Toyota in recent
years. Quality defects are at a higher rate than in prior years and Toyota’s productivity,
while still the standard for the auto industry, has lagged the improvements made by its
competitors, as indicated by the following excerpt from the article:
One measure of productivity, the number of hours per vehicle assembly, in
2004 was 27.9 hours for Toyota, 37 for Ford, and 35.9 for Chrysler LLC; and
while Ford, GM, and Chrysler improved productivity prior to 2004, Toyota’s
productivity increased at a faster rate. In contrast, the productivity gap has
decreased since 2004, as recent productivity reports show that in 2007
Toyota required 29.9 hours per vehicle (a small increase over 2004) while
the respective productivity numbers at Ford and Chrysler are 35 and 32.3
hours per vehicle, an improvement over 2004.
Source: David Welchand and Ian Rowley, “Toyota’s All-Out Drive to Stay Toyota,”
Business Week (December 2007), pp. 54-56.