Chapter 17 – The Management and Control of Quality
17–16
17–28 (Continued-2)
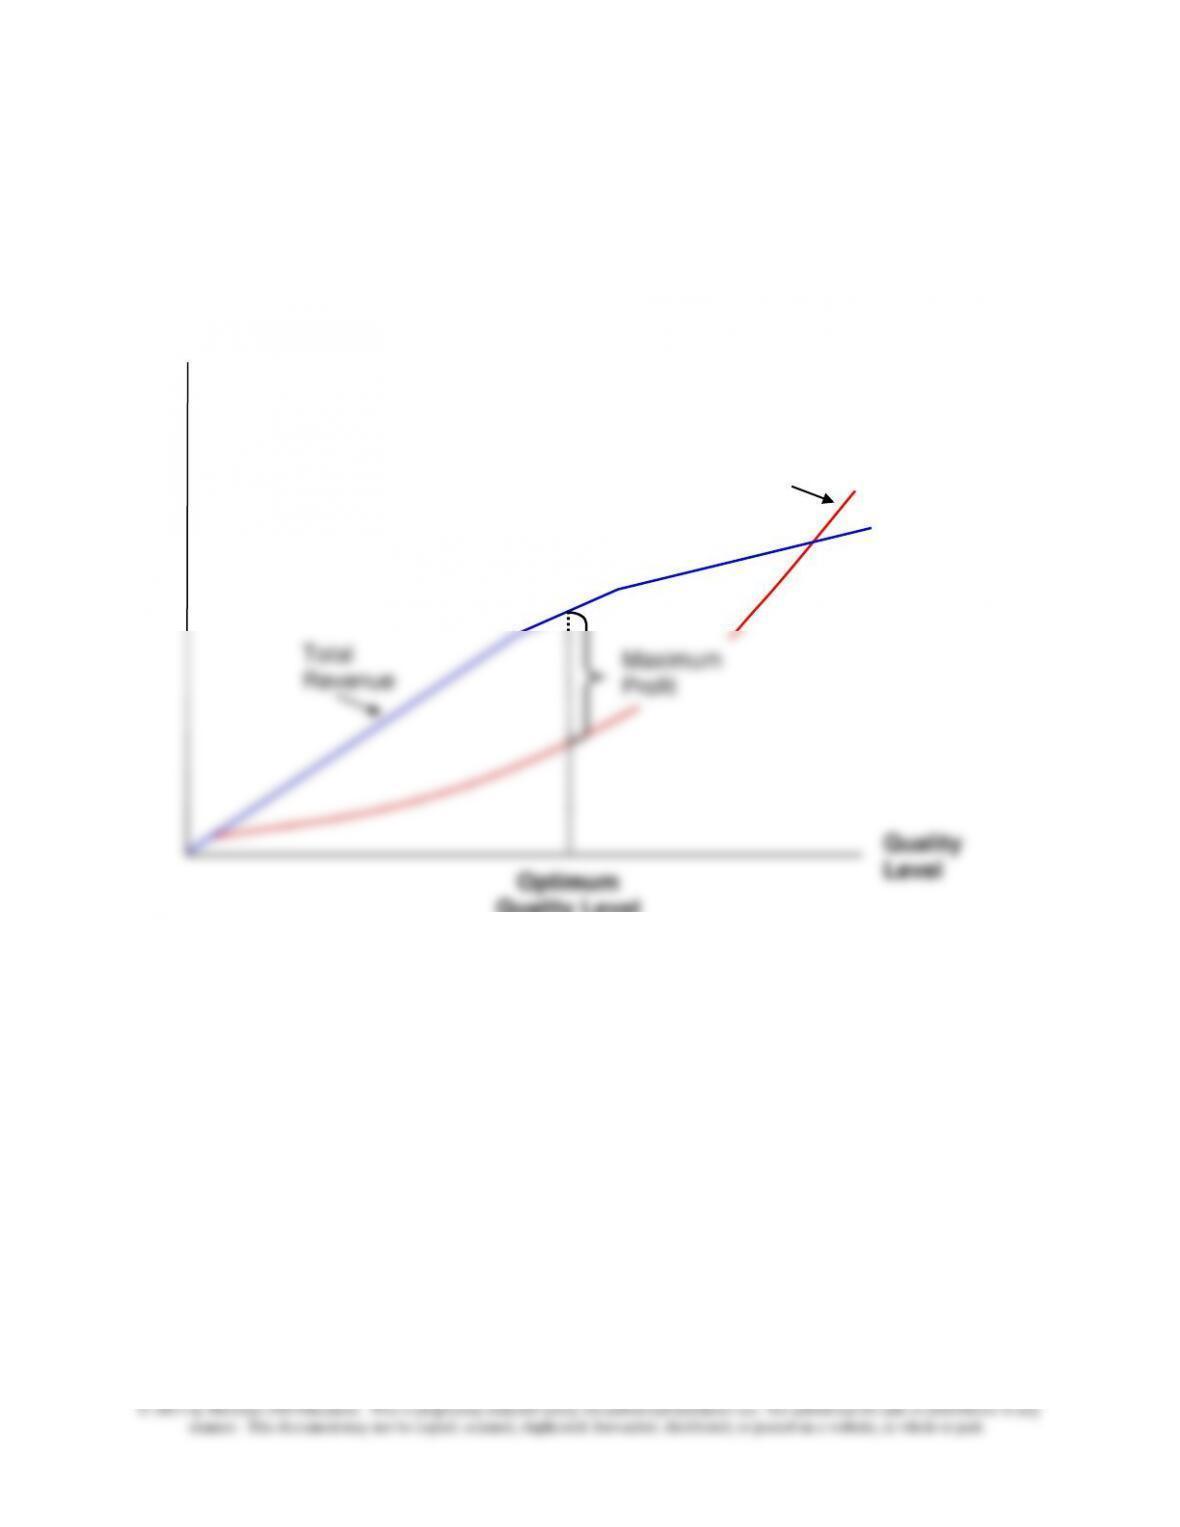
Diminishing Returns Conceptualization: Trading Off Costs and
Benefits for Spending on Quality
Basically, the above representation assumes that after a point, increases in quality spending
do not generate commensurate financial benefits (marginal revenues). The “quality
is free” argument would hold that marginal revenues always exceed marginal costs.
The “diminishing–returns” representation, however, assumes that, as is the case
with other economic activities, at some point the marginal cost of increasing quality
will exceed the marginal revenues from doing so.
Quality
Level
Revenues
& Costs
Optimum
Quality Level
Total
Costs
Total
Revenue
Maximum
Profit
Chapter 17 – The Management and Control of Quality
17–17
17–29 COQ Histograms (45 minutes)
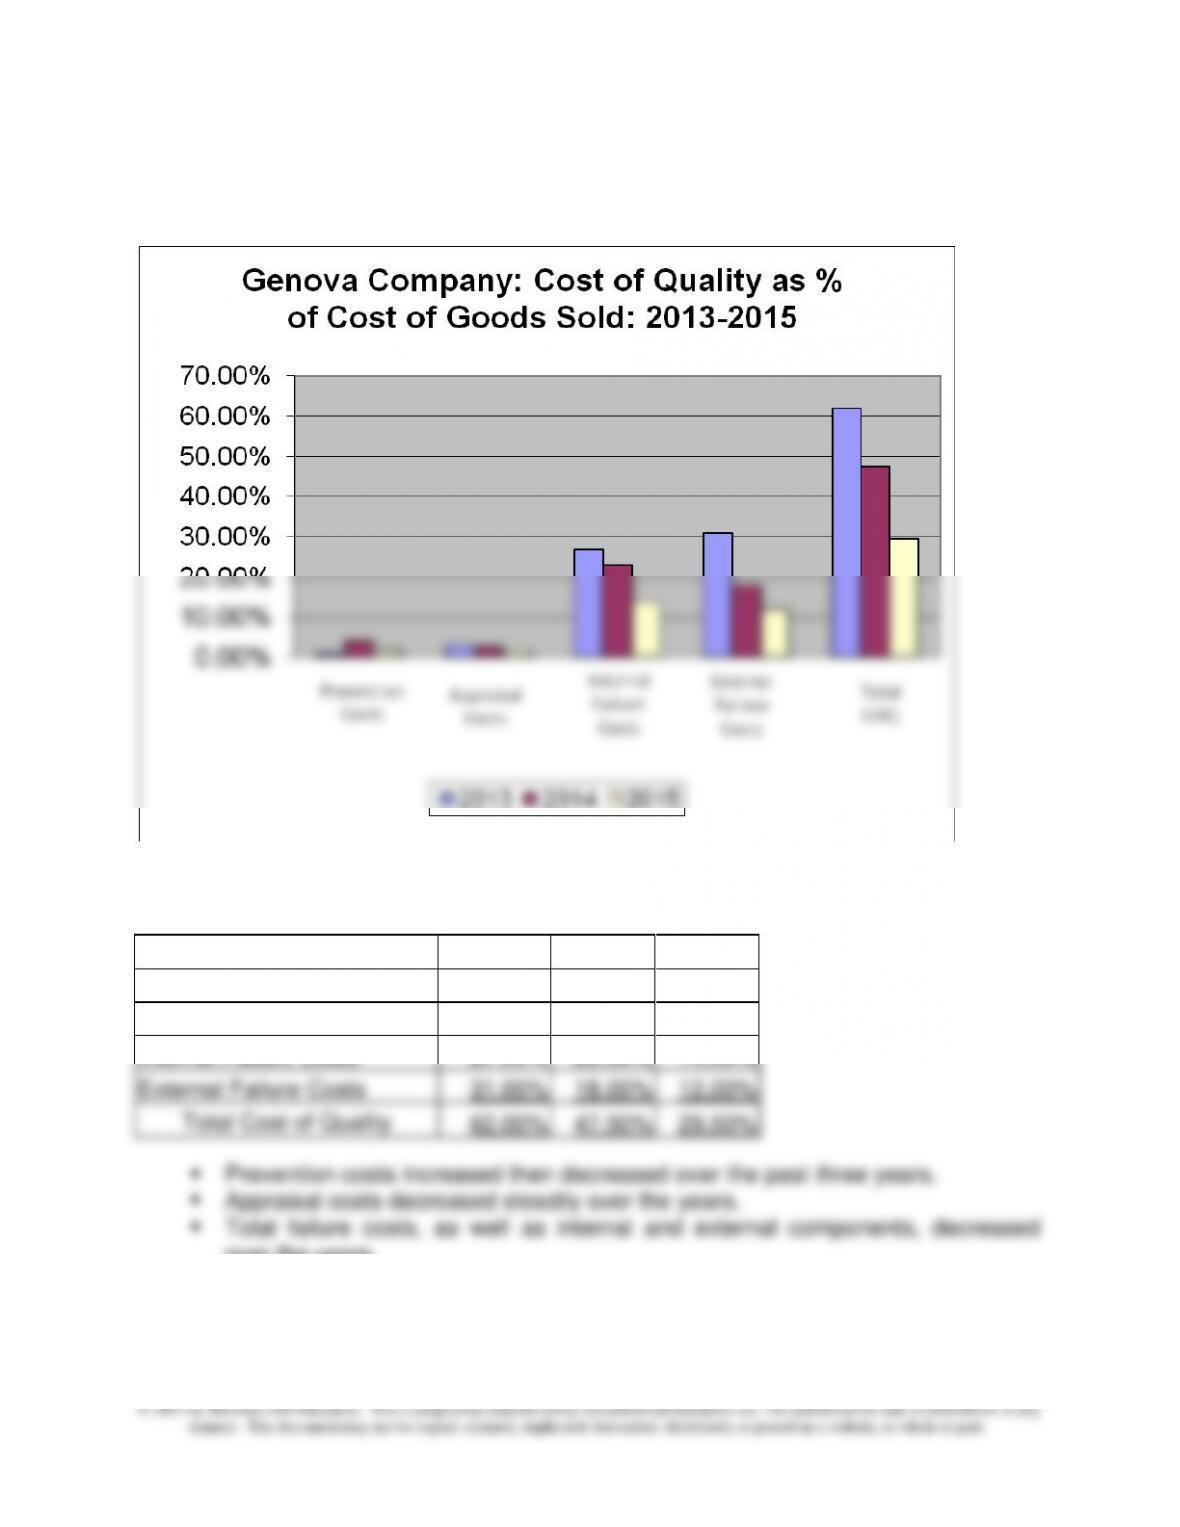
1. COQ Histogram
2. Cost of Quality (COQ) as Percentage of Costs of Goods Sold (CGS):
2013
2014
2015
Prevention Costs
1.00%
4.00%
2.00%
Appraisal Costs
3.00%
2.50%
1.50%
Internal Failure Costs
27.00%
23.00%
14.00%
External Failure Costs
31.00%
18.00%
12.00%
Total Cost of Quality
62.00%
47.50%
29.50%
over the years.
▪ Total COQ as a percentage of CGS decreased from 62.0 percent to 29.5
percent.
Chapter 17 – The Management and Control of Quality
17–18
17–29 (continued)
3. The company can probably expect its total cost of quality to continue declining
provided it maintains adequate level of quality training and other efforts to prevent
poor quality from occurring and to continue emphasis on the importance of quality.
The company was able to see the results within one year of increased efforts in
prevention. The company increased its spending on prevention costs fourfold from
in 2016.
Chapter 17 – The Management and Control of Quality
17–19
17–30 Quality Cost Classification (5-10 minutes)
1. Internal failure cost
2. Internal failure cost
7. External failure cost
Chapter 17 – The Management and Control of Quality
17–20
17–31 Cost-of-Quality (COQ) Reporting for Environmental Performance (20–30
Minutes)
The purpose of this exercise is to get students to think strategically as to how COQ
reporting might be used as part of a comprehensive approach to the management
and control of environmental costs.
1. As global natural resources become more scarce, and therefore subject to
increasing demand, society may demand greater accountability as to the
environmental performance of businesses. One recognition of this is the ISO
14000 family of standards that relate to the processes organizations have in
place to ensure environmental quality. Other firms simply feel that, as with the
case of business ethics, good environmental performance can lead to
sustainable competitive advantage.
2. There is no set answer to this part of the assignment, but student samples might
include some of the following elements:
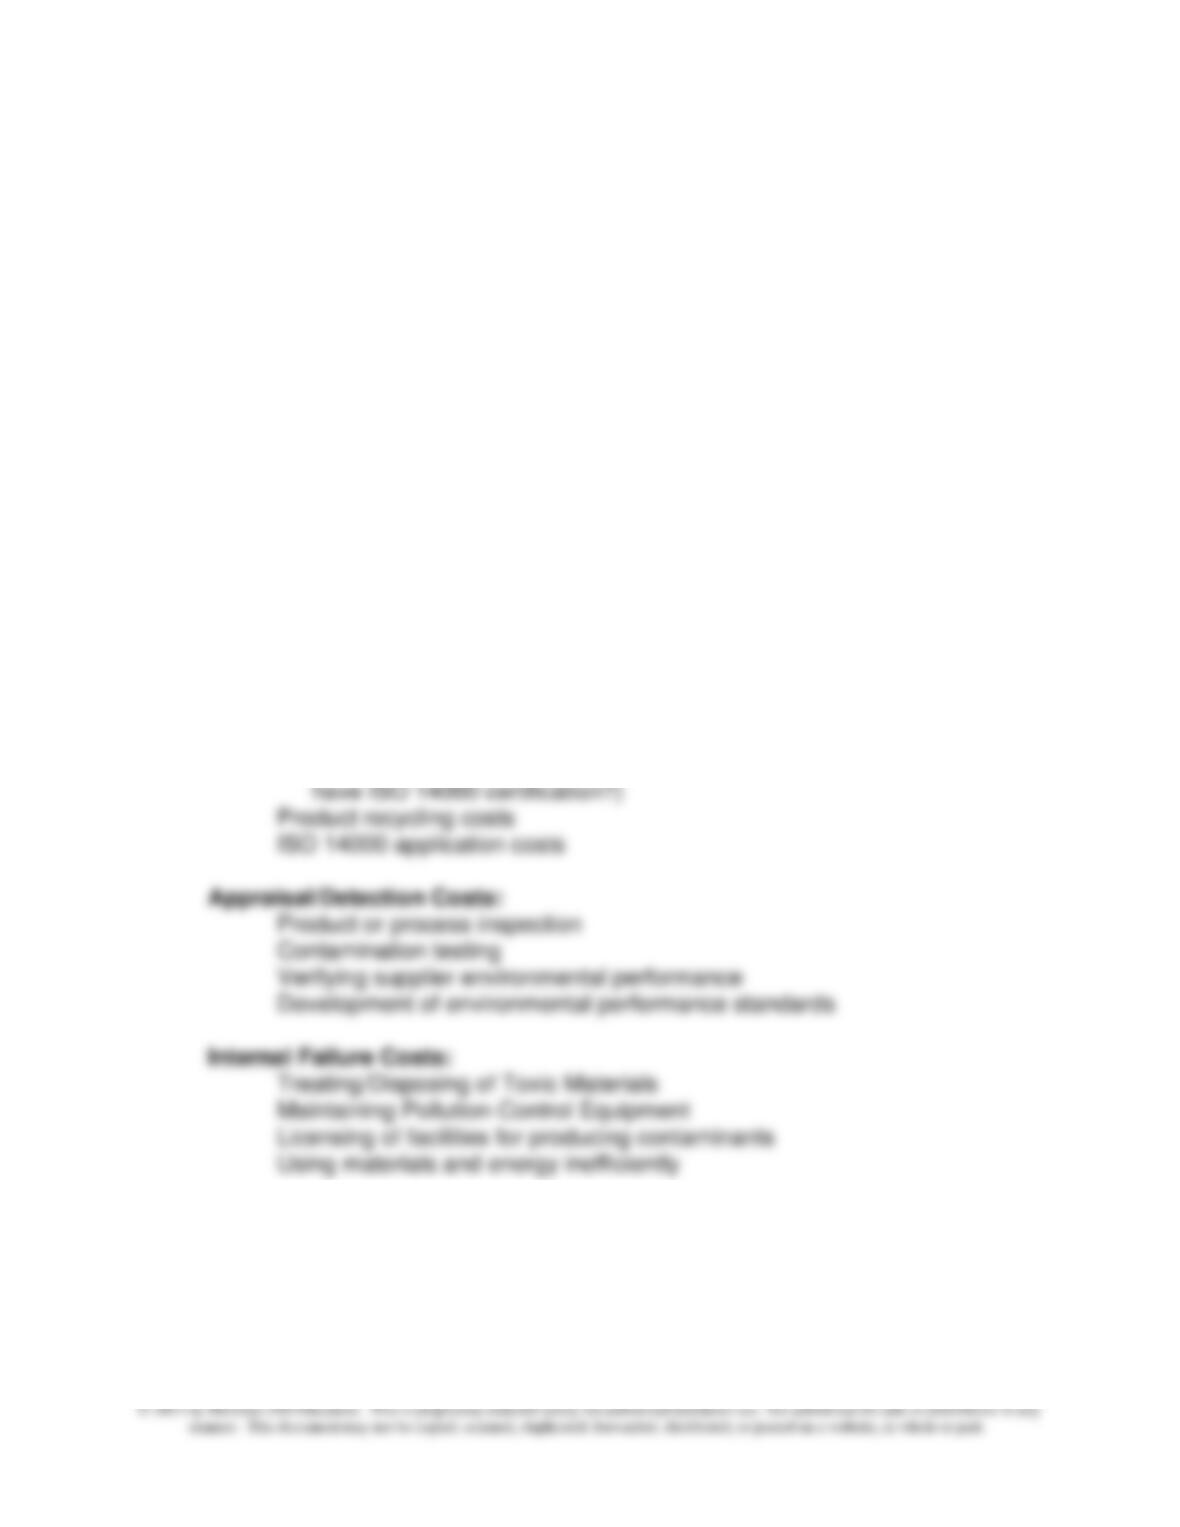
Prevention Costs:
Process design/redesign (to produce environmentally friendly outputs)
Product design/redesign (to consume fewer natural resources, emit fewer
by-products and pollutants, etc.)
Supplier evaluation/certification costs (for example, do preferred suppliers
External Failure Costs:
Government-imposed fines
Restoring land to natural state
Cleaning up contaminated soil
Cleaning up a polluted lake
Loss of reputation
Chapter 17 – The Management and Control of Quality
17–21
17–31 (Continued)
3. There are likely opposing points of view. Companies that are included in
portfolios of high performance in the environmental (or social) area are certainly
likely to favor such disclosures. Stockholders (and potential investors) may favor
such disclosures, particularly since the external failure costs that some
companies face can have devastating effects on the ability of an organization to
Chapter 17 – The Management and Control of Quality
17–22
17–32 Cost-of-Quality (COQ) Report: Environmental Management (30 Minutes)
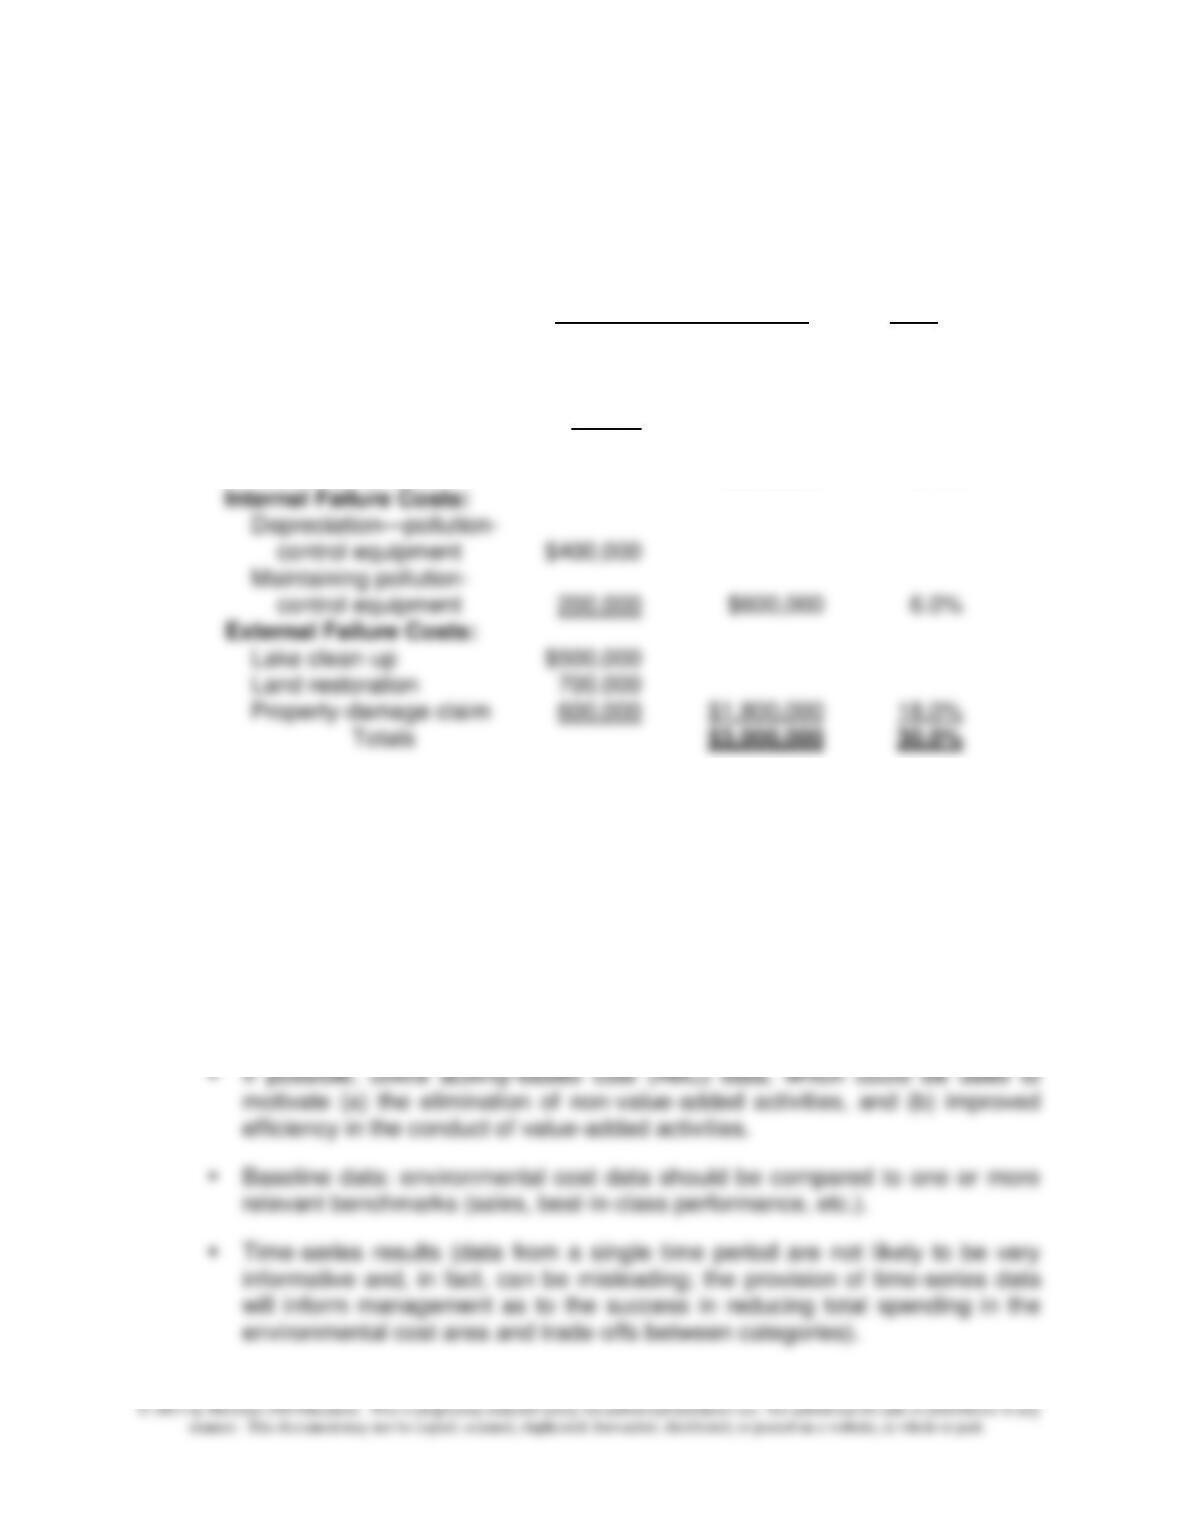
1. Sample Cost of Environmental Quality Report:
% of Total
Operating
Amounts Subtotals Cost
Prevention Costs:
Employee training $100,000
Product design 140,000
Supplier certification 40,000 $280,000 2.8%
Appraisal Costs:
Process inspection $320,000 3.2%
2. With only a single year of data, it is difficult to draw any meaningful conclusions.
However, a tentative conclusion is that the company may be spending far too
little in the conformance quality area (i.e., Prevention and Appraisal Costs) and,
as a consequence, is incurring significant failure costs in the environmental area.
3. Some qualities (attributes) of an effective (“good”) environmental quality cost
system:
▪ Collect environmental quality-cost data from across the value chain (i.e., the
scope of data collection should be broad).
Chapter 17 – The Management and Control of Quality
17–23
17–33 Cost-of-Quality (COQ) Improvement—Relevant Cost Analysis (30 Minutes)
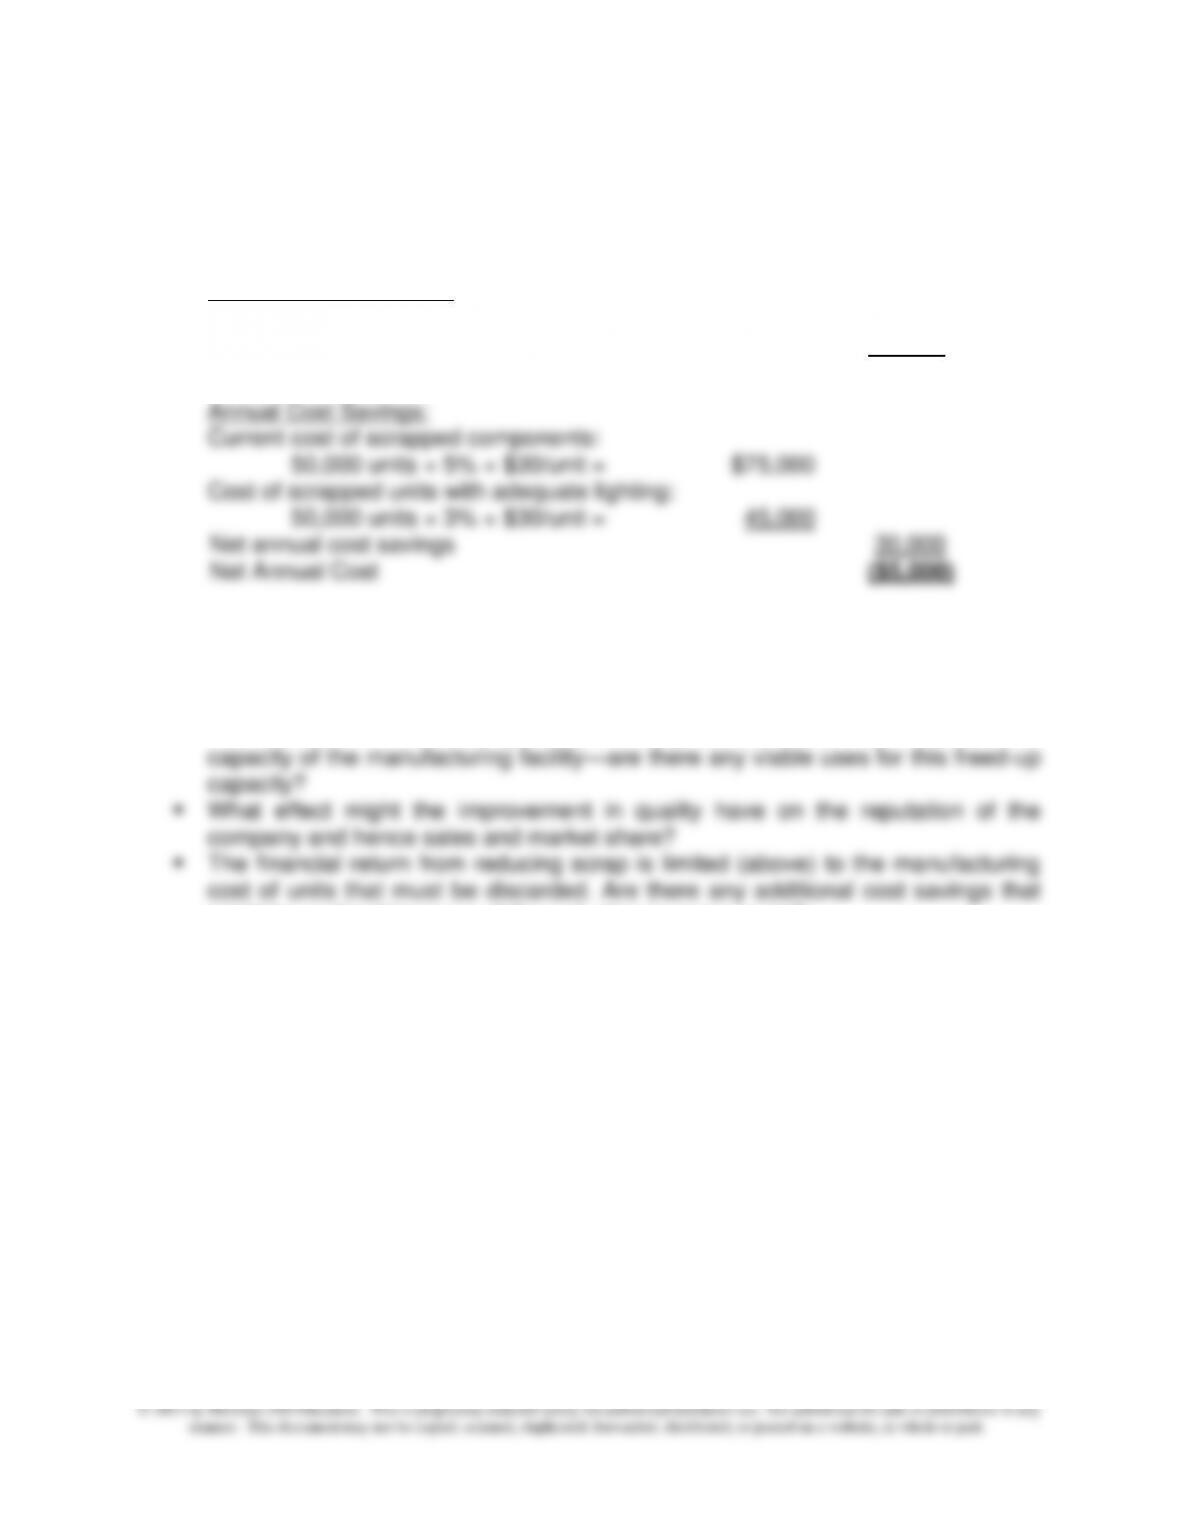
1. Relevant cost analysis (short-term impact on annual operating profit):
Annual Cost of Lighting:
Cost of a new lighting system: $100,000 5 years = $20,000
Additional operating cost per year 5,000
Incremental cost per year $25,000
2. Some additional factors that might bear on this decision:
▪ Time-value-of money (this type of problem is an example of a capital budgeting
decision; as such, the time-value-of-money should be taken into consideration).
▪ The reduction in waste/scrapped products produced effectively increases the
might be realized because of the reduction in scrap costs?
3. As indicated in Exhibit 17.3 and the accompanying text discussion, the
management accountant plays a pervasive role in a comprehensive quality
management and control system. Fundamentally, the management accountant is
involved in generating relevant financial and nonfinancial quality-related data. Such
data are used by managers for decision-making purposes (as in this exercise) and
for controlling quality-related costs.
Chapter 17 – The Management and Control of Quality
17–24
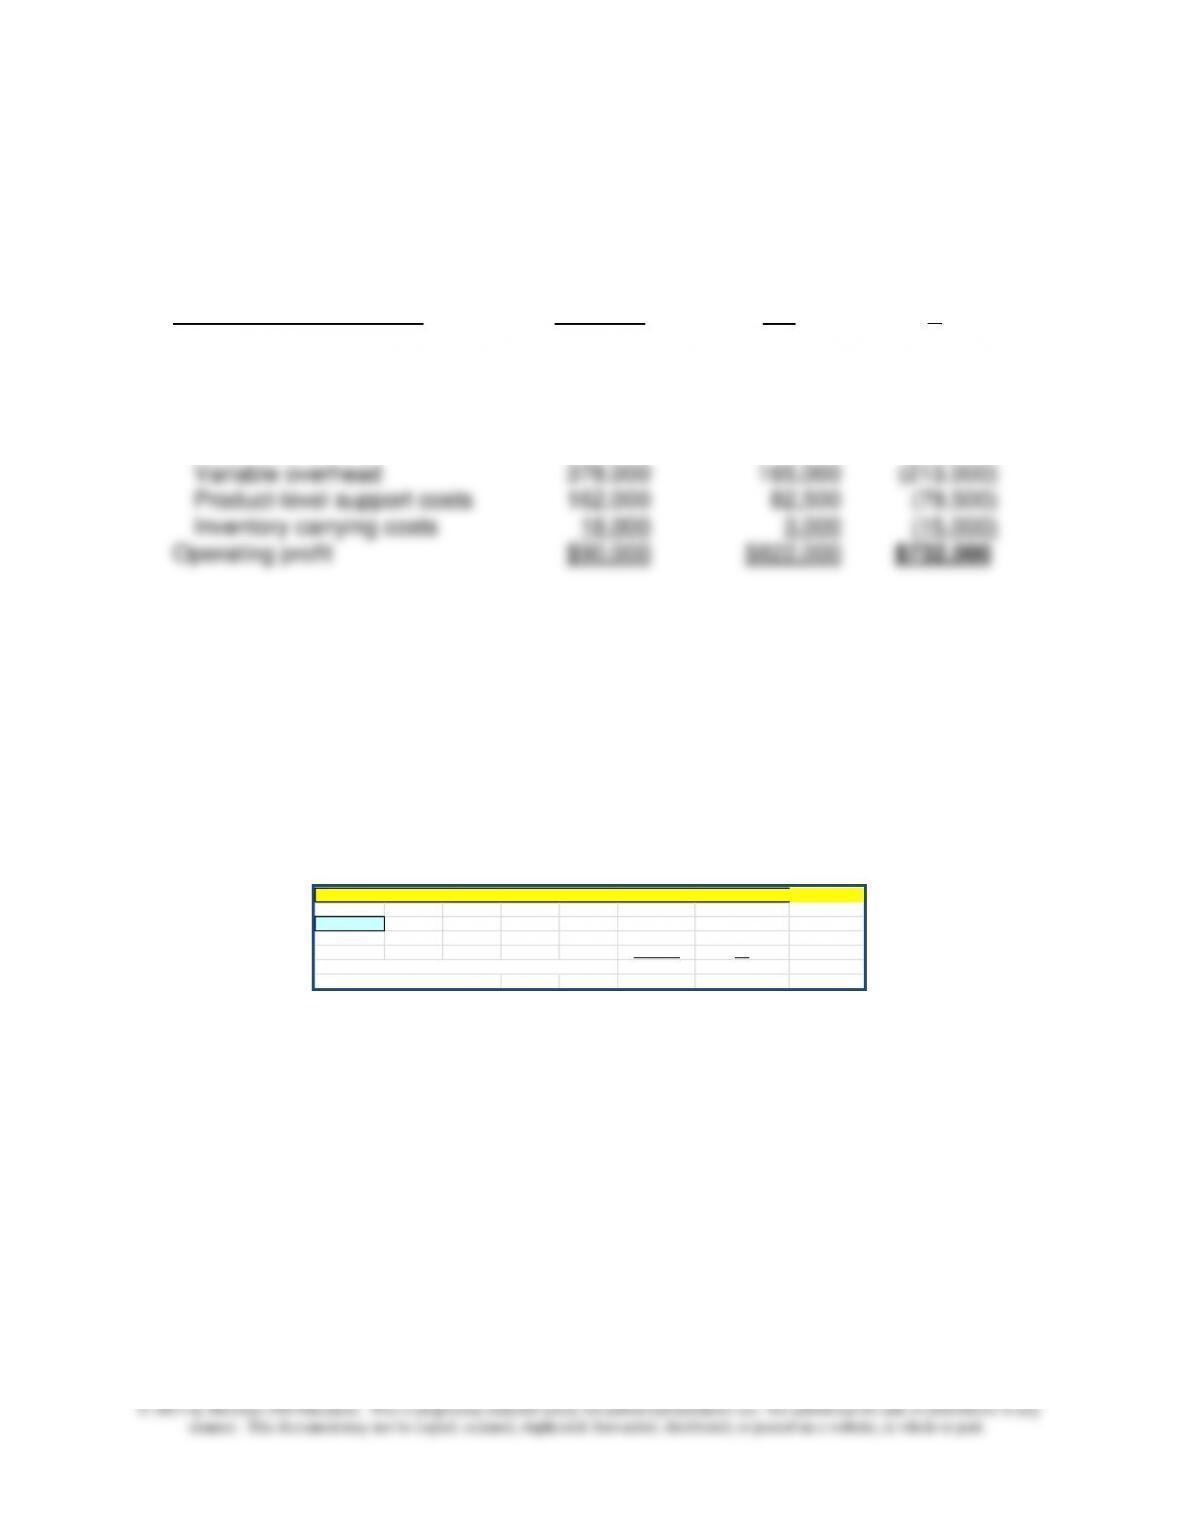
17-34 Relevant Cost Analysis—Conversion to JIT; Spreadsheet Application (20-30
Minutes)
Current After
Income Statement Items Situation JIT
Sales $1,350,000 $1,650,000 $300,000
Less: Costs
Direct materials 405,000 330,000 (75,000)
Direct labor 297,000 247,500 (49,500)
Note to Instructor: An Excel spreadsheet solution file for this exercise is embedded
in this document. You can open the spreadsheet “object” that follows by doing the
following:
1. Right click anywhere in the worksheet area below.
2. Select “worksheet object” and then select “Open.”
3. To return to the Word document, select “File” and then “Close and return
to…” while you are in the spreadsheet mode. The screen should then return
you to the Word document.
17-34: Relevant Cost Analysis–Conversion to JIT Manufacturing; Spreadsheet Application
Data Input
Current After
Item Situation JIT
Manufacturing Costs as a Percentage of Sales:
Product-level support costs 12.00% 5.00%
Chapter 17 – The Management and Control of Quality
17–25
17–35 Quality Ratings—Graduate Business Programs (30-45 Minutes)
As indicated in the exercise, the various ranking sources to some extent use
different quality-related criteria. We provide an example response below, that is, an
overview of the ranking criteria used by U.S. News & World Report (March 15, 2011)
in their 2012 ranking of full-time MBA programs. This is followed by a discussion of
the criteria used by BusinessWeek to rank Executive and Part-Time MBA programs.
The intent of this question is not to develop a definitive listing of quality criteria.
Rather, our intent is to provide a nonmanufacturing example of quality rankings that
would likely be of interest to many business students.
To gather its rankings data (see http://www.usnewsuniversitydirectory.com/graduate-
schools/methodology-bgs.aspx, accessed 25 November 2011), U.S. News & World
Report asked business school deans, program directors, and senior business-school
faculty to judge the academic quality of programs in their field on a scale of 1
(“marginal”) to 5 (“outstanding”). Also surveyed were professionals who hire new
graduates. School rankings are based on a two-year average of ratings of individual
schools. The statistical indicators used in the ranking of graduate business programs
fall into two categories:
All 437 master’s programs in business accredited by AACSB International were
surveyed in the fall of 2010 and early 2011 (398 responded, of which 142 provided
the data needed to calculate rankings based on a weighted average of the indicators
described below).As indicated below, U.S. News & World Report bases 40% of its
judgment on opinions of business school deans, program directors, and corporate
recruiters (see http://www.usnewsuniversitydirectory.com/graduate-schools/
methodology-bgs-business.aspx). Placement success accounts for 35% of the
ranking, while the remaining 25% is based on “student selectivity.”
Quality Assessment (weight = 0.40):
• Peer-Assessment Score (0.25). In Fall 2010, business school deans and
directors of accredited master’s programs in business were asked to rate
programs on a scale from “marginal” (1) to “outstanding” (5). Those individuals
who did not know enough about a school to evaluate it fairly were asked to
mark “don’t know.” A school’s score is the average of all the respondents who
rated it. Responses of “don’t know” counted neither for nor against a school.
About 46 percent of those surveyed responded.
Chapter 17 – The Management and Control of Quality
17–26
• Recruiter-Assessment Score (0.15). In Fall 2010, corporate recruiters and
company contacts from M.B.A. programs previously ranked by U.S. News
17–35 (Continued-1)
were asked to rate all full-time programs on a scale from “marginal” (1) to
“outstanding” (5). Those individuals who did not know enough about a school to
evaluate it fairly were asked to mark “don’t know.” A school’s score is the
average of all the respondents who rated it. Responses of “don’t know” counted
neither for nor against a school. About 21 percent of those surveyed
responded. For the purpose of calculating the current year’s rankings, the two
most recent years’ survey results were averaged and are weighted by 0.15.
Placement Success (weight = 0.35)
• Mean Starting Salary and Bonus (0.14)—the average starting salary and
bonus of 2010 graduates of a full-time master’s program in business. Salary
figures are based on the number of graduates who reported data. The mean
information is not used in calculating the rankings. Employment rates at
graduation (0.07) and three months after graduation (0.14) are used in the
ranking model.
Student Selectivity (weight = 0.25):
• Mean GMAT Scores (0.1625)—the average Graduate Management
Admission Test (GMAT) score of students entering the full-time program in Fall
2010. Scores on the GMAT range from 200 to 800.
• Mean Undergraduate GPA (0.0750)—the average undergraduate grade-point
average of those students entering the full-time program in Fall 2010.
• Acceptance Rate (0.0125)—the percent of applicants to the full-time program
in Fall 2010 who were accepted.
Overall Rank: Data were standardized about their means, and standardized scores
were weighted, totaled, and rescaled so that the top school received 100; others
received their percentage of the top score. In order to be ranked, a full-time M.B.A.
program had to have 20 or more graduates who were seeking employment in 2010. For
Chapter 17 – The Management and Control of Quality
17–27
a school to have its employment data considered in the ranking model, at least 50
percent of its 2010 full-time M.B.A. graduates needed to be seeking work.
17–35 (Continued-2)
Specialty Rankings: Executive M.B.A. and Part-time M.B.A. program rankings by U.S.
News and World Report are based solely on ratings by business school deans and
directors of accredited master’s programs from the list of schools surveyed. They were
asked to nominate up to 10programs for excellence in each of the areas listed.
Ranking of Part-Time and Executive MBA Programs
(Bloomberg Businessweek)
As part of the 2011 Best Part-Time and Best EMBA rankings, Bloomberg Businessweek
surveyed 10,000-plus recent graduates at more than 100 business schools—from both
types of programs.
Part-time MBA programs are ranked on the basis of eight criteria, as follows:
average class size; and, three factors assessed via student survey results: teaching
quality; caliber of classmates; and, curriculum.
Executive MBA (EMBA) programs are ranked on the basis of the following criteria:
average student work experience (in years); percentage of students who are “top
executives” (i.e., chairman, president, or CEO); and, three factors assessed via
student survey responses: teaching quality; curriculum; and, level of program
support.
Source: Geoff Gloeckler, “The Best Business Schools of 2011,” Bloomberg
Businessweek (November 14 – November 20, 2011), pp. 59-64. Also see,
http://www.businessweek.com/bschools/rankings/and
http://www.businessweek.com/business-schools/how-we-rank-the-schools–
11102011.html (accessed 25 November 2011).
Wall Street Journal (WSJ) Rankings
Rankings of EMBA programs, by the WSJ, are available at:
http://online.wsj.com/article/SB10001424052748704206804575467440809287142.html
?mod=WSJ_WSJ_Careers_EXECUTIVEMBARANKINGS5_6 (accessed 25 November
2011).
Chapter 17 – The Management and Control of Quality
17–28
17–36 Spotting Quality in Business Programs (30 Minutes)
The purpose of this exercise is to provide an example of nonfinancial quality
measures in a context likely to be of interest to most students, not to provide a
definitive list. The instructor might point out that, depending on the mission of the
institution and its competitive strategy, items listed below could be of greater or
lesser importance (i.e., could be assigned different weights in evaluating the overall
quality of a business school).
Bulletin Boards: Take a look at what is posted on the bulletin boards of the
business school. Will you find a cluttering of cheap magazine offers and offers for
temporary employment, or do you observe notices of distinguished visiting speakers,
degree program? Is there a comprehensive, program-level assessment plan to
provide assurances of learning?
Resources Devoted to Education: Does the program have adequate resources
(human and financial) to accomplish its specified mission? Is the institution
financially stable? Is there adequate spending on technology?
Student-Faculty Interactions: Are the faculty involved in significant out-of–
classroom activities related to the educational process? Is there ample opportunity
internal and external?
Assurances of Learning: Does the institution have in place a process for
determining “value added”? That is, is there a formal process for determining
learning outcomes vis-à-vis stated learning goals?
Chapter 17 – The Management and Control of Quality
17–29
17–36 (Continued)
Diversity: Is there diversity of faculty background? To what extent does a diverse
student body exist?
Placement: What firms and organizations regularly recruit graduates of the business
school?
Alumni: How active are alumni in terms of providing financial support and
actively engaged in the profession?
Source: The preceding listing of quality criteria is drawn from M. R. Blood, “Spotting
Quality,” Decision Line, Vol. 36, No. 4 (July 2005), pp. 14–20.
Chapter 17 – The Management and Control of Quality
17–30
17–37 Nonfinancial (Operational) Control Measures: Environmental Performance (15–
20 Minutes)
The purpose of this exercise is to get students to think about the process of
developing nonfinancial quality indicators, based on specified Environmental
Objectives (five in the present case). The purpose of these indicators is to gauge
progress in accomplishing the specified Environmental Objectives and, as such, to
motivate improved quality in environmental performance. The following answers are
suggestive only:
Minimize Hazardous Materials:
Types and quantities of hazardous materials produced (in total,
and per unit of output)
Productivity measures (e.g., ratio of outputs to virgin/raw materials
consumed)
Minimize Energy Requirements:
Types and quantities of energy consumed
Productivity measures (energy consumption per unit produced, etc.)
Minimize Release of Residues into the Environment:
Pounds of toxic waste produced
Cubic metric tons of effluents
Tons of “greenhouse” gases produced