Unlock document.
This document is partially blurred.
Unlock all pages and 1 million more documents.
Get Access
Chapter 16 - Operational Performance Measurement: Further Analysis of Productivity and Sales
16-1
CHAPTER 16:
OPERATIONAL PERFORMANCE MEASUREMENT: FURTHER
ANALYSIS OF PRODUCTIVITY AND SALES
QUESTIONS
16-1 Productivity is the ratio of output to input. It is a measure of the amount of output
16-2 To be a successful low cost provider in its industry a firm needs to be able to
manufacture the product using fewer resources - materials, labors, or other
16-3 Two of the most often used criteria for assessing productivity and their
advantages and disadvantages are:
1. Prior year’s productivity
Advantages:
Disadvantages:
• Difficult to assess adequacy of productivity improvements
2. Best performance of the industry or practice
Advantages:
• Uses of the best practice in the industry or anywhere as the benchmark. A
Disadvantages:
• The standard might be too high and can be frustrating to workers.
the operation.
16-4 Operational productivity is the conversion ratio of an input resource to the output.
It is a physical measure on the unit of output produced from one unit of a
resource.
Financial productivity measures the relationship between the output and the cost
Chapter 16 - Operational Performance Measurement: Further Analysis of Productivity and Sales
16-2
of one or more of the input resources. It is a measure of the unit of output or the
sales values of output produced per dollar of one or more resources.
16-5 Partial productivity is a productivity measure that focuses only on the relationship
between the amount of one input and the output attained. Both the input
(denominator) and the output (numerator) can be either in unit or in dollar
16-6 Financial productivity contains more information only in the sense that it
facilitates comparisons of different resources.
A financial productivity, however, can be confusing or less useful to
resources.
16-7 To say that a total productivity measure encompasses all partial productivity
measures is a misnomer. A total productivity measure may not examine the
16-8 The primary purpose of calculating productivity is to improve the operation.
Improvements on high-value-added activities decrease costs of the activities
16-9 Manufacturing personnel often prefer operational productivity measures to
financial productivity measures because data for computing operational
16-10 Measurements of productivity help managers to improve operations of both JIT
and non-JIT firms. However, a JIT firm is more likely to have less low-value-
Chapter 16 - Operational Performance Measurement: Further Analysis of Productivity and Sales
16-3
16-11 (b). (a) is false because a higher productivity would be reflected by a higher, not
lower, partial productivity ratio. (c) is false because an operational partial
16-12 Measures for assessing marketing effectiveness include market share, market
size, selling price, sales mix, and sales quantity, and sales volume variances.
16-13 The components of sales variance include selling price and sales volume
variances. A sales volume variance is the total of sales quantity and sales mix
16-14 A selling price variance measures the effects of deviations in actual selling prices
from the budgeted selling prices on operating results, including effects on
16-15 A sales volume variance is the difference between the flexible budget for the
units sold during a period and the budgeted units in the master budget of the
period. For a firm with multiple products the sales volume variance can be the
The sales volume variance = the sales quantity variance plus the sales mix
variance
16-16 This statement is not always true. A multi-product firm can still have an
unfavorable sales volume variance even if it sold more units than the budgeted
16-17 Selling price and sales volume variances are the two major components that
Chapter 16 - Operational Performance Measurement: Further Analysis of Productivity and Sales
16-4
16-18 A market size variance measures the effect of changes in the size of a product’s
total market on a firm’s total contribution margin or operating income. A market
market on its total contribution margin or operating income.
16-19 A firm benefits from a favorable sales quantity variance only if there are no
adverse changes in selling prices or sales mix variances. A favorable sales
quantity variance may not be beneficial to the firm if the firm lowered its selling
prices or sold more of low-priced, low-margin and less of high-priced, high-
margin products.
An increase in the total market size often leads to a favorable sales
quantity variance. Strategically, the favorable sales quantity variance may not be
favorable to the firm if the firm has an unfavorable market share variance.
However, a firm can have a favorable market size variance and an
variance and an unfavorable market share variance when the increase in the
number of units sold is less than the proportional to the increase of the total
market. The sales quantity variance would be unfavorable if a firm sold fewer
units than the budgeted units although the firm experienced a favorable market
share variance when the decrease in the total number of units was less than the
decrease in the total market.
16-20 A sales volume variance can be divided into sales quantity and sales mix
16-21 A firm can increase its earnings through reducing expenses, even if it sold fewer
Chapter 16 - Operational Performance Measurement: Further Analysis of Productivity and Sales
16-5
BRIEF EXERCISES
16-22
a. First, calculate the Sales Mix Ratios:
Budget Actual
Quantity Ratio Quantity Ratio
R66 1,200 .75 1,000 .5
R100 400 .25 1,000 .5
16-23
16-24
a. Total sales volume variance:
R66: (1,000 - 1,200) x $10 = $ 2,000 U
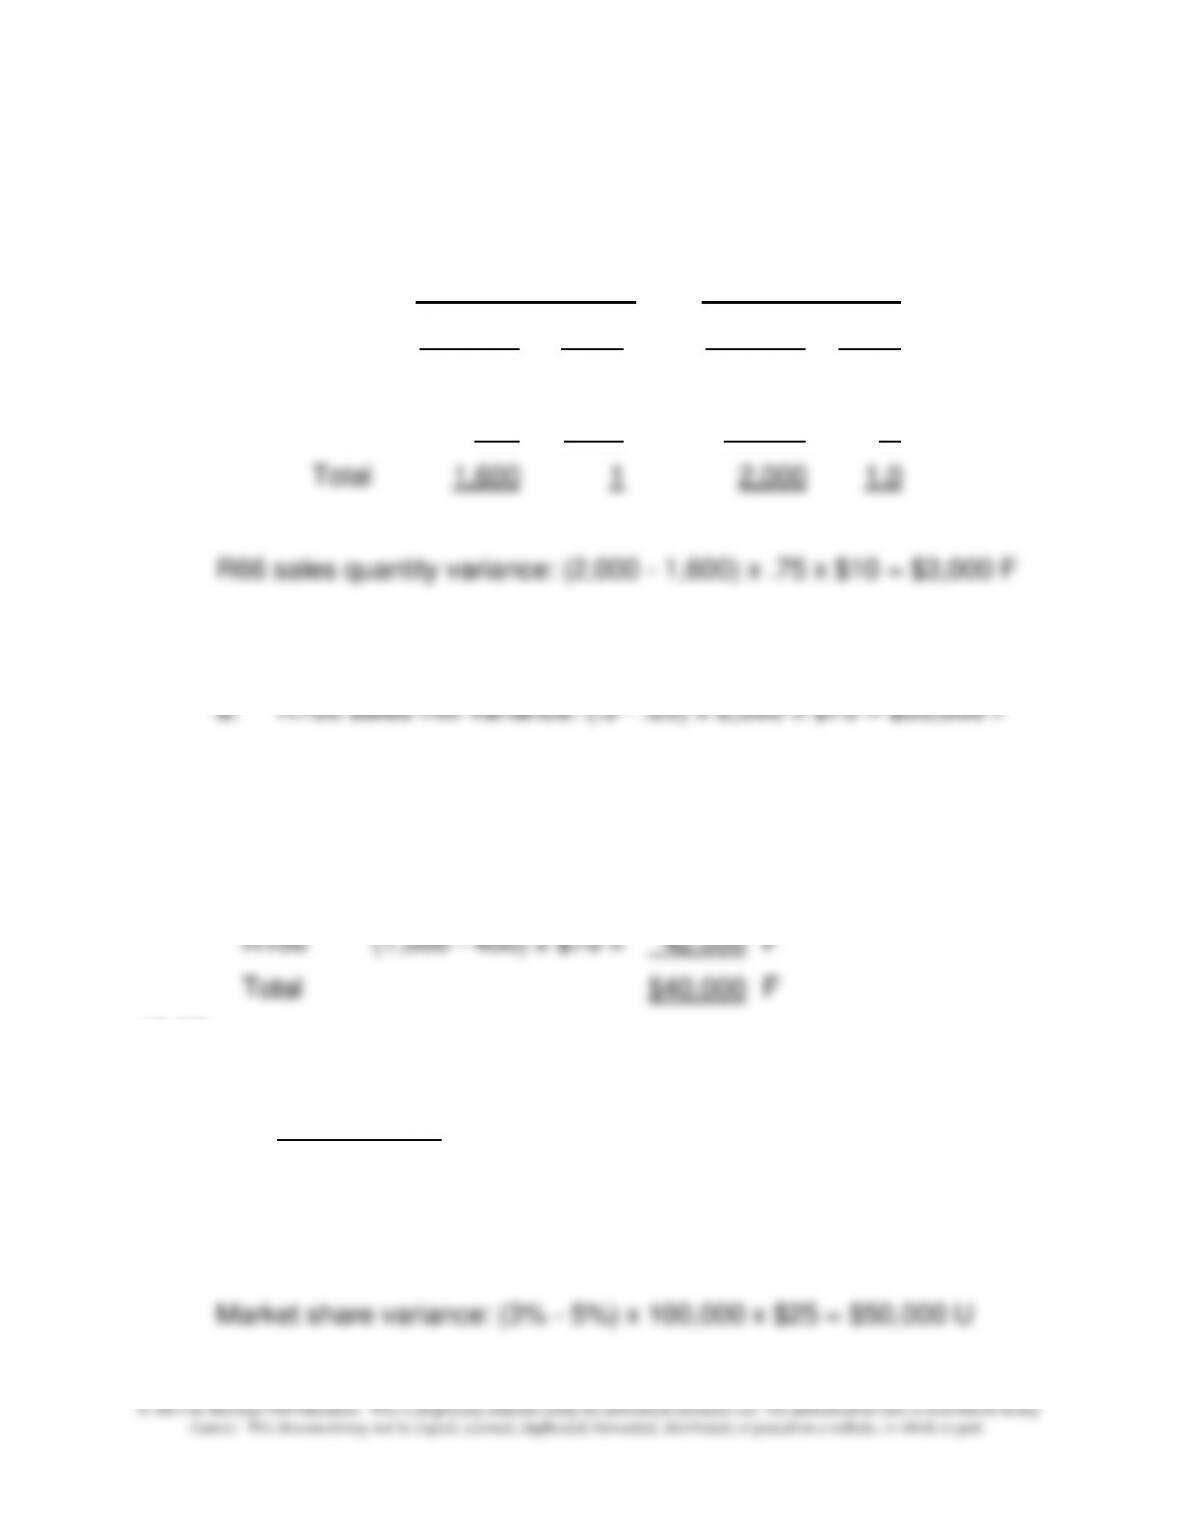
16-25
a.
Market share:
Actual: 3,000 / 100,000 = 3%
Budget: 1,600 / 32,000 = 5%

16-6
16-26
a. Market size variance: (100,000 - 32,000) x 5% x $25 =
16-27
16-28
a.
Operational Partial Productivity = Actual Production/Actual Input

Chapter 16 - Operational Performance Measurement: Further Analysis of Productivity and Sales
16-7
EXERCISES
16-29 Productivity and Strategy; Manufacturing (15 min)
1. The companies mentioned in the exercise (Harley-Davidson,
General Electric, Texas Instruments, and Coca-Cola) have different
competitive strategies: some are differentiators and others are cost
leaders. In each case, the workforce reductions were intended to
improve profits. The important question is how the workforce
reductions will affect the long-term competitiveness of each of the
companies. For example, Harley-Davidson’s management believes
that it is preparing for a long-term decline in sales, and that the
reduction in capacity is needed to match the future demand. This is
an appropriate response for the projected sales decline. Harley can
maintain its differentiated product line, and continue to succeed as a
smaller company. The strategic issue centers on this projection of
lower sales for the indefinite future; if sales do pick up due to
improving economic conditions, then Harley will be at a competitive
disadvantage since it will not be able to meet the rising demand. The
highly-experienced workforce will be hard to replace in a short
amount of time.
The same strategic issues face General Electric (GE) and
Texas Instruments (TI). For both companies, it is critical to project
long-term demand accurately. General Electric, like Harley, has
product lines that require highly-skilled labor, such as the GE unit that
manufactures aircraft engines. In contrast, the highly automated
manufacturing plants at Texas Instruments means that workforce
reductions (a) will not improve profits as quickly since most costs are
tied up in manufacturing facilities and equipment, and (b) will be more
easily replaced since the factory is automated. The case of Coca-
Cola is similar to TI.

Chapter 16 - Operational Performance Measurement: Further Analysis of Productivity and Sales
16-8
16-29 (continued -1)
2. The companies’ main focus is to maintain and improve profits,
through workforce reductions. These reductions are likely to improve
productivity, at least in the short run, as the cuts in labor costs must
be larger than the decline in output in order to improve profits.
Whether or not the productivity gains can be maintained depends on
the companies’ ability to maintain expected levels of output with the
smaller workforce, through improvements in efficiency, manufacturing
methods, and workplace policies and procedures which promote
efficiency.
Source: Kate Lindebaugh, “Lean Companies Ready to Cut,” The Wall
Street Journal, October 24, 2011, p. B1; Scott Thurm and Joe Light,
“Propelling the Profit Comeback,” The Wall Street Journal, October 3,
2010; Nelson D. Schwartz, ”Industries Find Surging Profits in Deeper
Cuts,” The New York Times, July 25, 2010.
Chapter 16 - Operational Performance Measurement: Further Analysis of Productivity and Sales
16-9
16-30 Productivity; Sustainability (15 min)
1. UPS succeeds by having on-time delivery of packages worldwide.
On-time performance is essential for competitive success, while cost
control in the delivery process is key to profitability. To achieve cost
control, UPS uses a variety of techniques including GPS software for
drivers to avoid left turns (because they take longer and use more
fuel than right-hand turns), instructing drivers to carry ignition keys on
attention to any of the vehicle’s parts that are worn or damaged.
Overall, this means a more efficient and reliable fleet of trucks.
2. The telematics system not only allows for fuel savings (25 gallons per
truck per year) but it also makes it possible for UPS to promptly
correct any problems with a truck’s emission controls. On balance,
the system provides an important means for the company to improve
Source: “Squeezing More Green Out of Brown,”
BloombergBusinessweek, September 20, 2010, p. 43.
Chapter 16 - Operational Performance Measurement: Further Analysis of Productivity and Sales
16-10
16-31 Productivity and Quality Improvement in Retail (15 min)
This exercise introduces the contrast between productivity and quality, the
latter a topic covered in the following chapter, chapter 17. See also 16-35.
The question is intended for class discussion, to prompt some thinking
about the nature of productivity, quality, efficiency and similar terms. How
do productivity and quality differ?
The discussion can take many directions, but some key points should be
pointed out:
1. Productivity as described in this chapter is a measure of output to
input, and thus fits very well a manufacturing context. It can also be
applied to service and retail contexts if the output is properly defined.
firms use to reduce waste and improve efficiency. Quality
improvement will likely increase productivity.
In sum, productivity is a measure, and quality improvement
methods such as Six Sigma are the means that improve the
productivity measure.
2. Lean manufacturing, also explained in chapter 17 along with quality
improvement, is another means of reducing waste, improving
as Six Sigma) and lean manufacturing in the context of productivity.
3. Toyota and the Toyota Production System (TPS) described at the
beginning of this chapter are often referred to as leaders in lean
manufacturing and quality improvement. While TPS was developed
Source: “The Six Sigma Black Belts are Back,” Business Week,
September 21, 2009, p. 64-65.
Chapter 16 - Operational Performance Measurement: Further Analysis of Productivity and Sales
16-11
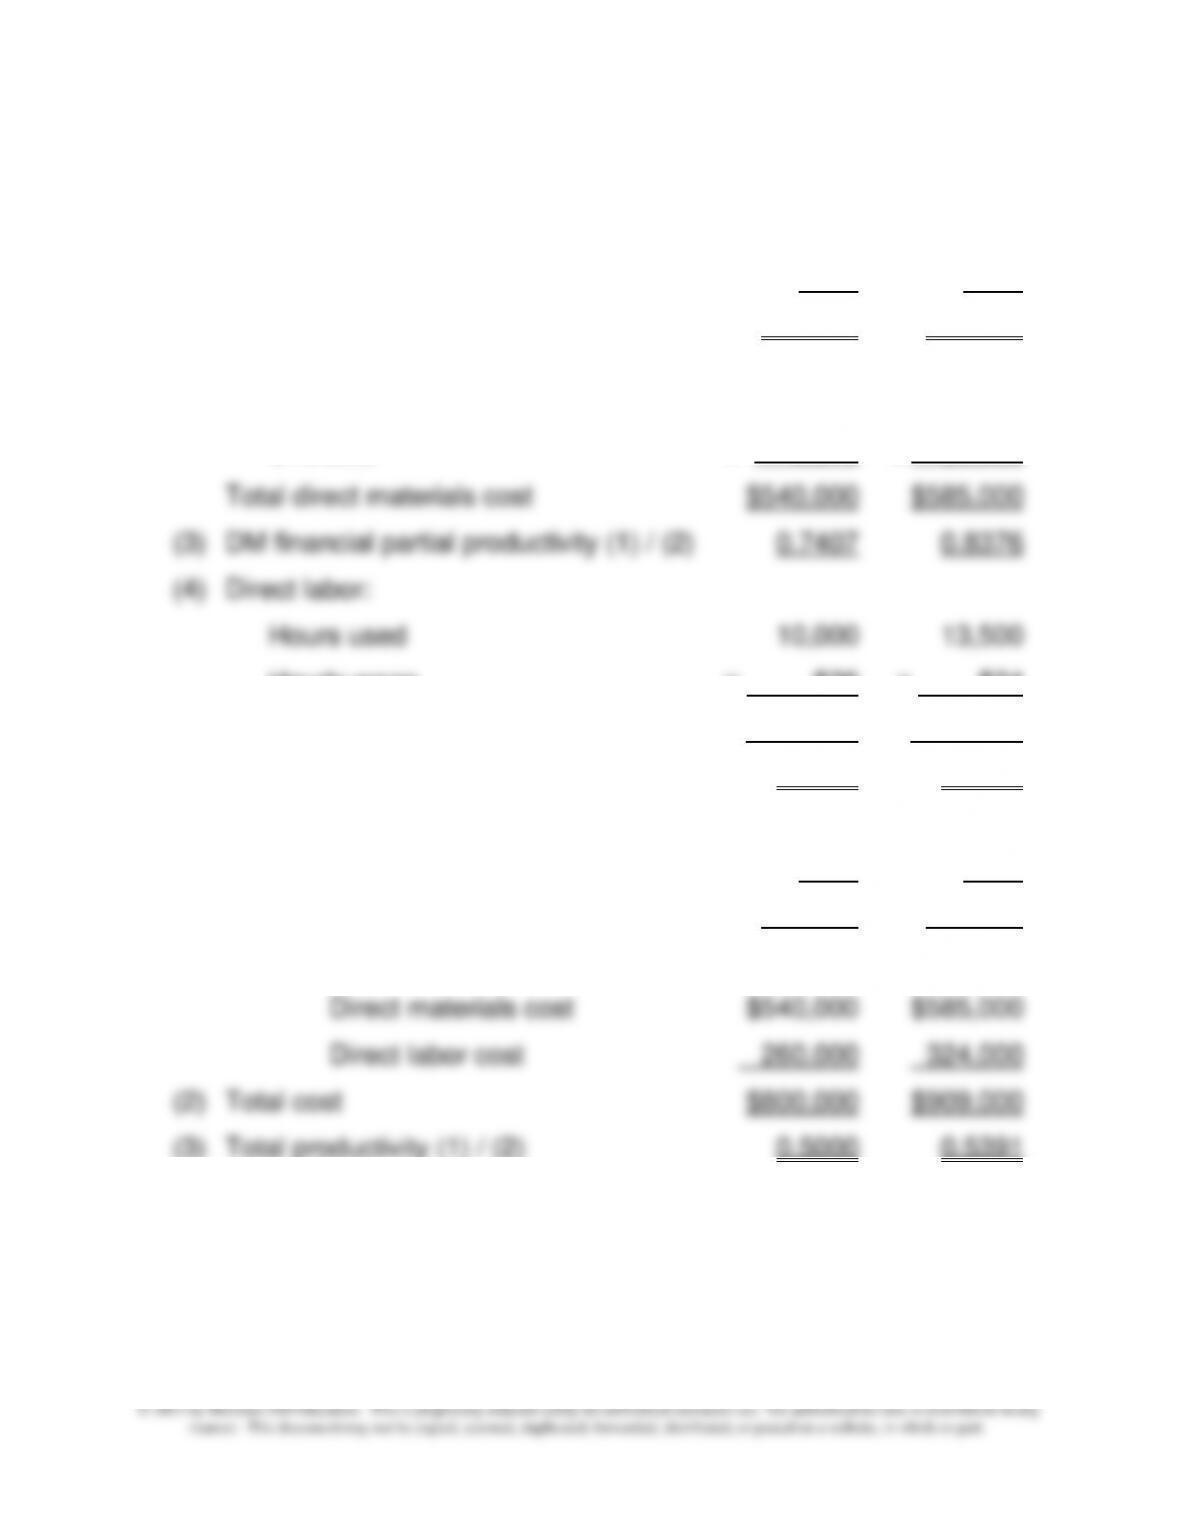
16-32 Financial Partial Productivity and Total Productivity (20 min)
1. Financial partial productivity:
2012 2013
(1) Output 400,000 490,000
(2) Direct materials:
Quantity 160 180
Unit cost x 3,375 x $3,250
Hourly wage x $26 x $24
Total direct labor cost $260,000 $324,000
(5) DL financial partial productivity (1) / (4) 1.5385 1.5123
2. Total productivity:
2012 2013
(1) Output 400,000 490,000
Total cost:
Chapter 16 - Operational Performance Measurement: Further Analysis of Productivity and Sales
16-12
16-32 (continued -1)
3. The decision was a good one. The direct labor productivity per direct
labor dollar decreased from 1.5385 units of output in 2012 to 1.5123 in
2013. However, direct materials productivity improved from 0.7407
units of output per direct materials dollar in 2012 to 0.8376 in 2013.
Chapter 16 - Operational Performance Measurement: Further Analysis of Productivity and Sales
16-13
16-33 Operational and Financial Partial Productivity (20 min)
1. Operational Partial Productivity: number of calls handled per
engineer
2012: 100,000 /10 = 10,000
2013: 108,000 / 8 = 13,500
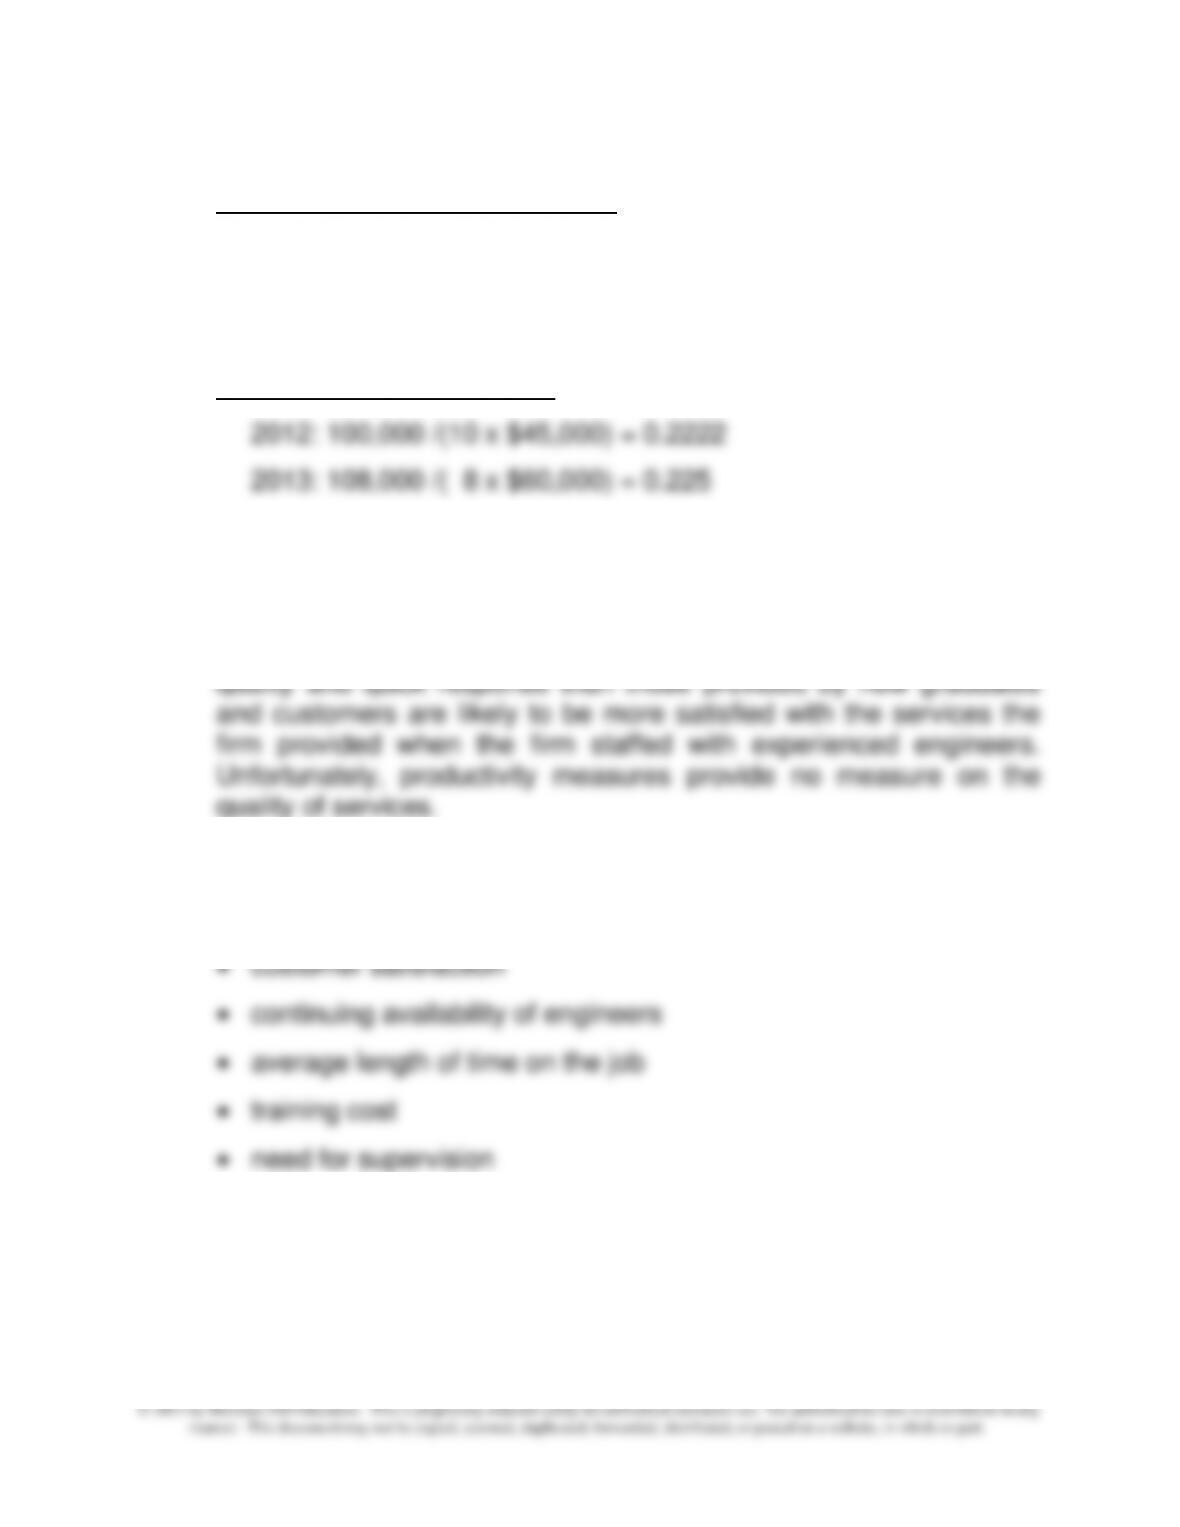
2. Financial Partial Productivity
3. Hiring of engineers with two years’ experience increased financial
partial productivity slightly. Although the firm paid the experienced
engineers higher salaries, on average each of these engineers was
able to answer more calls than newly graduated engineers.
Experienced engineers are likely to provide better services in
4. Among other factors that the firm needs to consider are:
• quality of the service provided
Chapter 16 - Operational Performance Measurement: Further Analysis of Productivity and Sales
16-14
16-34 Productivity: Which Way to Lean? (15 min)
1. Productivity measures can help a company become more efficient
by providing key measures that the company can track on a
2. The Toyota Production System (TPS) is a system designed to
reduce waste and improve quality in manufacturing. The main
elements of TPS are:
(1) a long term focus on relationships with suppliers, and
for a variety of tasks.
For additional resources on lean manufacturing and lean accounting,
see two Statements on Management Accounting by the Institute of
Management Accountants: Frances A. Kennedy and Brian H.
Maskell, “Accounting for the Lean Enterprise: Major Changes to the
Accounting Paradigm,” and Frances A Kennedy and Brian H.
Maskell, “Lean Enterprise Fundamentals”; at
http://www.imanet.org/resources_and_publications.aspx
Chapter 16 - Operational Performance Measurement: Further Analysis of Productivity and Sales
16-15
16-35 Quality and Productivity (20 min)
This question is intended for class discussion. The objective is to try to
balance the strategic success factors within an automotive company. The
answers are likely to vary. Here are some points to bring out in the
discussion:
• In the longer term, a car’s success in the market is determined by its
acceptance by the customer, not productivity. This means attention
in manufacturing, thus making these funds available for other
purposes.
• As noted in chapter 17, the cost of quality can be quite high, when
warranty costs and rework costs are considered. Thus, the savings
Useful reading on this matter: Dan Slater, “In the Race for Success,
Quality is More Important than Productivity,” Manufacturing & Technology
News (www.manufacturingnews.com/news/editorials/slater.html ). See
also, Matthew Boyle, “Cutting Costs Without Cutting Jobs,” Business
Week, March 9, 2009, p. 55.


