Chapter 16 – Operational Performance Measurement: Further Analysis of Productivity and Sales
16–55
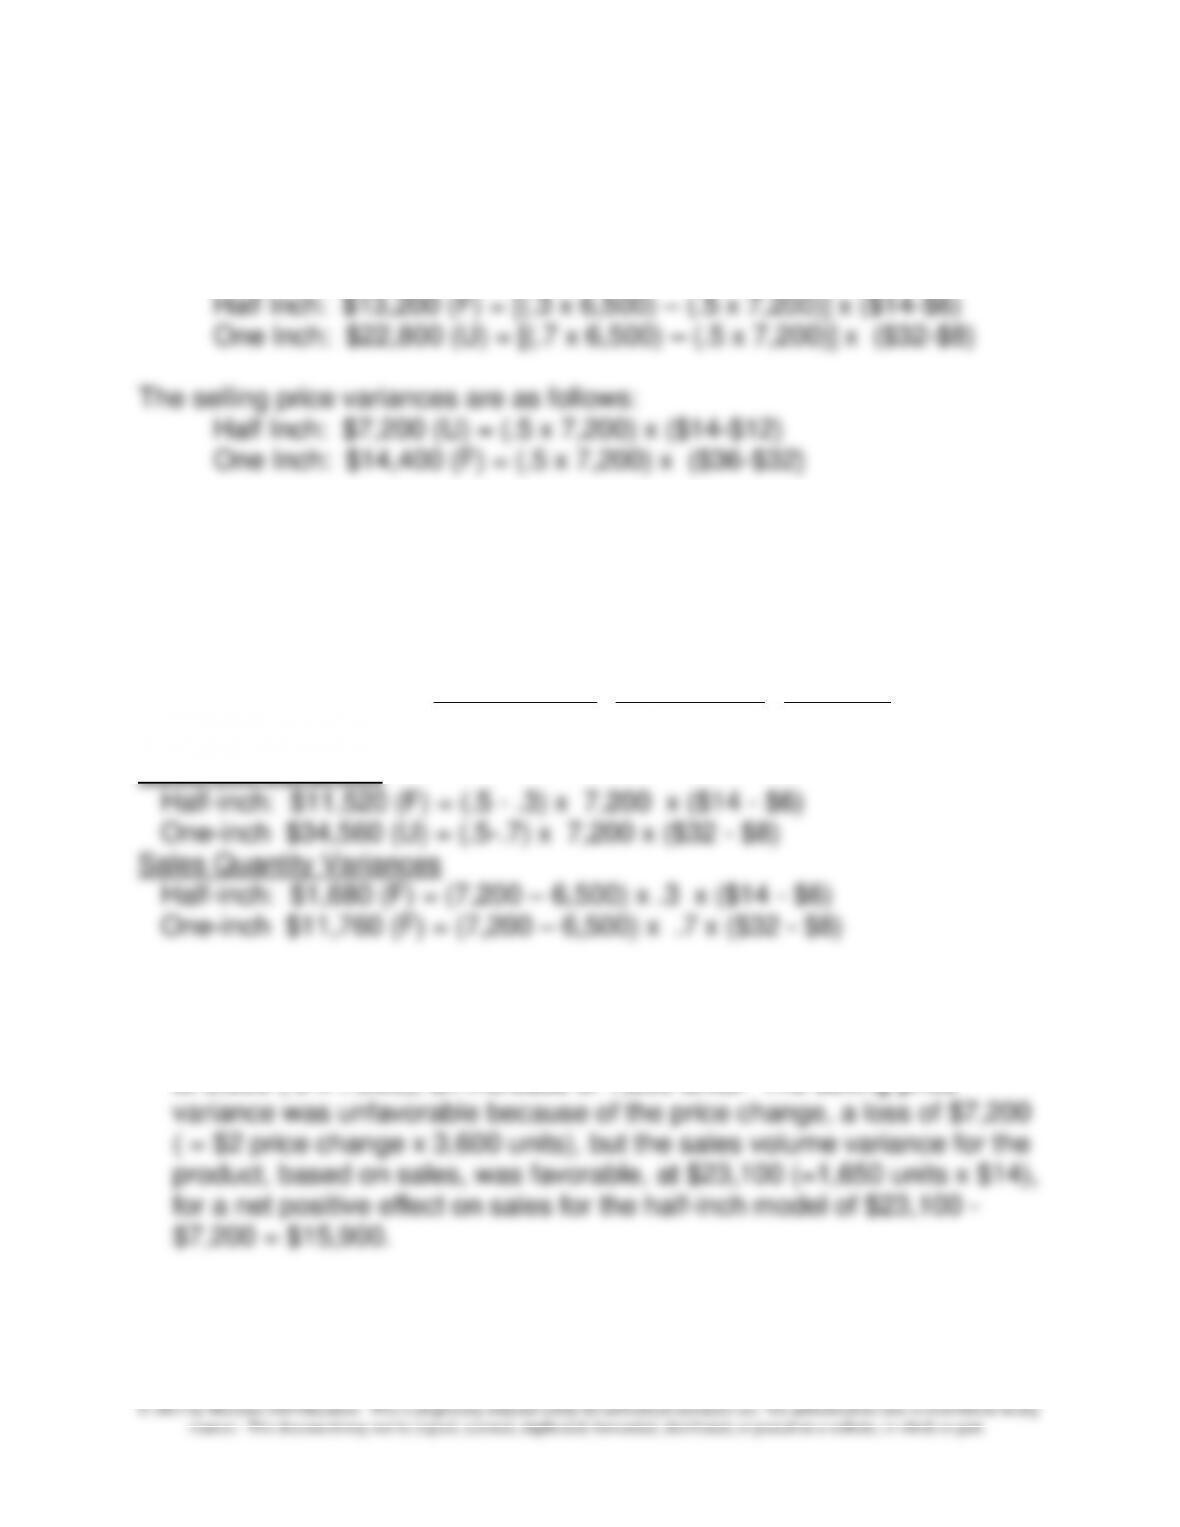
The calculations for the volume and selling price variances are shown
below.
The volume variances for each product:
16-56 (continued -1)
2. The sales mix and quantity variances based on contribution margin are
shown below.
Variance Variance Variance
Half Inch 11,520.00$ 1,680.00$ 13,200.00$
One Inch (34,560.00) 11,760.00 (22,800.00)
(23,040.00)$ 13,440.00$ (9,600.00)$
Sales Mix Variances
3.
The sales strategy of decreasing price on the half-inch model was a
success in sales volume as sales units increased from 1,950 (.3 x 6,500)
to 3,600 (.5 x 7,200), an increase of 1,650 units. The selling price
The strategy of increasing price on the one-inch model could have
caused the fall in sales of 950 units (.7 x 6,500 – .5 x 7,200) but it
produced a favorable selling price variance of $14,400, with an
Chapter 16 – Operational Performance Measurement: Further Analysis of Productivity and Sales
16–56
unfavorable sales volume variance of $30,400 (=950 x $32), based on
sales, for a net reduction of $16,000 in sales dollars.
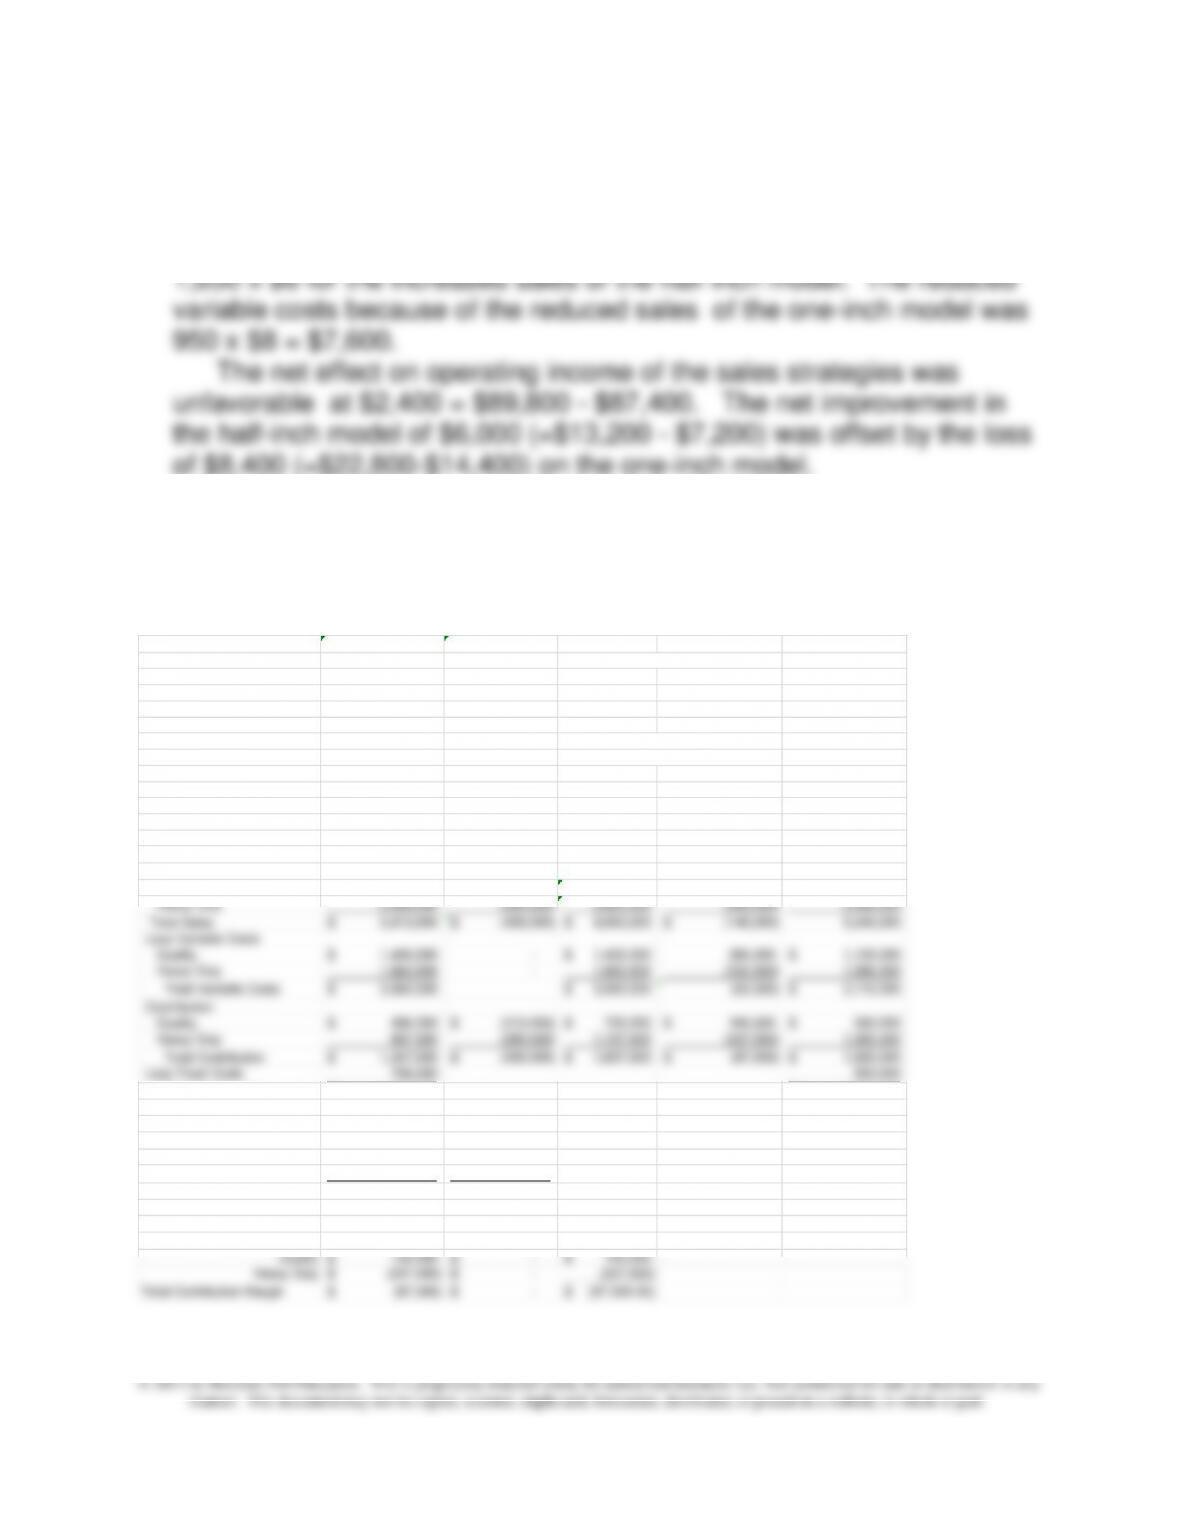
The cost of the increased sales volume on variable costs was $9,900 =
16-57 Comparative Income Statements and Sales Performance
Variances; Current to Prior Year (25 min)
1.
2013 2012
Sales Units 3,500 3,500 maintain sales level by cutting price
Sales Mix for each Product
Quality 50% 40.00%
Heavy Duty 50% 60.00%
Price
Quality 1,080$ 1,200$ 10% cut inprice in 2013
Heavy Duty 1,440 1,600 10% cut inprice in 2013
Variable Cost per Unit
Quality 800 800
Heavy Duty 950 950
Fixed cost 700,000 550,000
January Sales Price Flexible Sales Volume December
Sales 2013 Variance Budget Variance 2012
Quality 1,890,000$ (210,000)$ 2,100,000$ 420,000$ 1,680,000$
Heavy Duty 2,520,000 (280,000) 2,800,000 (560,000) 3,360,000
Total Sales 4,410,000$ (490,000)$ 4,900,000$ (140,000)$ 5,040,000
Less Variable Costs
Quality 1,400,000$ – 1,400,000$ 280,000 1,120,000$
Heavy Duty 1,662,500 – 1,662,500 (332,500) 1,995,000
Total Variable Costs 3,062,500$ 3,062,500$ (52,500) 3,115,000$
Contribution
Quality 490,000$ (210,000)$ 700,000$ 140,000$ 560,000$
Heavy Duty 857,500 (280,000) 1,137,500 (227,500) 1,365,000
Total Contribution 1,347,500$ (490,000)$ 1,837,500$ (87,500)$ 1,925,000$
Less Fixed Costs 700,000 550,000
Operating Income 647,500$ 1,375,000$
Sales Price Sales Volume
Chapter 16 – Operational Performance Measurement: Further Analysis of Productivity and Sales
16–57
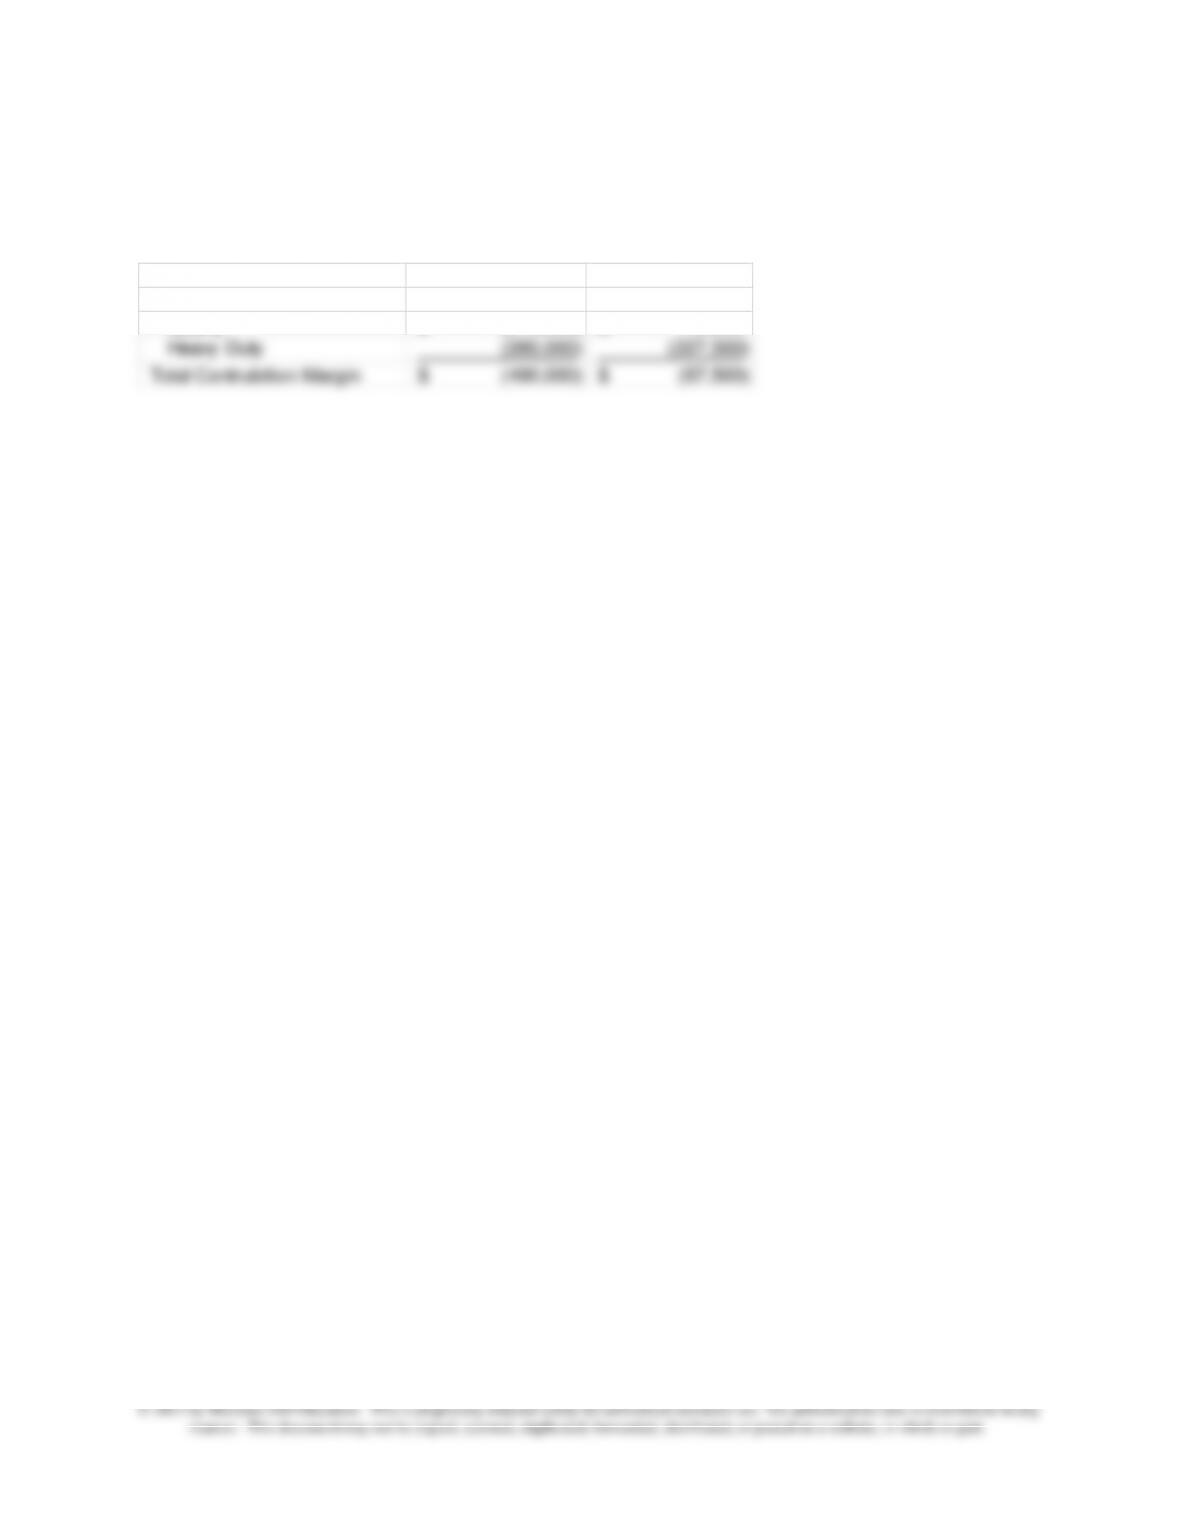
The selling price variances and volume variances based on
contribution are summarized as follows:
Sales Price Sales Volume
Contribution Margin Variance Variance
Quality (210,000)$ 140,000$
Heavy Duty (280,000) (227,500)
Total Contrubition Margin (490,000)$ (87,500)$
16–58
16-57 (continued –1)
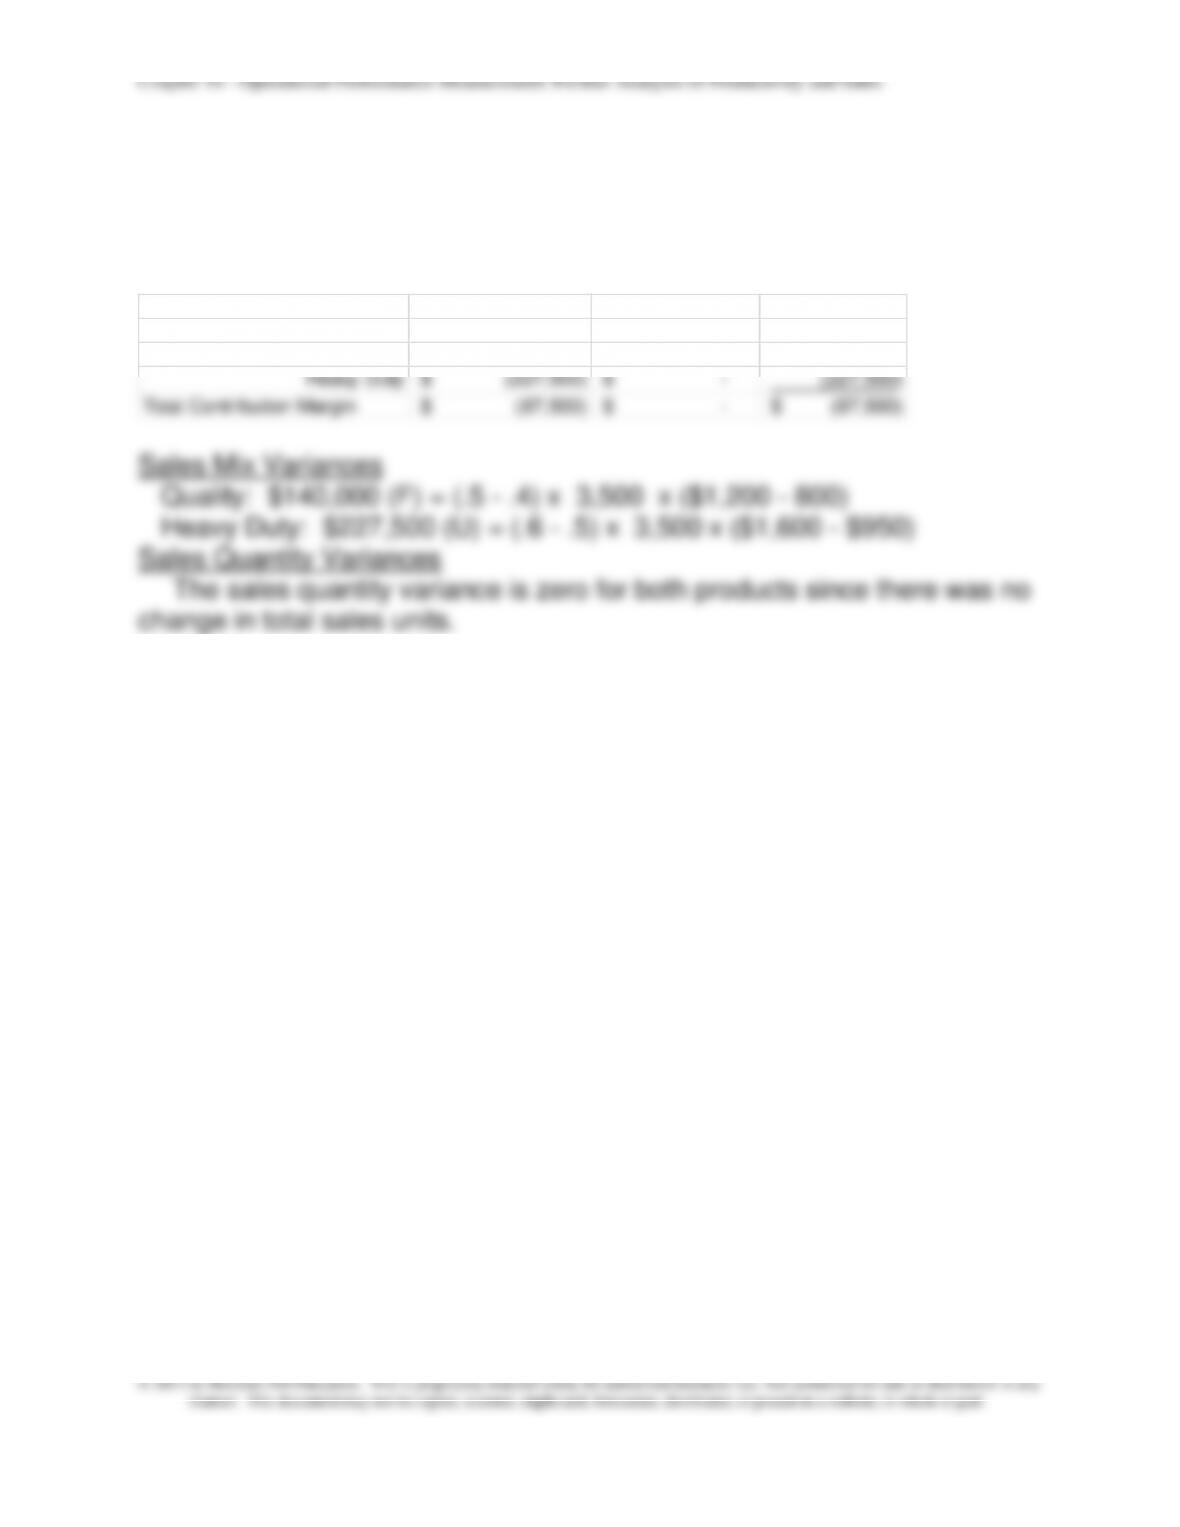
2. Sales mix and quantity variances
Sales Mix Sales Quantity Volume
Product Contribution Margin Variance Variance Variance
Quality 140,000$ –$ 140,000$
Heavy Duty (227,500)$ –$ (227,500)
Total Contribution Margin (87,500)$ –$ (87,500)$
Sales Mix Variances
Quality: $140,000 (F) = (.5 – .4) x 3,500 x ($1,200 – 800)
Heavy Duty: $227,500 (U) = (.6 – .5) x 3,500 x ($1,600 – $950)
Sales Quantity Variances
The sales quantity variance is zero for both products since there was no
change in total sales units.
16–59
16-57 (continued –2)
3.
As expected, there were significant losses reflected in the large selling
price variances, a total unfavorable variance of $490,000. There was a
large unfavorable volume variance as well, an unfavorable variance of
$87,500, which is due entirely to the change in product mix, since there
was no change in sales quantity. Note that the volume variance is a
combination of the mix and quantity variances. There was a favorable mix
variance for the Quality product of $140,000 due to its increase from 40%
the reason for this unexpected result. Perhaps the advertising was
designed to draw attention to the Quality product. Or alternatively, the
lowering of prices for both products brought greater attention to the Quality
product, the lower priced product. Since the Heavy Duty product is likely to
continue to have higher margins, this trend in sales is a concern for the
company.
Chapter 16 – Operational Performance Measurement: Further Analysis of Productivity and Sales
16–60
16-57 (continued –3)
4.
The decrease in operating income from $1,375,000 to $647,500 from 2012
to 2013 is a major concern. As indicated in the problem, the firm is starting
to study ways to reduce variable costs for the coming year. A useful way
to start this planning is to use target costing and continuous improvement,
as explained in chapter 13. Target costing looks at ways to redesign the
product or manufacturing process to reduce manufacturing costs. This
measures for the key manufacturing cost factors, and to monitor these
measures to seek improvement.
Another approach a student might suggest is to use ABC costing to better
understand the drivers of indirect costs. However, note that total fixed
these inputs. The six variable cost variances are usage and price for
materials, usage and rate for labor, and usage and spending variances for
variable overhead.
Chapter 16 – Operational Performance Measurement: Further Analysis of Productivity and Sales
16–61
16–58 Sales and Variable Cost Variances; Current to Prior Year; Review
of Chapter 14 (30 min)
1.
2013 2012 Change
Sales Units 39,200 45,500 (6,300.00)
Price 23.85$ 27.99$ (4.14)
Materials cost per unit of material 7.80$ 8.20$ (0.40)
Materials required/unit 1.80 2.00 (0.20)
Labor required/unit 0.60 0.75 (0.15)
Wage rate ($/hour) 14.00$ 15.00$ (1.00)
Unit Contribution 1.41 0.34
Sales Price and Sales Volume Variances Sales
Sales Price Flexible Volume
2013 Variance Budget Variance 2012
Gross Sales: 934,920$ (162,288)$ 1,097,208$ (176,337)$ 1,273,545$
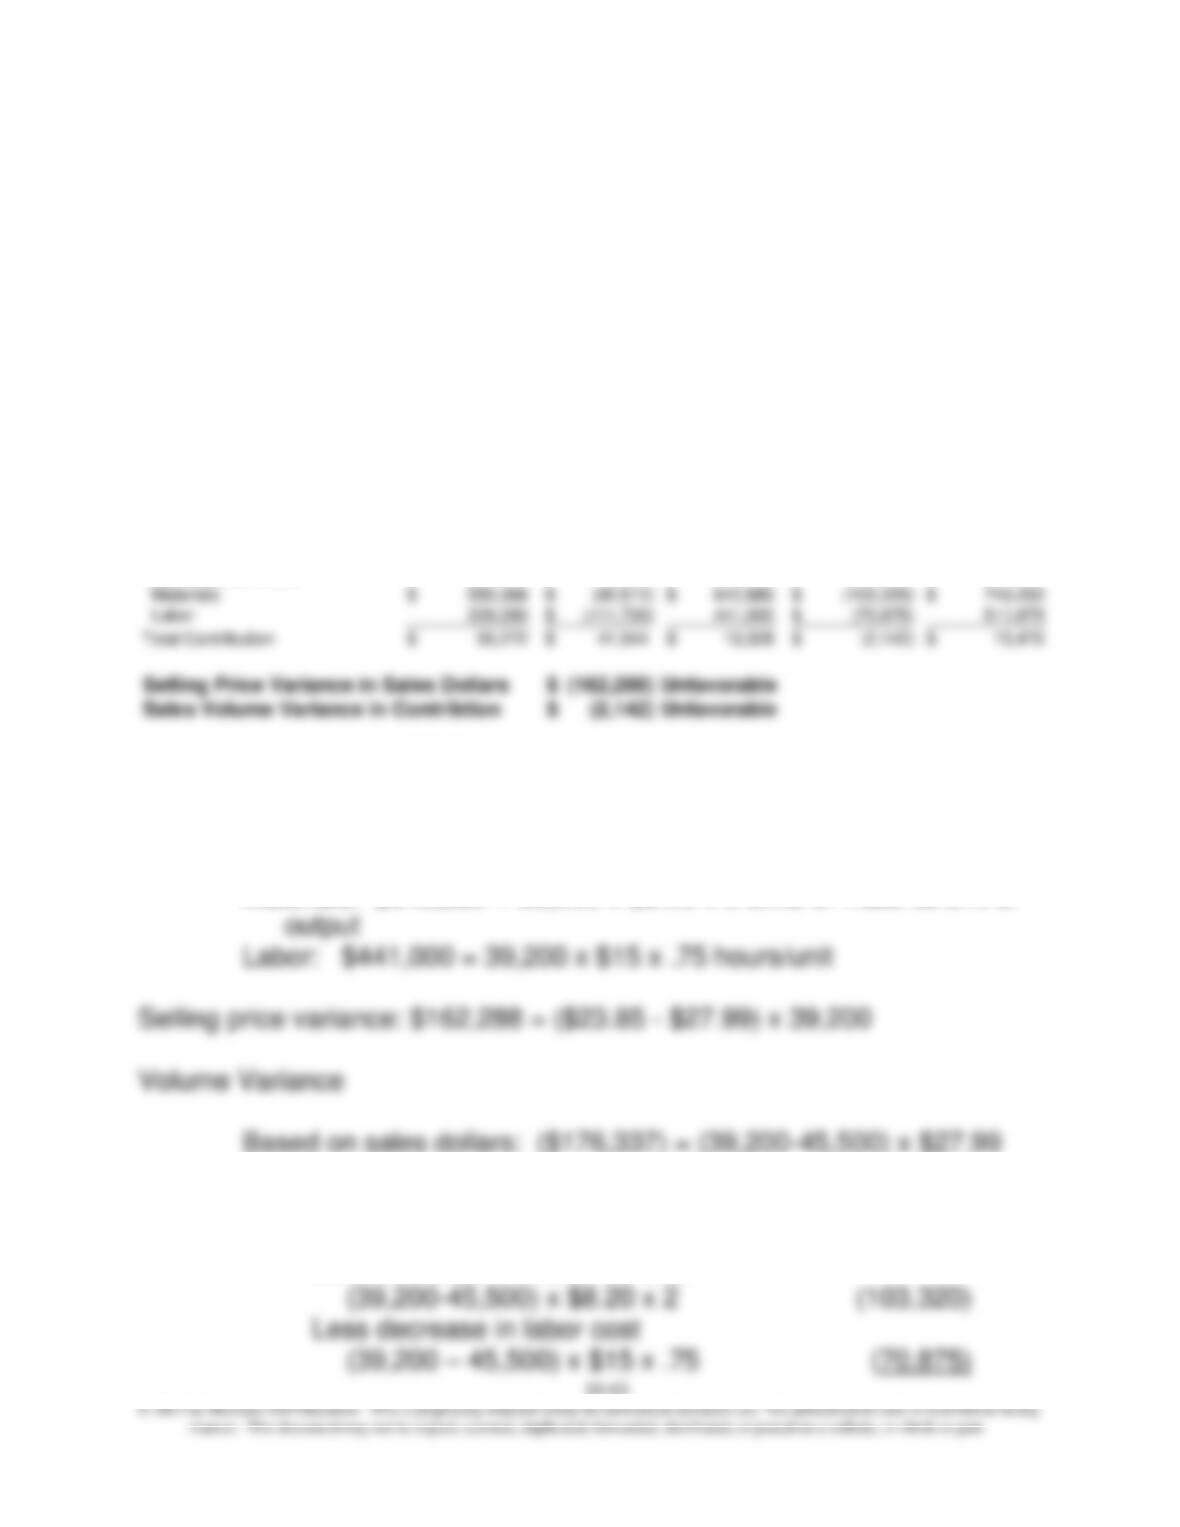
Less Variable Costs
Materials 550,368$ (92,512)$ 642,880$ (103,320)$ 746,200$
Labor 329,280 (111,720)$ 441,000 (70,875)$ 511,875
Total Contribution 55,272$ 41,944$ 13,328$ (2,142)$ 15,470$
Selling Price Variance in Sales Dollars (162,288)$ Unfavorable
Sales Volume Variance in Contribtion (2,142)$ Unfavorable
The flexible budget, the center column, is determined as follows:
2013 sales at 2012 prices and unit variable costs
Sales: $1,097,208 = 39,200 x $27.99
Materials: $642,880 = 39,200 x $8.20 x 2 units of material/unit of
Based on contribution:
= $(176,337)
Less decrease in materials cost
Chapter 16 – Operational Performance Measurement: Further Analysis of Productivity and Sales
16–62
Volume variance based on contribution $(2,142)
16–58 (continued –1)
2.
Materials and labor usage and price variances
Price/Rate Actual Input @ Usage Flexible
2013 Variance prior year rate Variance Budget
Materials 550,368$ 28,224$ 578,592$ 64,288$ 642,880$
Labor 329,280 23,520 352,800 88,200 441,000
Total 879,648$ 51,744$ 152,488$ 1,083,880$
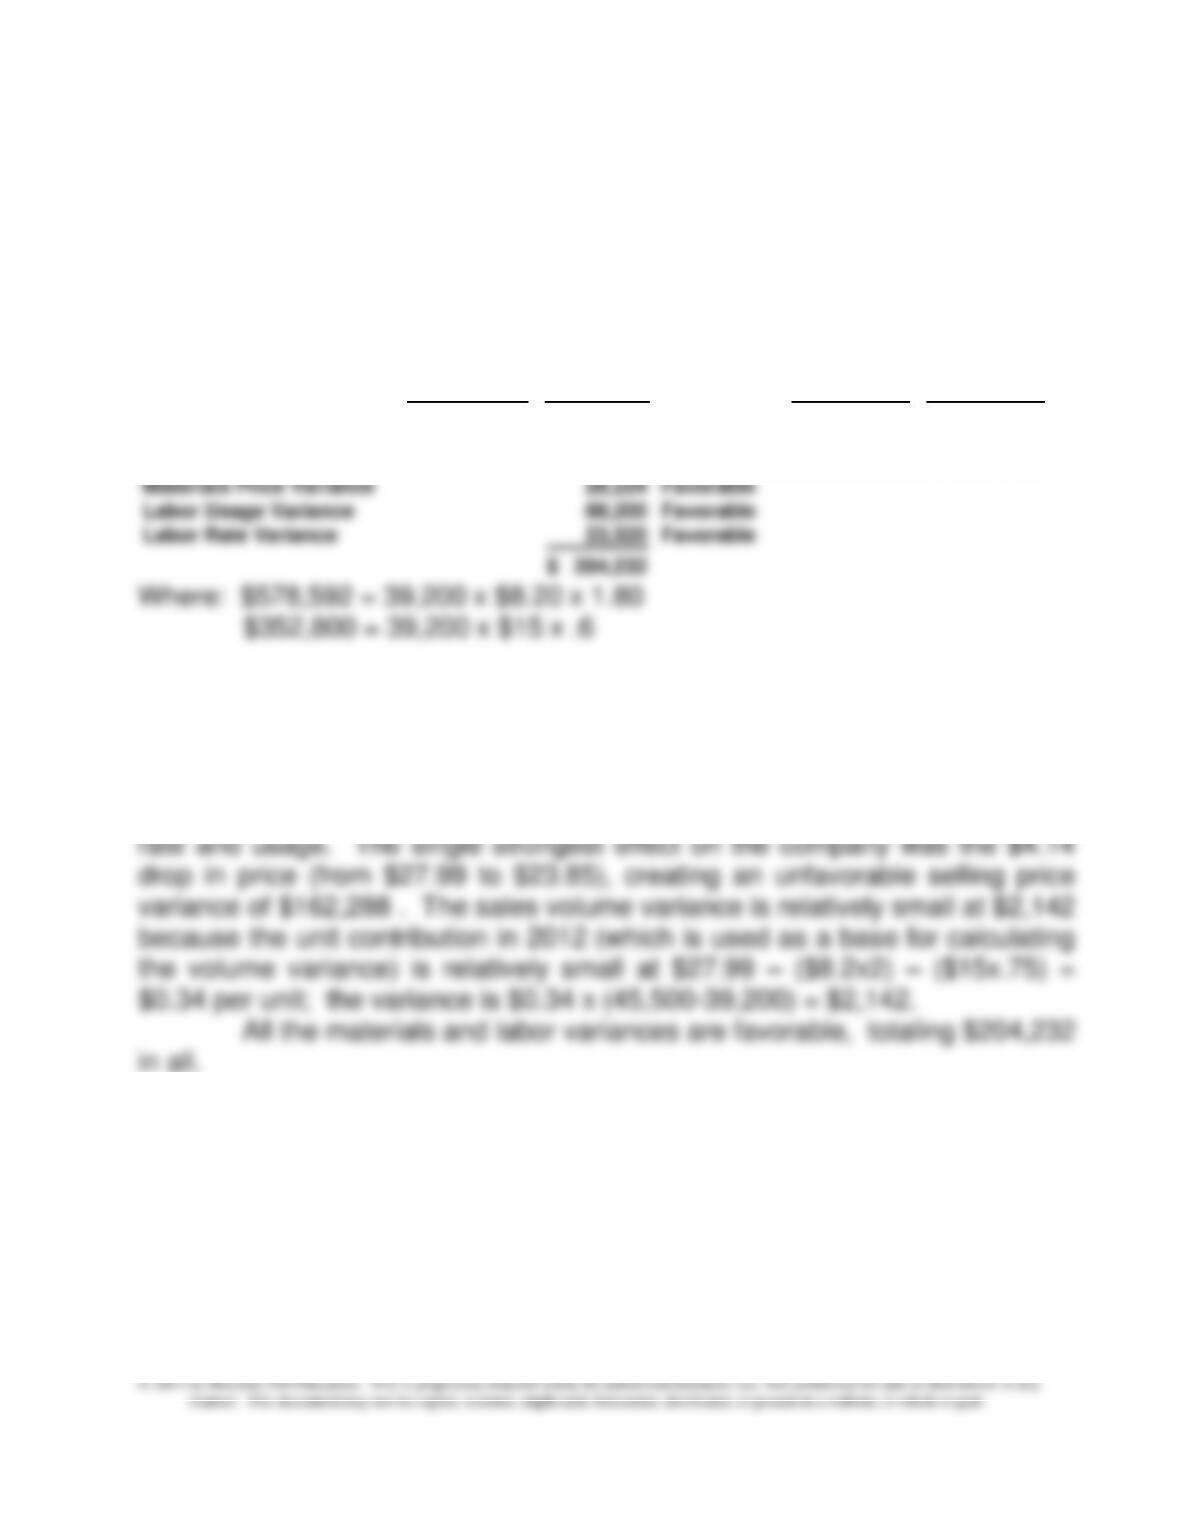
Materials Usage Variance 64,288$ Favorable
Materials Price Variance 28,224 Favorable
Labor Usage Variance 88,200 Favorable
Labor Rate Variance 23,520 Favorable
204,232$
Where: $578,592 = 39,200 x $8.20 x 1.80
$352,800 = 39,200 x $15 x .6
3.
The analysis above shows that RJM has succeeded in returning to
profitability, despite the falling sales and sales prices. RJM has accomplished
this through reductions in materials price and usage and reductions in labor