Chapter 16 – Operational Performance Measurement: Further Analysis of Productivity and Sales
16–46
16–52 Sales Volume, Sales Quantity, and Sales Mix Variances (20 min)
Sales Mix
Budget Actual
Flavor Quantity Mix Quantity Mix
Vanilla 250,000 .3125 180,000 .18750
1. a. Sales Volume Variance
Budgeted Sales
Sales Quantity Contribution Volume
Flavor Actual Budget Difference Margin/Unit Variance
Vanilla 180,000 250,000 70,000 x $0.70 = $ 49,000 U
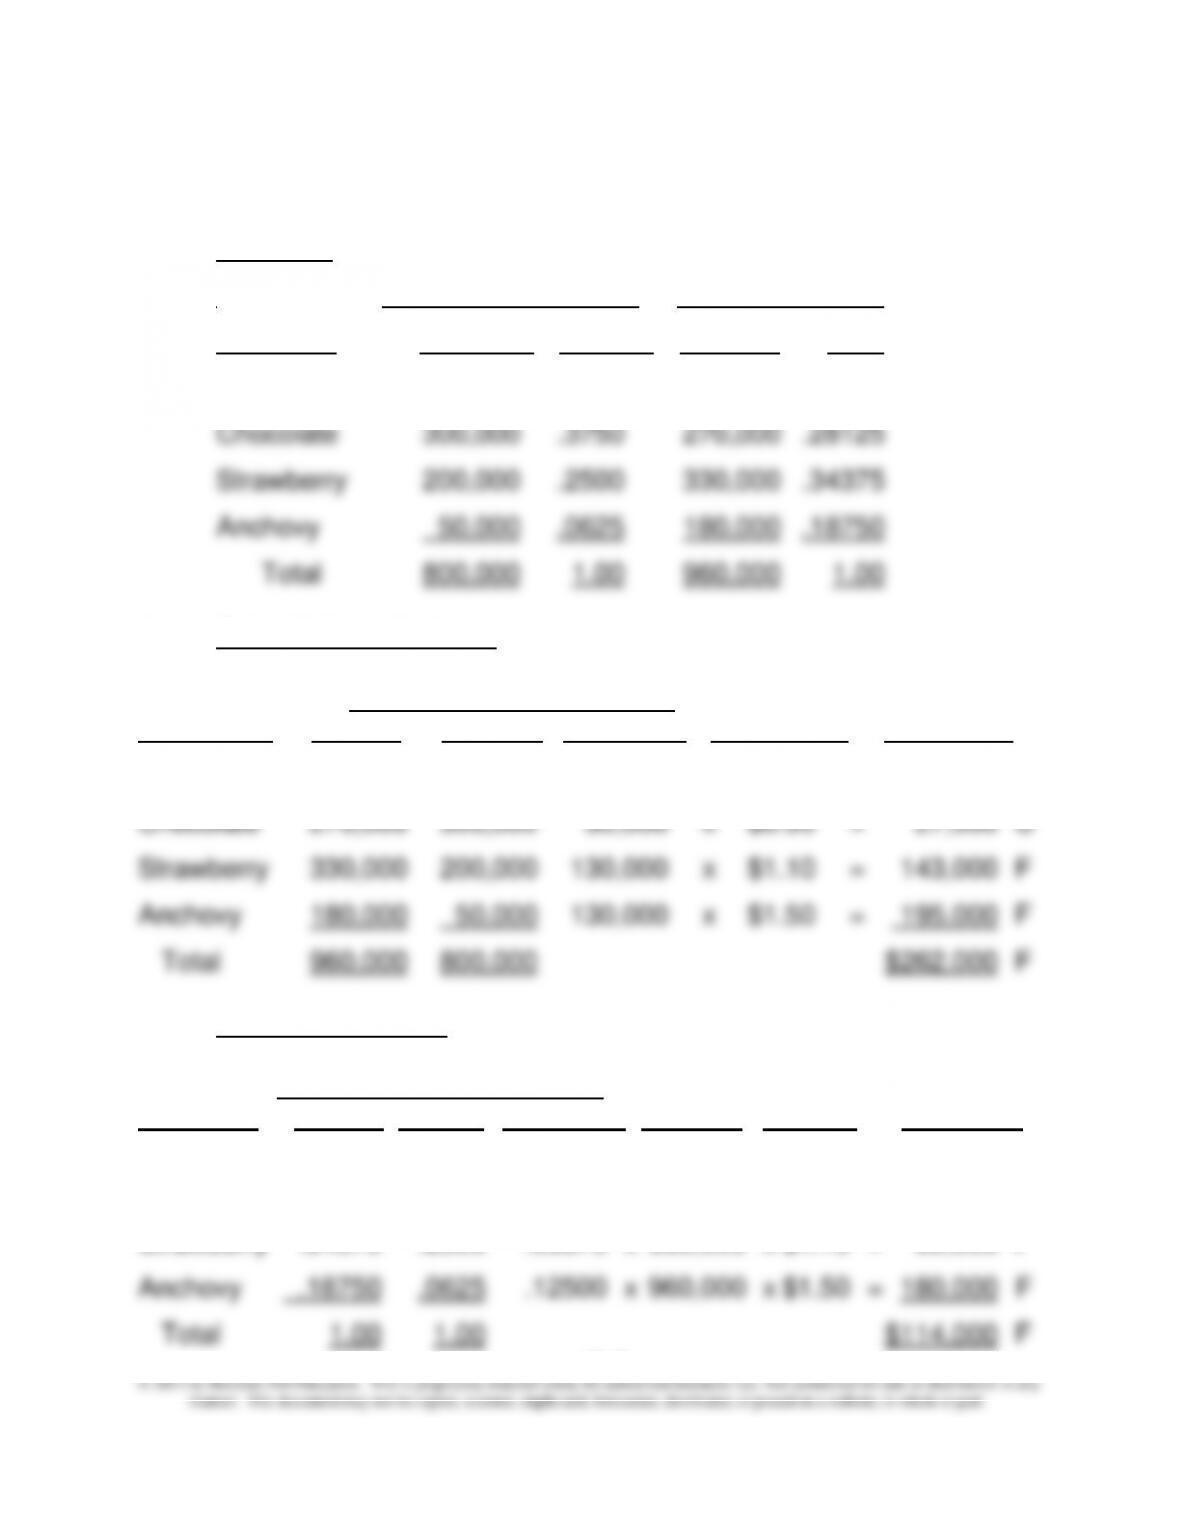
1. b. Sales Mix Variance
Total Budgeted Sales
Sales Mix Actual CM Mix
Flavor Actual Budget Difference Quantity per Unit Variance
Vanilla .18750 .3125 – .12500 x 960,000 x $ .70 = 84,000 U
Chocolate .28125 .3750 – .09375 x 960,000 x $ .90 = 81,000 U
Strawberry .34375 .2500 .09375 x 960,000 x $1.10 = 99,000 F
Chapter 16 – Operational Performance Measurement: Further Analysis of Productivity and Sales
16–47
16-52 (continued –1)
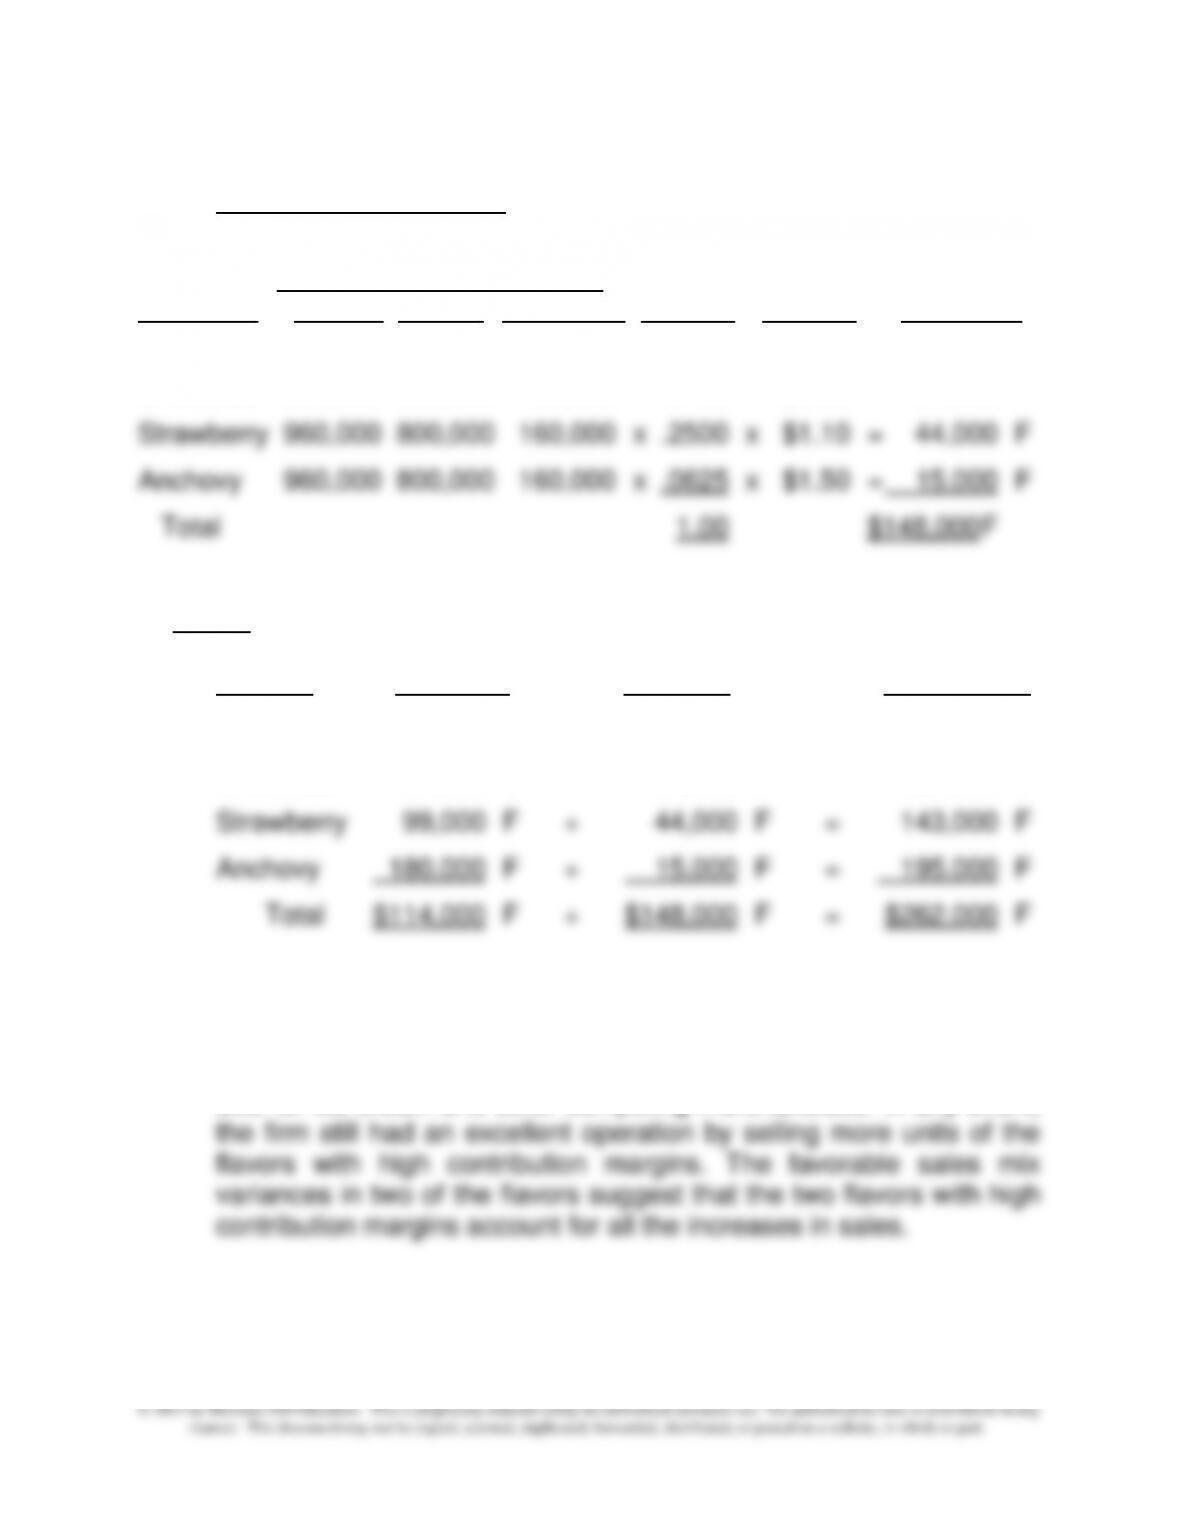
1. c. Sales Quantity Variance
Budget Budgeted Sales
Sales Mix Sales CM Quantity
Flavor Actual Budget Difference Mix per Unit Variance
Vanilla 960,000 800,000 160,000 x .3125 x $0.70 = $35,000 F
Chocolate 960,000 800,000 160,000 x .3750 x $0.90 = 54,000 F
Recap
Sales Mix Sales Quantity Sales Volume
Flavor Variance Variance Variance
Vanilla $ 84,000 U + $ 35,000 F = $ 49,000 U
Chocolate 81,000 U + 54,000 F = 27,000 U
2. Overall, the firm has enjoyed a good year. The total sales
substantially exceed the budgeted amount (20%). The increases in
sales could have been a result of the increase of the entire market
size for ice cream and other competing merchandises. In any event,
Chapter 16 – Operational Performance Measurement: Further Analysis of Productivity and Sales
16–48
16–52 (continued –2)
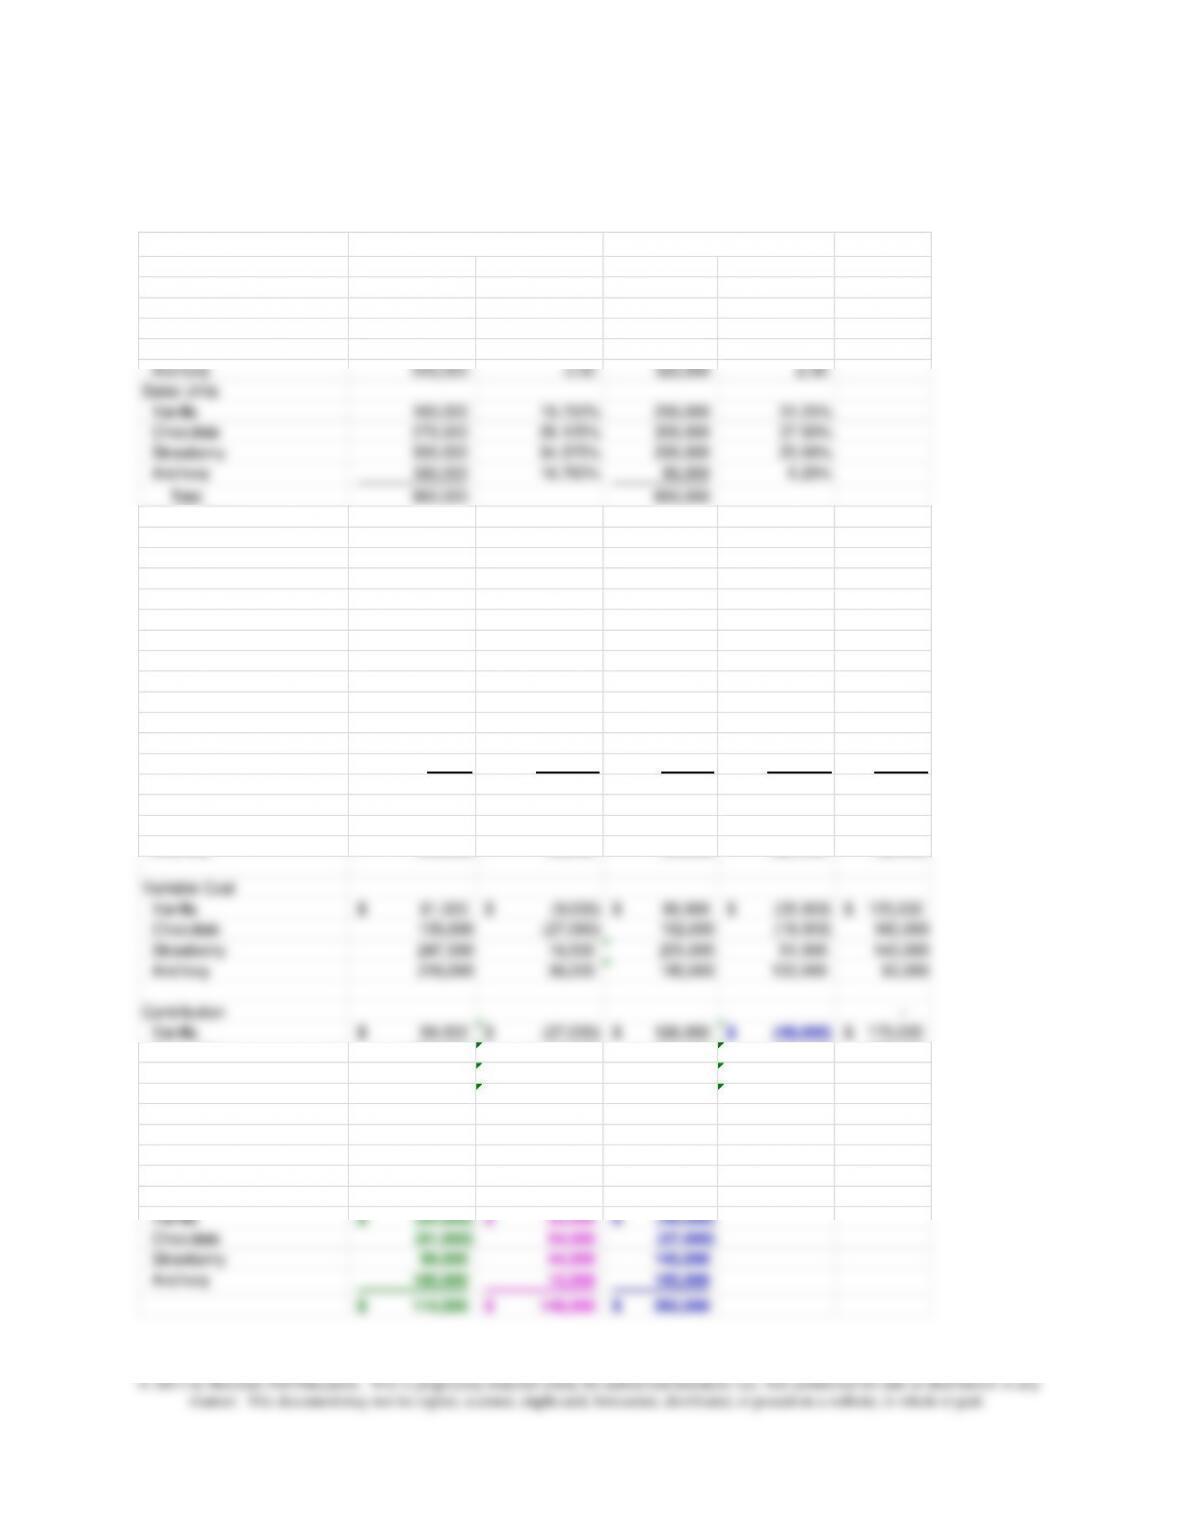
The spreadsheet solution for 16-52 is provided below:
Total per unit or % Total per unit or %
Sales
Vanilla 180,000$ 1.00$ 300,000$ 1.20$
Chocolate 364,500 1.35 450,000 1.50
Strawberry 660,000 2.00 360,000 1.80
Anchovy 540,000 3.00 125,000 2.50
Sales Units
Vanilla 180,000 18.750% 250,000 31.25%
Chocolate 270,000 28.125% 300,000 37.50%
Strawberry 330,000 34.375% 200,000 25.00%
Anchovy 180,000 18.750% 50,000 6.25%
Total 960,000 800,000
Variable Cost
Vanilla 81,000$ 0.45$ 125,000$ 0.50$
Chocolate 135,000 0.50 180,000 0.60
Sales Price Flexible Sales Volume
Sales Actual Variance Budget Variance Budget
Vanilla 180,000$ (36,000) $216,000 (84,000) 300,000$
Chocolate 364,500 (40,500) 405,000 (45,000) 450,000
Strawberry 660,000 66,000 594,000 234,000 360,000
Anchovy 540,000 90,000 450,000 325,000 125,000
Variable Cost
Vanilla 81,000$ (9,000)$ 90,000$ (35,000)$ 125,000$
Chocolate 135,000 (27,000) 162,000 (18,000) 180,000
Strawberry 247,500 16,500 231,000 91,000 140,000
Anchovy 216,000 36,000 180,000 130,000 50,000
Contribution –
Vanilla 99,000$ (27,000)$ 126,000$ (49,000)$ 175,000$
Chocolate 229,500 (13,500) 243,000 (27,000) 270,000
Strawberry 412,500 49,500 363,000 143,000 220,000
Strawberry 99,000 44,000 143,000
Anchovy 180,000 15,000 195,000
114,000$ 148,000$ 262,000$
Actual
Budget
Chapter 16 – Operational Performance Measurement: Further Analysis of Productivity and Sales
16–49
16–53 Market Size and Market Share Variances (20 min)
1.
Selling price variance: ($.48 – $.52) x 69,120,000 =$2,764,800 U
Sales volume variance:
(69,120,000 – 80,000,000) x $.40 = 4,352,000 U
Total operating income variance $7,116,800 U
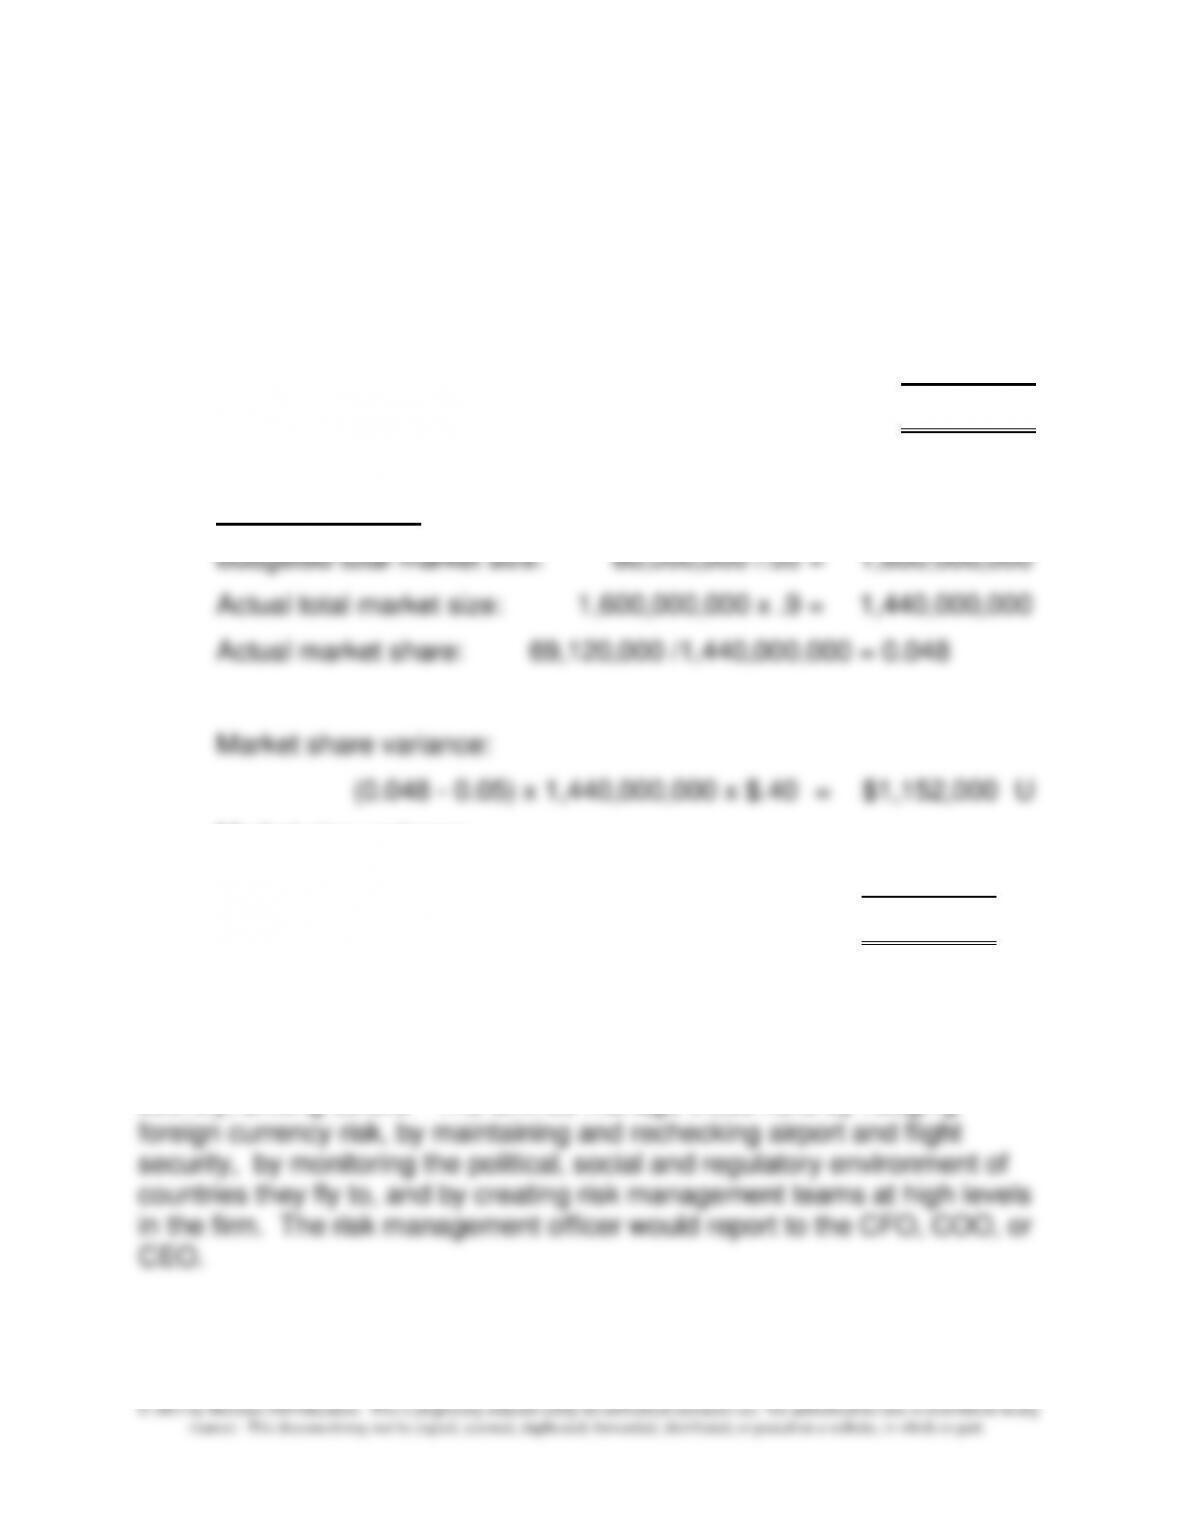
Total market size
Market size variance:
(1,440,000,000 – 1,600,000,000) x .05 x $.40 = 3,200,000 U
Total $4,352,000 U
2. The global risks for an airline include weather events, foreign currency
fluctuations, disruptions in political environments, terrorist activities (as in
the case in this problem), and changes in regulations from country to
country, among others. The airlines manage these risks by hedging
Chapter 16 – Operational Performance Measurement: Further Analysis of Productivity and Sales
16–50
16–54 Market Size and Market Share Variances (15 min)
WS= Welcome Signs; BH= Birdhouses
1. Budget Actual (per month)____
Diane’s Designs Industry Share Diane’s Designs Industry Share
WS 50 3,000 1.6667% 45 3,000 1.5%
BH 25 200 12.5% 35 175 20%
2. Weighted Average Budgeted Contribution Margin Per Unit:
Budgeted contribution margin per unit for both products:
$240 75 = $3.20
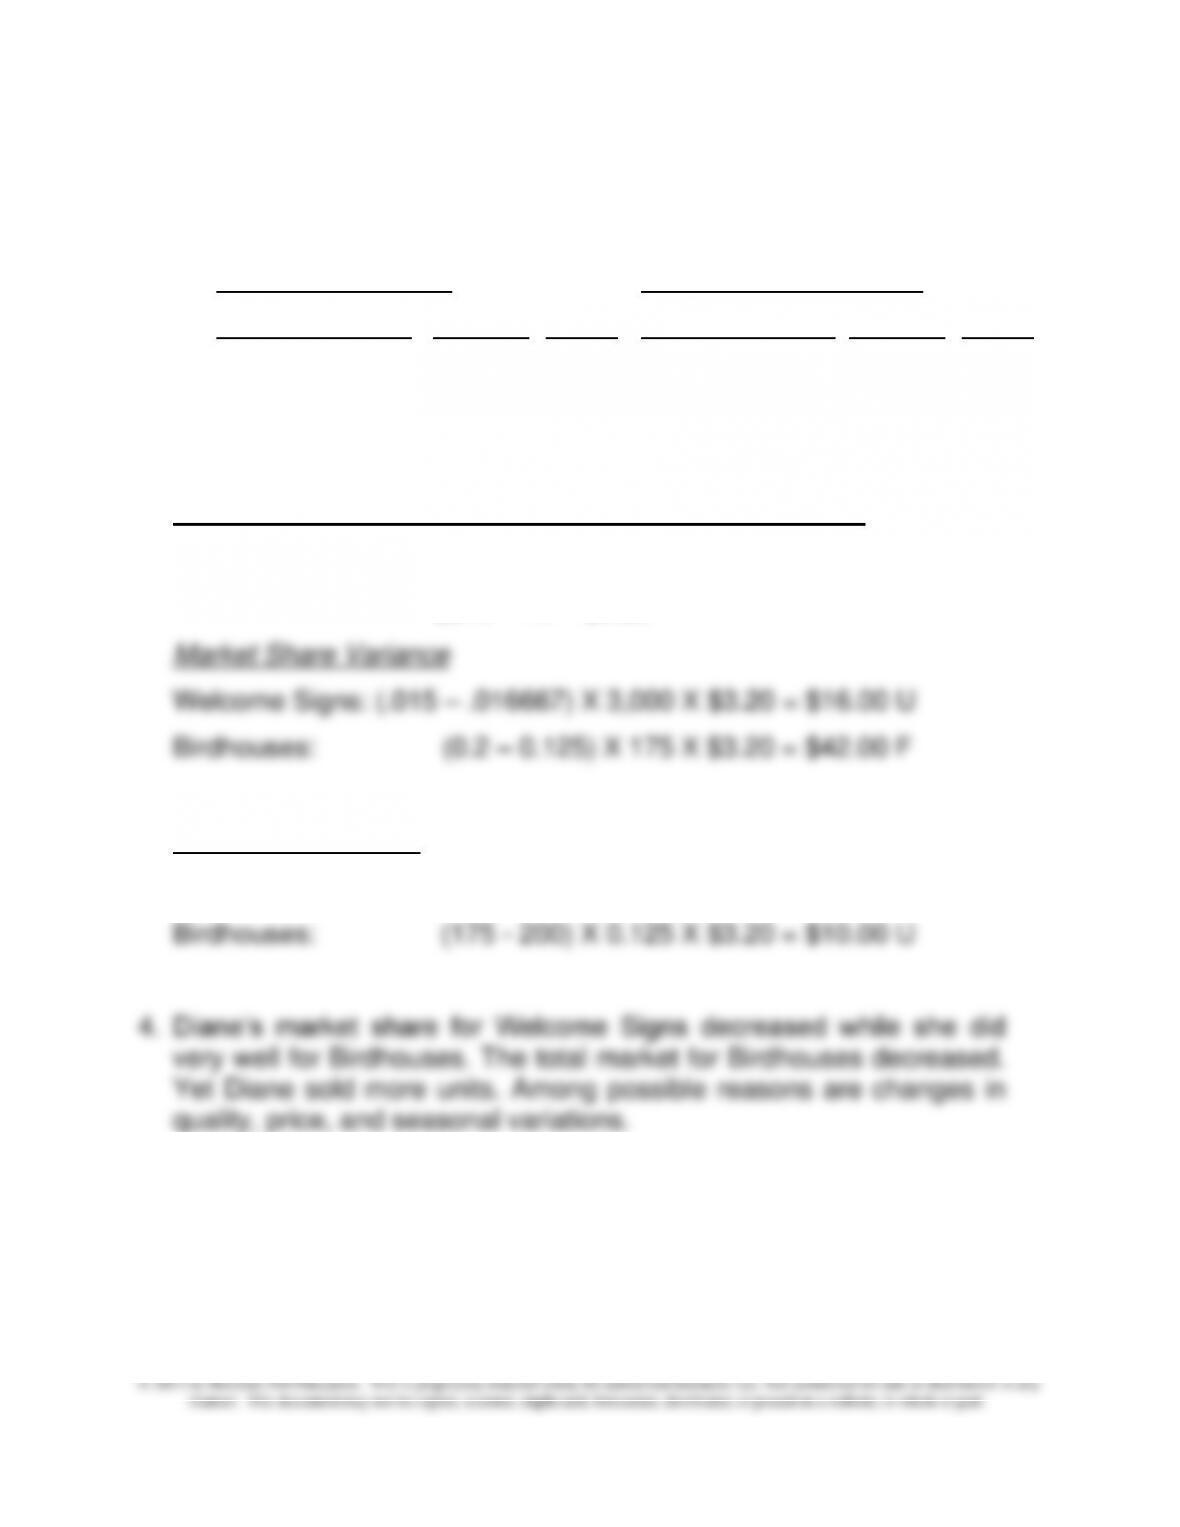
3. Market size variance
Welcome Signs: (3,000 – 3,000) X 0.1 X $3.20 = $ 0
Chapter 16 – Operational Performance Measurement: Further Analysis of Productivity and Sales
16–51
16–54 (continued –1)
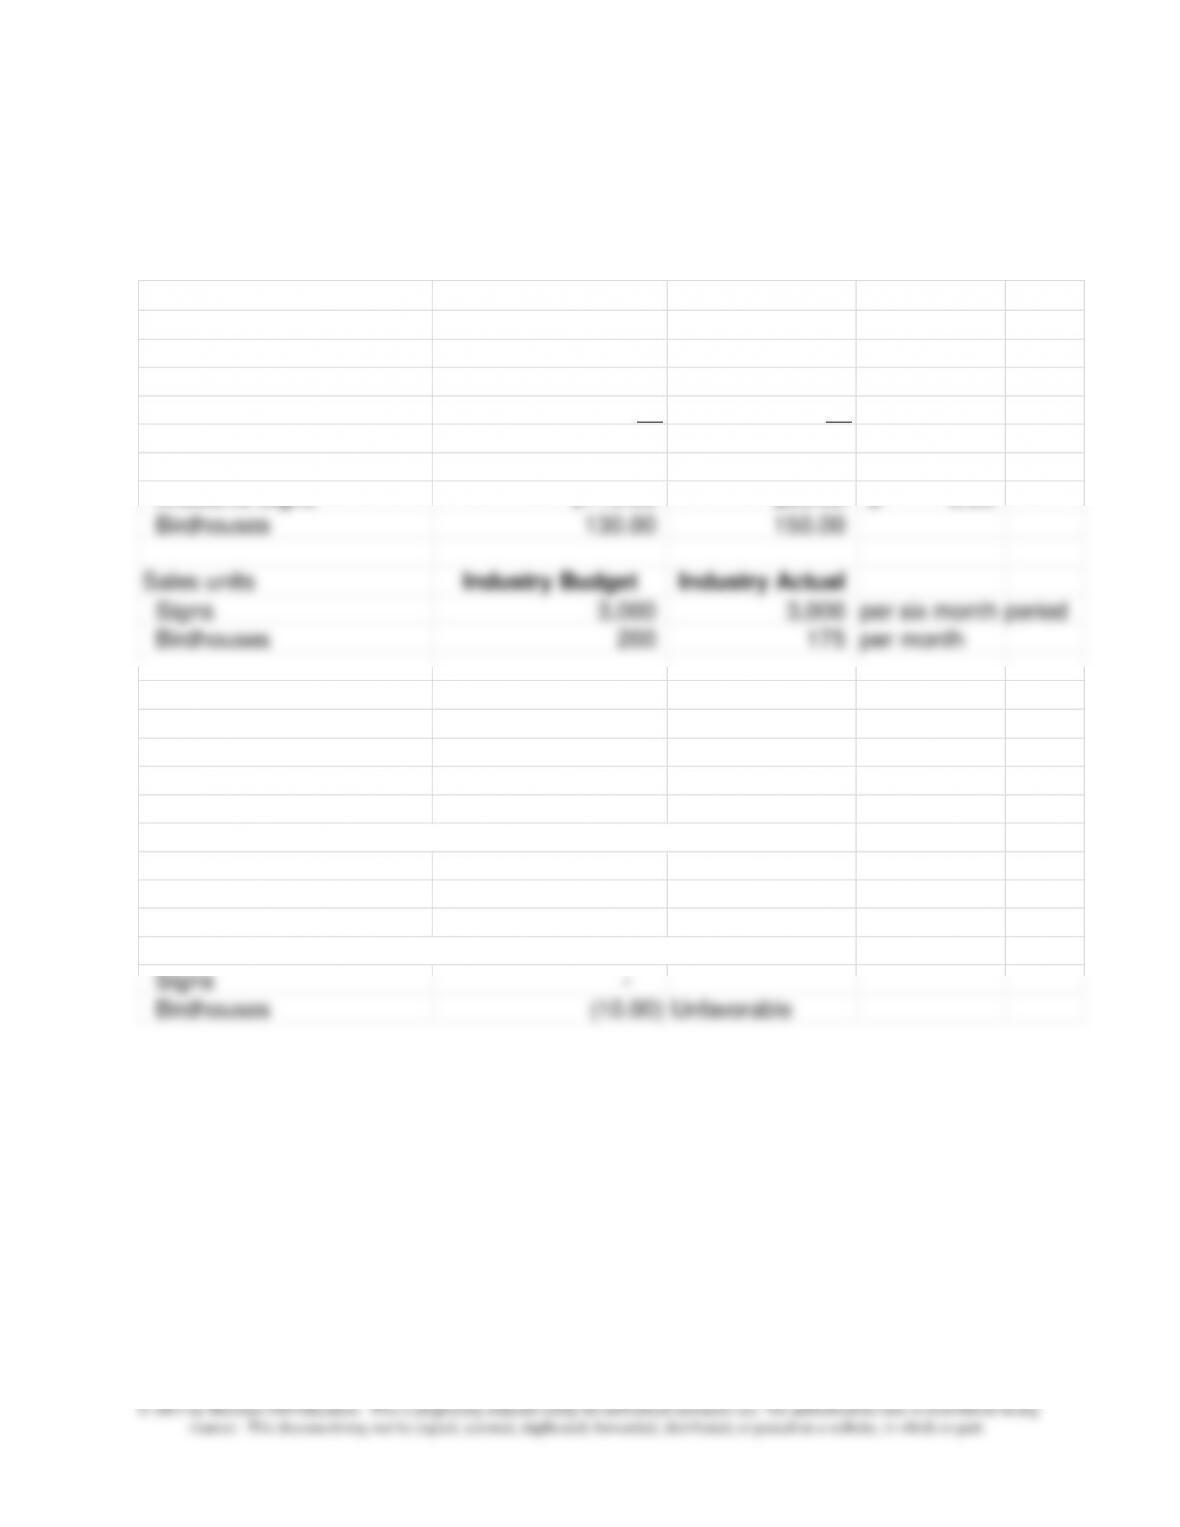
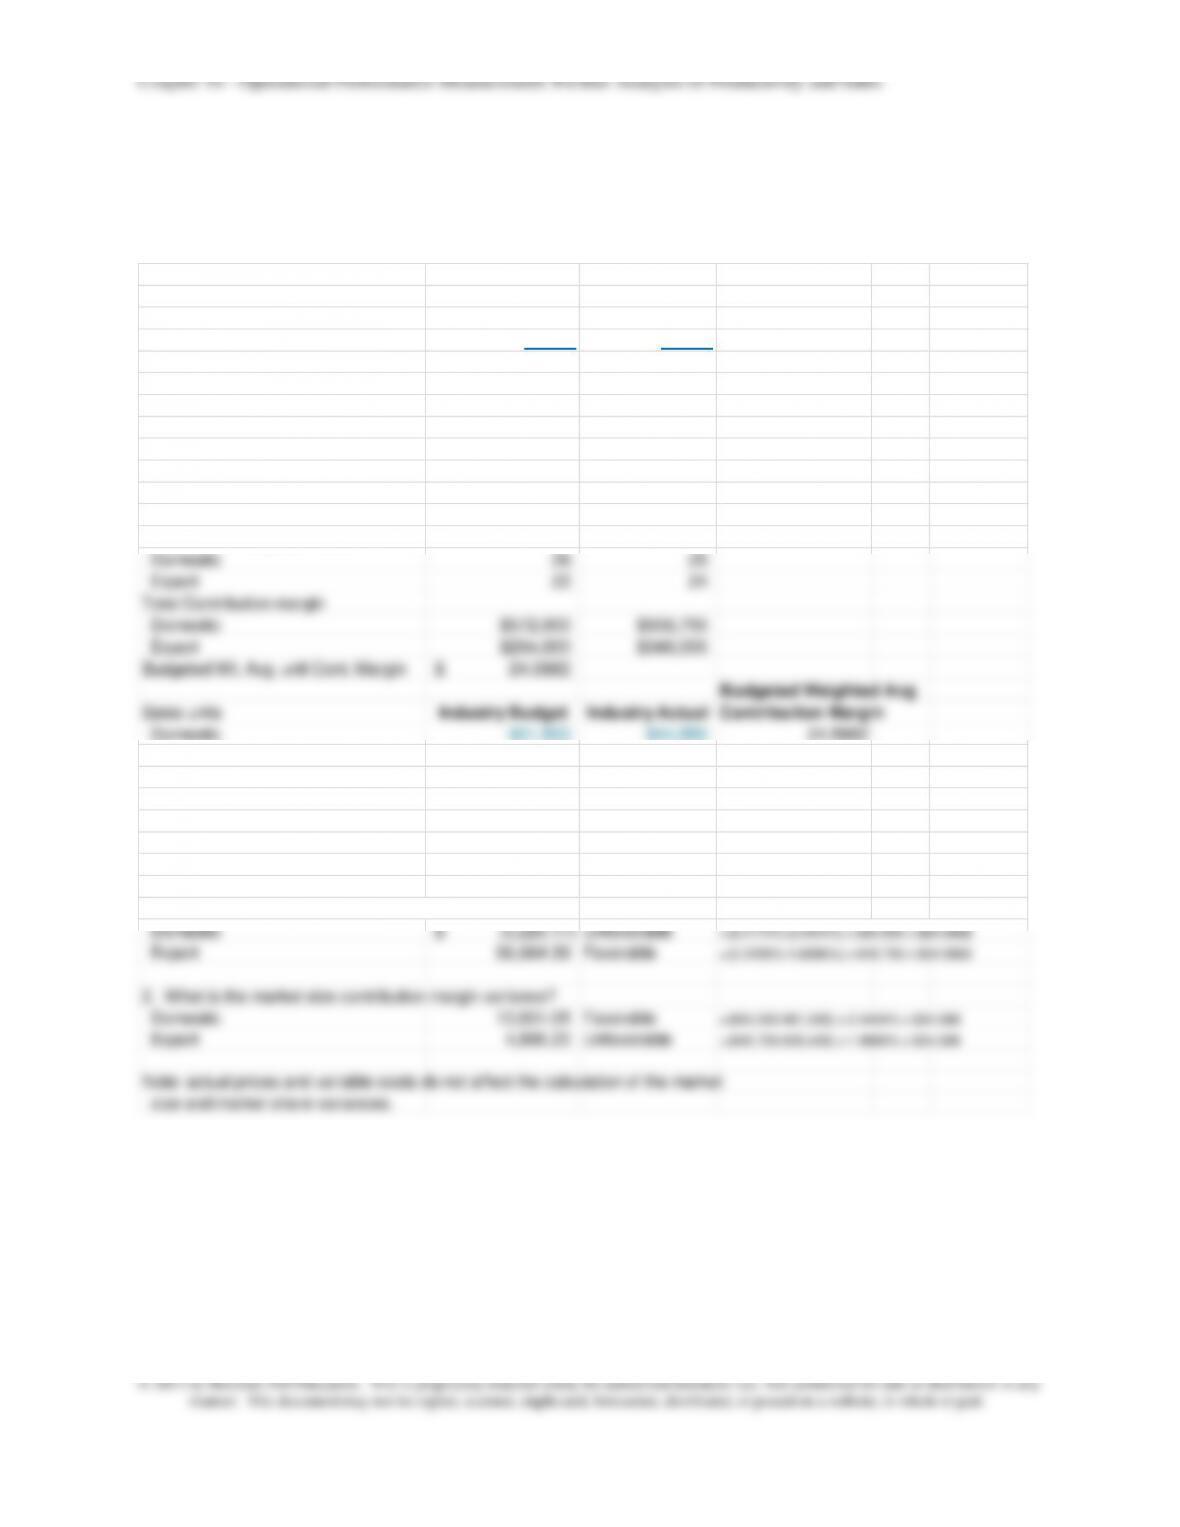
The spreadsheet solution for 16-54 is shown below
Budgeted
Budget Actual Wt Avg CM
Sales units
Welcome Signs 50 45
Birdhouses 25 35
Total 75 80
Total Contribution margin
Welcome Signs $110.00 $95.00 3.20$
Birdhouses 130.00 150.00
Sales units Industry Budget Industry Actual
Signs 3,000 3,000 per six month period
Birdhouses 200 175 per month
1. Market Share Budgeted Actual
Signs 1.6667% 1.50%
Birdhouses 12.50% 20.00%
2. What is the market share contribution margin variance?
Signs (16.00)$ Unfavorable
Birdhouses 42.00 Favorable
3. What is the market size contribution margin variance?
Signs –
Birdhouses (10.00) Unfavorable
16–52
16-55 Market Size and Market Share Variances; Foreign Currency
Fluctuations (20 min)
1.,2.
Budget Actual
Sales units (cases)
Domestic 22,000 22,350
Export 12,000 14,500
Total 34,000 36,850
Price per case
Domestic 88$ 87$
Export 90 92
Variable Cost per case
Domestic 62 62
Export 68 68
Contribution Margin per case
Domestic 26 25
Export 22 24
Total Contribution margin
Domestic $572,000 $558,750
Export $264,000 $348,000
Budgeted Wt. Avg. unit Cont. Margin 24.5882$
Budgeted Weighted Avg
Sales units Industry Budget Industry Actual Contribution Margin
Domestic 901,500 924,550 24.5882
Export 635,400 645,750
Currency: $/Euro 1.29$ 1.42$
Market Share Budgeted Actual
Domestic 2.4404% 2.4174%
Export 1.8886% 2.2455%
1. What is the market share contribution margin variance?
Domestic (5,225.17)$ Unfavorable =(2.4174%-2.4404%) x 924,550 x $24.5882
Export 56,664.39 Favorable =(2.2455%-1.8886%) x 645,750 x $24.5882
Chapter 16 – Operational Performance Measurement: Further Analysis of Productivity and Sales
16–53
16–55 (continued –1)
3.
The unfavorable market share for the domestic market reflects the decline in
the company’s sales as the market increased; the unfavorable domestic
market share variance of $5,225 is more than offset by the favorable market
size variance of $13,831.
The very large favorable market share variance of $56,664 for the export
market reflects the large increase in exports due at least in part to the falling
able to retain some of its new foreign customers.
16–54
16-56 Comparative Income Statements and Sales Performance
Variances; Current to Prior Year (35 min)
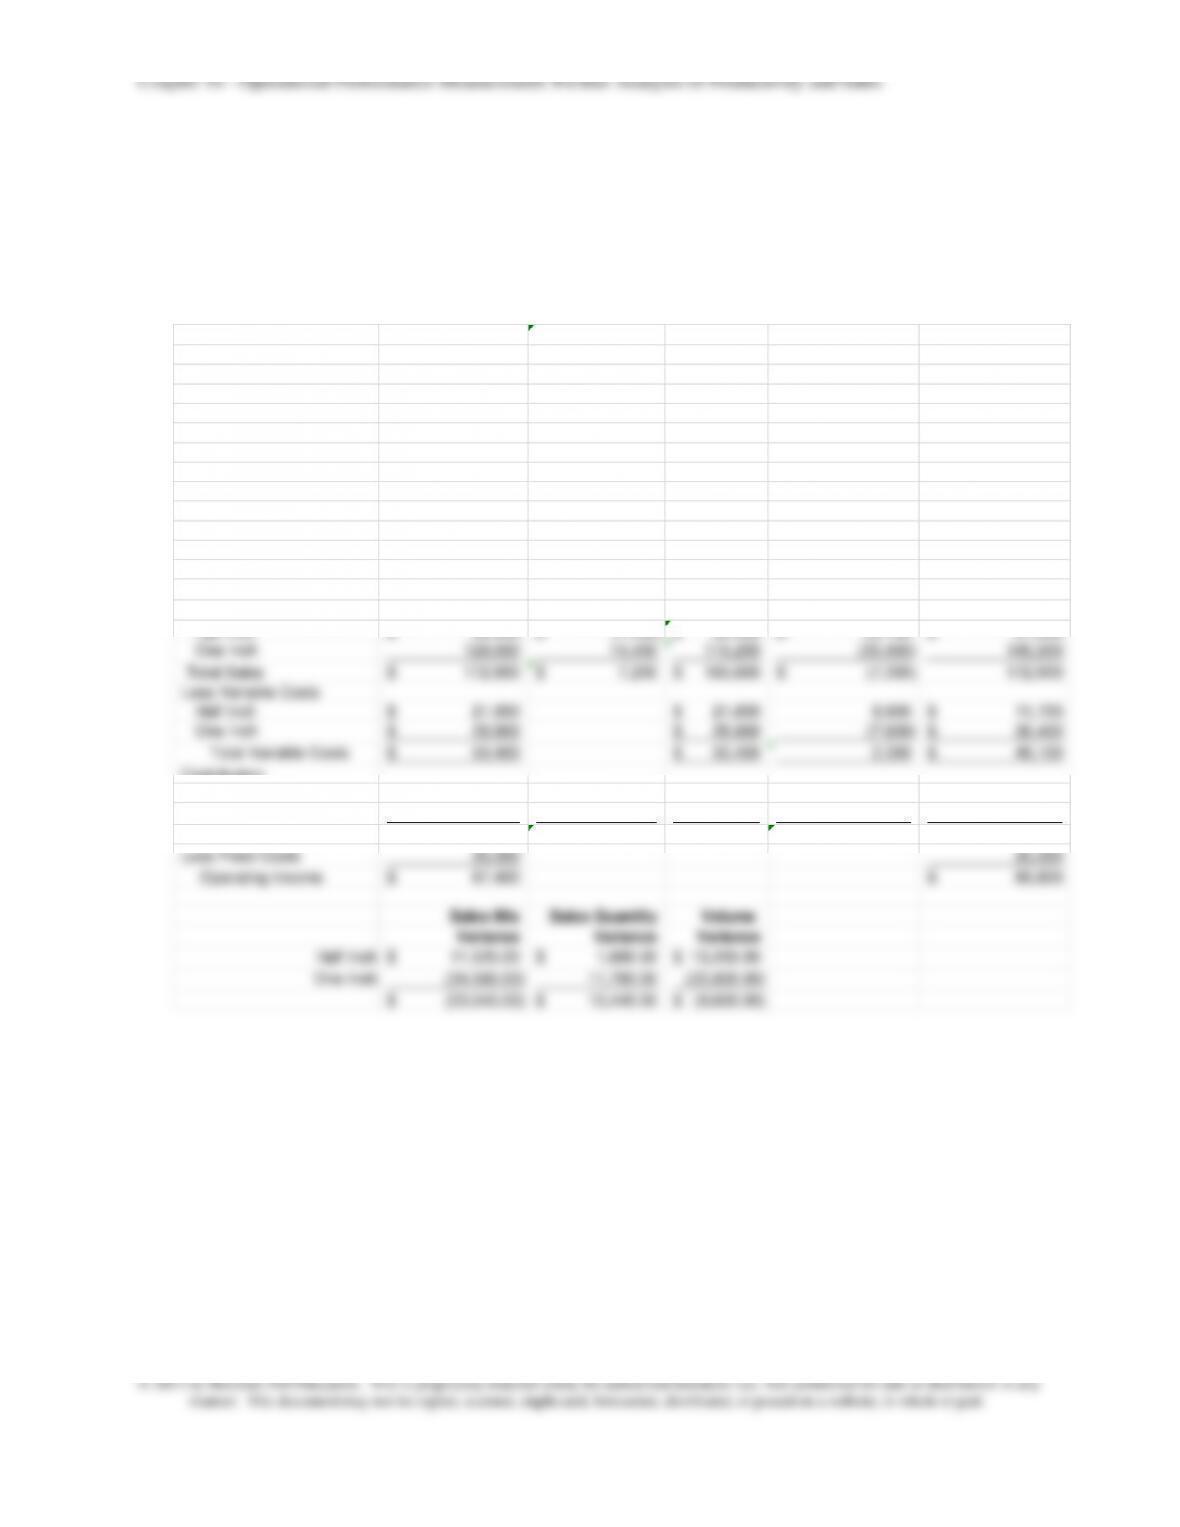
1. Comparative Income Statement for 2013 based on the flexible
budget (Exhibit 16.15)
2013 2012
Sales Units 7,200 6,500
Sales Mix for each Product
Half Inch 50% 30%
One Inch 50% 70%
Price
Half Inch 12.00$ 14.00$
One Inch 36.00$ 32.00$
Variable Cost per Unit
Half Inch 6.00$ 6.00$
One Inch 8.00$ 8.00$
Fixed cost 35,000$ 35,000$
Sales Price Flexible Sales Volume
Sales January 2013 Variance Budget Variance December 2012
Half Inch 43,200$ (7,200)$ 50,400$ 23,100$ 27,300$
One Inch 129,600 14,400 115,200 (30,400) 145,600
Total Sales 172,800$ 7,200$ 165,600$ (7,300)$ 172,900
Less Variable Costs
Half Inch 21,600$ 21,600$ 9,900 11,700$
One Inch 28,800$ 28,800$ (7,600) 36,400$
Total Variable Costs 50,400$ 50,400$ 2,300 48,100$
Contribution
Half Inch 21,600 (7,200) 28,800 13,200 15,600
One Inch 100,800 14,400 86,400 (22,800) 109,200
Total Contribution 122,400 7,200 115,200 (9,600)$ 124,800
Less Fixed Costs 35,000 35,000
Operating Income 87,400$ 89,800$
Sales Mix Sales Quantity Volume
Variance Variance Variance
Half Inch 11,520.00$ 1,680.00$ 13,200.00$
One Inch (34,560.00) 11,760.00 (22,800.00)
(23,040.00)$ 13,440.00$ (9,600.00)$