Chapter 15 – Operational Performance Measurement: Indirect-Cost Variances and Resource-Capacity Management
15–46
15–43 Income Statement Effects of Alternative Denominator Activity Levels;
Spreadsheet Application (60 minutes)
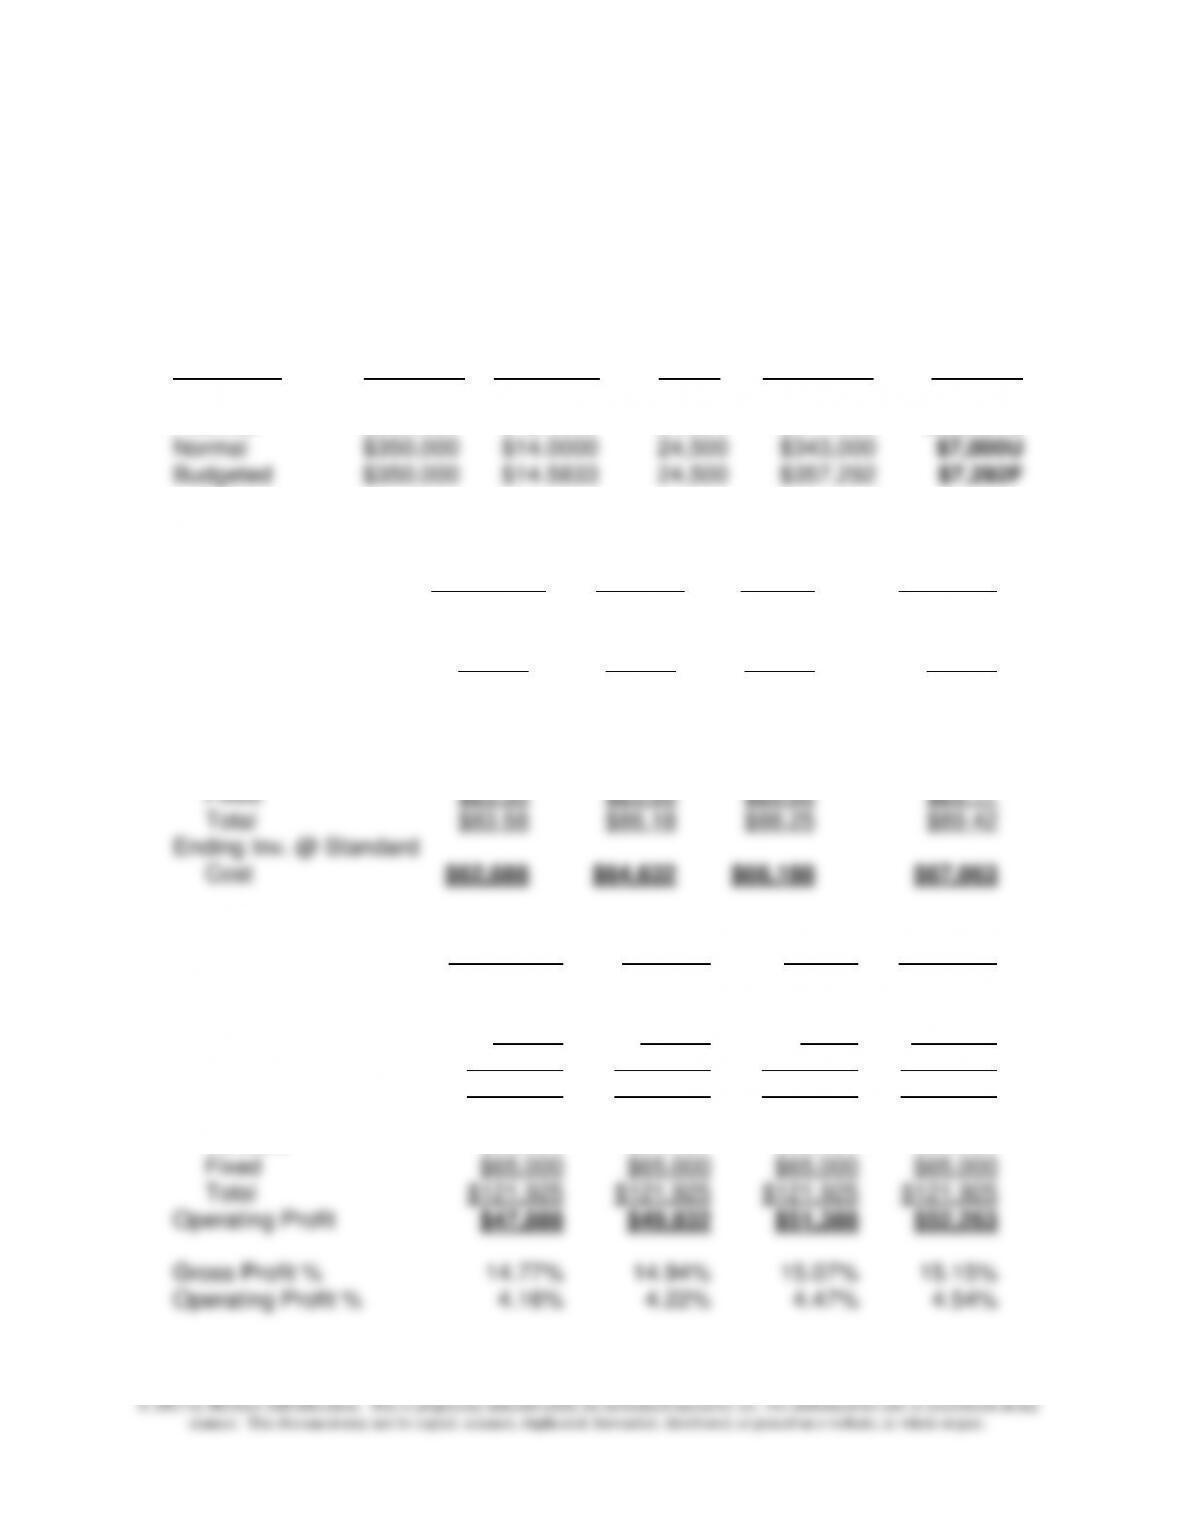
(1) Production Volume Variance:
Budgeted Standard Standard Fixed OVH Production
Fixed Fixed OVH Allowed Applied to Volume
Alternative Overhead Rate/Hour Hours Production Variance
Theoretical $350,000 $11.6667 24,500 $285,833 $64,167U
Practical $350,000 $12.9630 24,500 $317,593 $32,407U
(2) Ending Inventory of Finished Goods:
Theoretical Practical Normal Budgeted
Beg. Inventory 0 0 0 0
Plus: Units Produced 12,250 12,250 12,250 12,250
Less: Units Sold 11,500 11,500 11,500 11,500
Units in Ending Inventory 750 750 750 750
Mfg. Cost/Unit:
Variable $60.25 $60.25 $60.25 $60.25
(3) Profit Reports:
Theoretical Practical Normal Budgeted
Revenues $1,150,000 $1,150,000 $1,150,000 $1,150,000
CGS (@ Standard Cost) $916,021 $945,836 $969,688 $983,104
Plus/Minus Vol. Variance $64,167 $32,407 $7,000 ($7,292)
CGS, Adjusted $980,188 $978,243 $976,688 $975,813
Gross Profit $169,813 $171,757 $173,313 $174,188
Less: Operating Expenses:
Variable $56,925 $56,925 $56,925 $56,925
Chapter 15 – Operational Performance Measurement: Indirect-Cost Variances and Resource-Capacity Management
15–47
15–43 (Continued-1)
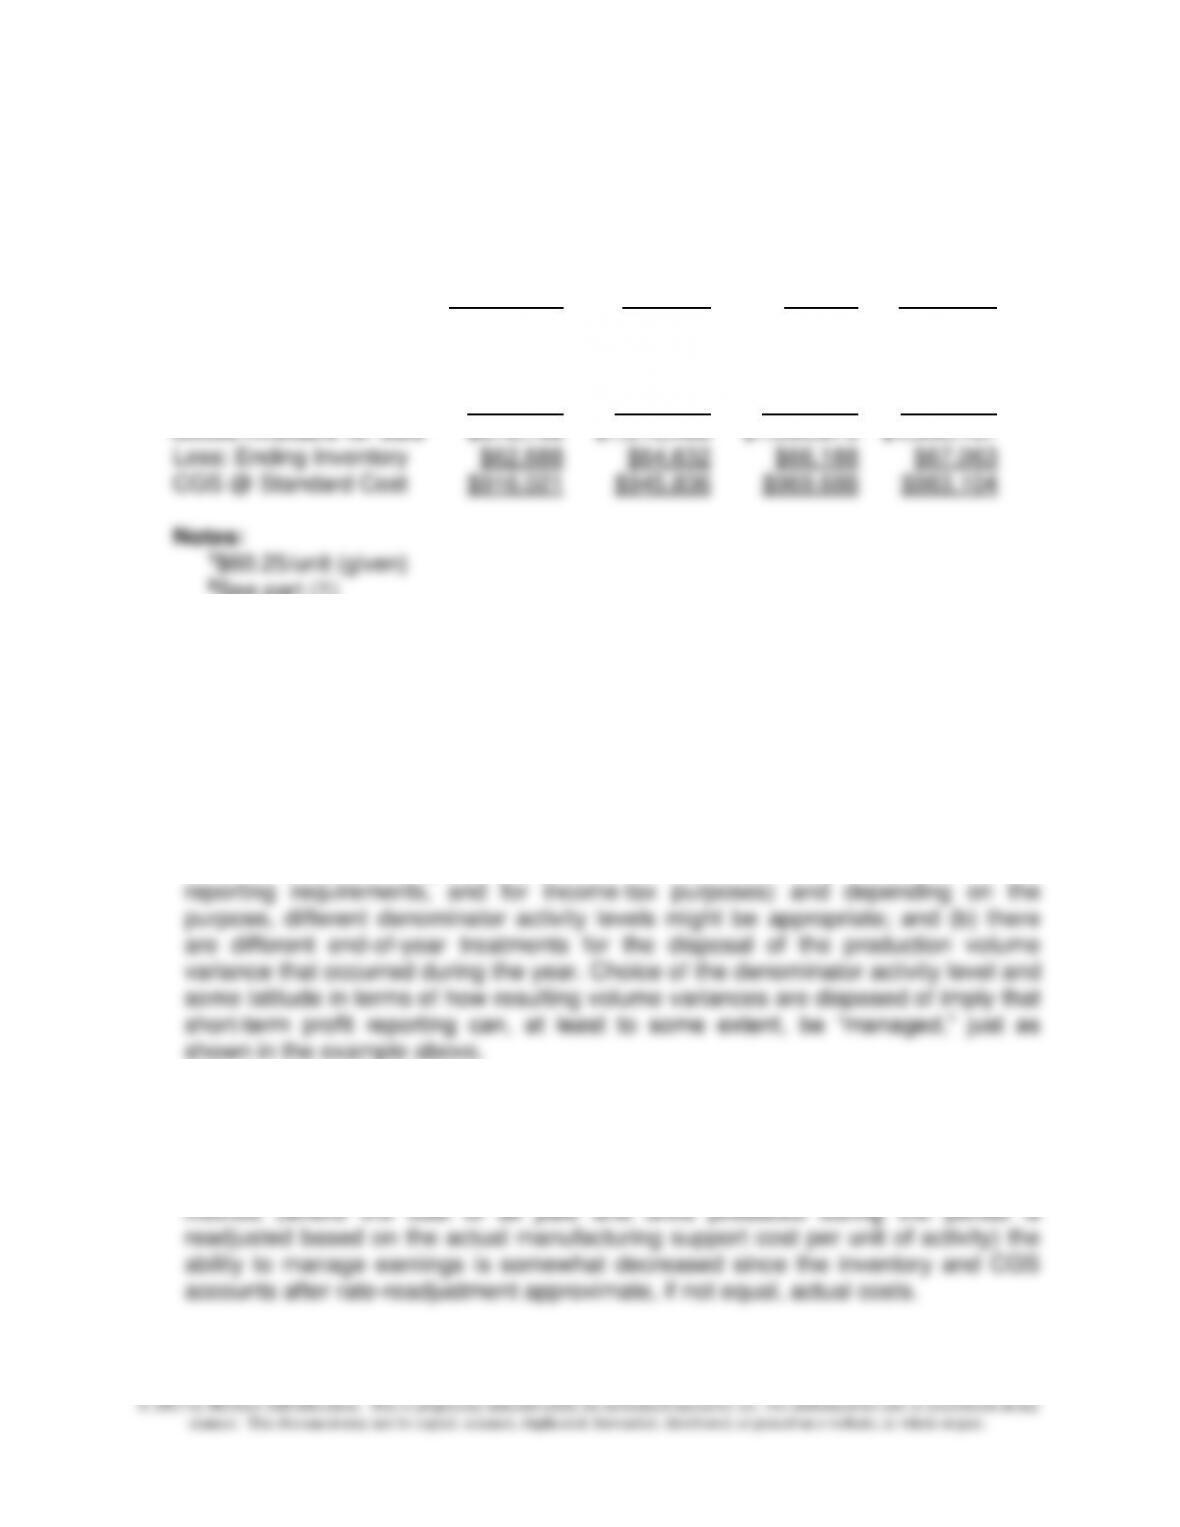
Calculation of Cost of Goods Sold @ Standard Manufacturing Cost:
Theoretical Practical Normal Budgeted
Beginning Inventory $0 $0 $0 $0
Plus: Cost of Goods Manufactured:
Variable Mfg. Costs1 $692,875 $692,875 $692,875 $692,875
Applied Fixed OVH2 $285,833 $317,593 $343,000 $357,292
Goods Available for Sale $978,708 $1,010,468 $1,035,875 $1,050,167
2See part (1)
(4) The primary point of the preceding analysis is that once it is maintained that
products should be costed at full (absorption) cost, there is a need to “unitize”
budgeted fixed overhead (manufacturing support) costs. To do this, the accountant
must assume a level of activity over which the budgeted fixed costs can be spread.
Differences in assumed activity level, as the example above shows, lead to
differences in per-unit manufacturing costs and, in turn, in the amount of the
production volume variance (over- or under-applied budgeted fixed overhead). The
situation is further clouded by two factors: (a) costs are allocated to products for
different purposes (e.g., planning and control, motivation, to meet financial
As a general rule, as stated in the text, we favor the use of “practical capacity” as
the denominator volume used to set the standard fixed overhead allocation rate.
Finally, we note that if either the allocation method or what is called rate-adjustment
Chapter 15 – Operational Performance Measurement: Indirect-Cost Variances and Resource-Capacity Management
15–48
15–43 (Continued-2)
5. Generally accepted accounting principles (GAAP) (FASB ASC 330–10–30-3 to -7,
previously SFAS151—“Inventory Costs: An Amendment of ARB No. 43, Chapter 4,”
and available at www.fasb.org) reaffirms (and brings U.S. reporting standards more in
line with International Accounting Standards in the area) that abnormal amounts of
idle facility expense (as well as abnormal amounts of freight, handling costs, and
spoilage) be written off as a period expense (i.e., as a current-period charge).
Further, GAAP specifies that “normal capacity” be used for establishing fixed
This question allows the instructor to reinforce the “different costs for different
purposes” argument regarding the design of cost-information systems. Students can
also be directed to current federal income tax rules regarding the setting of overhead
cost-allocation rates and the end–of-period disposition of any resulting overhead
variances, including the production volume (“idle capacity”) variance. Guidance in this
regarding is provided in Treasury Reg. §1.471-11 (“Inventories of Manufacturers”).
Note: An Excel spreadsheet solution for this problem is embedded below. You can
open this “object” by doing the following:
1. Right click anywhere in the worksheet area below.
2. Select “worksheet object” and then select “Open.”
3. To return to the Word document, select “File” and then “Close and return
to…” while you are in the spreadsheet mode. The screen should then return
you to this Word document
Pr. 15-43.xlsx
Chapter 15 – Operational Performance Measurement: Indirect-Cost Variances and Resource-Capacity Management
15–49
15–44 Managing Earnings, Denominator Capacity-Level, and Ethics (45-60 Minutes)
1. Predetermined overhead application rates (for both normal cost systems and
standard cost systems) are developed prior to the operating period. These rates are
predetermined in the sense that they rely on two pieces of estimated information.
The estimated variable overhead cost rate per unit of activity can be determined on
the basis of the cost-estimation techniques discussed in Chapter 8. The fixed
component requires an estimate of all capacity-related (i.e., short-term fixed)
manufacturing support costs. These costs provide the capacity or ability to produce,
but are unrelated to actual volume of activity. Estimated fixed overhead costs are
then divided by some denominator activity level (viz., budgeted activity, theoretical
Under an ABC system the process is conceptually the same. The primary difference
is the use under ABC of multiple manufacturing support cost pools, each of which has
its own cost driver. These cost drivers in conventional ABC systems are of the
following variety: unit-level, batch-level, and product-sustaining. Under Time-Driven
ABC (TDABC) each process or department creates its own cost-allocation rate,
based on the amount of time available in that process or department.
For the determination of the fixed overhead component of predetermined overhead
costs in conventional cost systems, and for the determination of cost-allocation rates
under ABC systems (both traditional and Time-Driven), a critical assumption is choice
of the denominator volume level. Since cost-allocation rates are determined using
both a numerator and a denominator value, choice of the denominator volume level
(over which fixed overhead costs are spread) directly affects the predetermined rates.
For financial reporting purposes, GAAP (FASB ASC 330-10–30-3, previously SFAS
151:Inventory Costs—An Amendment of ARB No. 43, Chapter 4, and available at:
www.fasb.org) specifies that normal capacity be used as the denominator volume for
Chapter 15 – Operational Performance Measurement: Indirect-Cost Variances and Resource-Capacity Management
15–50
15–44 (Continued-1)
The Internal Revenue Code (IRC) does not deal directly with the issue of the choice
of the denominator volume level for purposes of allocating indirect manufacturing
costs to inventory. This issue is, however, dealt with in the Treasury Department
Regulations. Reg. §1.263A specifies only that the chosen method “reasonably
allocates indirect costs among production … activities.” Reg. §1.471-11 (“Inventories
The instructor can make the point that we may observe differences across
managerial, tax, and financial-reporting requirements as regards the setting of
predetermined fixed overhead rates. The managerial accountant can add value to
his/her organization by keeping abreast of the differential requirements (or
convergence of these requirements) over time.
2. As noted in the text, there are two basic ways to handle the end–of-period disposition
of standard-cost variances, including those associated with manufacturing overhead.
One approach is to close out the variances to the CGS account. (In effect, this
sold (CGS) accounts.
GAAP (FASB ASC 330-10–30-6 and -7, previously SFAS151—“Inventory Costs: An
Amendment of ARB No. 43, Chapter 4,” and available at www.fasb.org) reaffirms
(and brings U.S. reporting standards more in line with International Accounting
Standards in the area) that abnormal amounts of idle facility expense (as well as
abnormal amounts of freight, handling costs, and spoilage) be written off as a period
expense (i.e., as a current-period charge). Further, GAAP specifies that “normal
capacity” be used for establishing fixed overhead allocation rates and that any
unallocated overhead be recognized as an expense of the period (rather than be
prorated to inventories and CGS). While not stating this explicitly, it appears that
GAAP implies that when normal capacity is used for allocated fixed overhead costs to
product, then any amount of unallocated overhead should be viewed as “abnormal”
and therefore treated as a period cost.
Chapter 15 – Operational Performance Measurement: Indirect-Cost Variances and Resource-Capacity Management
15–51
15–44 (Continued-2)
Current income-tax requirements regarding the end–of-period disposition of overhead
variances is found in Reg. Reg. §1.471-11 (“Inventories of Manufacturers”). This
Regulation stipulates that companies must prorate variances, unless they are
deemed minor in amount. In such a case, as long as a similar treatment is made for
Any resulting fixed overhead variance, when practical capacity is used, can be written
off as a period cost.
3. Our position is that, for internal-reporting purposes, a certain amount of latitude
should be afforded managers in regard to setting fixed overhead rates (specifically,
choice of denominator activity level) and the manner in which standard cost variances
are treated at the end of the year. Thus, one approach to this question is to focus on
Credibility.
Each member (of the profession) has a responsibility to: communicate
information fairly and objectively; and, to disclose all relevant information
that could reasonably be expected to influence an intended user’s
understanding of reports, analyses, or recommendation.
Under this standard, therefore, one might argue that it would be unethical to choose
(or change) the denominator activity level solely to improve reported operating
results, particularly when these results would then be communicated to financial
analysts (i.e., to the “market”). At a minimum, full disclosure would dictate that
reported operating results for the period be accompanied by details regarding the
treatment of fixed overhead costs for product-costing and income-determination
purposes. Further, full disclosure would seem to dictate that management disclose to
readers both alternatives not chosen as well as the operating income that would have
been reported under these alternatives.
Finally, students might note that the standard of “competence” applies to the question
at hand. Part of this Standard states that IMA members are expected “to perform
professional duties in accordance with relevant…technical standards.” At issue is
Chapter 15 – Operational Performance Measurement: Indirect-Cost Variances and Resource-Capacity Management
15–52
15–45 Research Assignment, Strategy, Resource Capacity Planning; Time-Driven
ABC (50-60 Minutes)
1. A summary, diagrammatic representation of the “closed–loop” management system
proposed by Kaplan and Norton (2008) is provided on page 65 of the article. The five
components of this system are as follows:
1) Stage 1: Developing Strategy—Set Clear Strategic Goals (e.g., “what business are
we in, and why?”, “what are the key issues we face in our business?”, and “How
can we best compete?”
2) Stage 2: Strategy Translation—Development of Specific Objectives and Initiatives
That Will Be Communicated to All Employees (via use of Strategy Maps, Balanced
metrics)
5) Stage 5: Testing and Adapting the Strategy (i.e., assessment of the strategy itself
and, if necessary, revision of the strategy)
In terms of text Chapter 15, we note the relevance of “resource capacity planning,” a
component of Stage 3 of the management system proposed by Kaplan and Norton
(2008).
2. As noted above, planning resource capacity is one of the key elements of Stage 3 of
the management system. As noted on page 72 of the article, the process of planning
resource capacity presumes the existence of a sales forecast and operating plan for
the coming period (generally, a quarter). Either traditional ABC or time-driven ABC
operating results and measures to forecasted/budgeted amounts.
Chapter 15 – Operational Performance Measurement: Indirect-Cost Variances and Resource-Capacity Management
15–53
3. In traditional ABC, resource expenses assigned to activities (e.g., handling a
customer’s order) are determined through employee surveys, time-logs, and
interviews. Activity cost-driver rates for each major activity are then calculated by
15–45 (Continued-1)
dividing budgeted resource expenditures (in the cost pool) by the outputs of each
activity (e.g., number of orders processed). Such systems were therefore subject to
inherent in accuracies. Further, traditional ABC systems are difficult (cumbersome) to
update (e.g., to account for increases in operational efficiencies). These problems,
and others, combined to prevent the successful implementation of traditional ABC
systems by many organizations. In response, Time-Driven ABC (TDABC) has been
b) The capacity (time) required from each department or process to perform the
activity in question (e.g., handling a customer’s order)
As noted on page 72 of the article, time equations from TDABC are used to model
resource consumption of products, services, and customers. Once a sales and
operating plan has been determined, TDABC can be used to forecast resource
requirements needed to support those plans. This forecast can then be used by
management to authorize spending on needed resources: people, equipment, and
other resources.
4. Essentially, Towerton Financial followed the procedure outlined above in (3) to
estimate resource capacity needed to support its sales and operating plan for the
period. First, the company broke down its total sales forecast into the four component
revenue sources listed on page 70. It then, for each line of business, estimated the
total volume of support activities (e.g., calls to customer service center) that would be
needed to support forecasted sales. The next step was to convert these demands
Chapter 15 – Operational Performance Measurement: Indirect-Cost Variances and Resource-Capacity Management
15–54
15–46 Research Assignment: Control of Capacity-Related Manufacturing Costs;
Strategy (60-75 Minutes)
This assignment pertains to the following article: K. Snead, D. Stott, and A. Garcia,
“The Causes of Misapplied Capacity-Related Manufacturing Costs and Corresponding
Reporting Implications: A Conceptual Perspective,” Journal of Accounting Education,
Vol. 28 (2010), pp. 85-102.
1. In general, how does this article relate to the material covered in Chapter 15?
A major theme in chapter 15 is the determination and interpretation of end–of-period
standard cost variances for indirect manufacturing costs (i.e., manufacturing
overhead). As indicated in the chapter, the total fixed overhead variance for a given
period can be broken down into a fixed overhead spending variance and a fixed
content for management. As such, the article can be viewed as a refinement to the
basic approach reported in popular cost accounting textbooks, including the Blocher
et al. (2013) text.
2. What do the authors of this article mean when they use the term “misapplied capacity
costs”?
As indicated in the Abstract to Snead et al. (2010), the authors use the term
“misapplied capacity costs” to refer to over/under-absorbed budgeted fixed overhead
identical). As to this second point, this means that the total overhead variance for the
period is equal in amount to the production volume variance.
3. Into what three components do the authors feel the production volume variance
should be decomposed? How are each of the three component variances calculated?
Chapter 15 – Operational Performance Measurement: Indirect-Cost Variances and Resource-Capacity Management
15–55
15-46 (Continued-1)
The authors propose that for management decision-making and control purposes that
the total production volume variance be partitioned into a portion related to capacity
that is not planned to be used, capacity that is currently unused but planned to be
used in the longer term (i.e., for future growth), and capacity that is currently unused
during a period. Note that EAC represents the annualized (mean) of each year’s four
EQC levels.
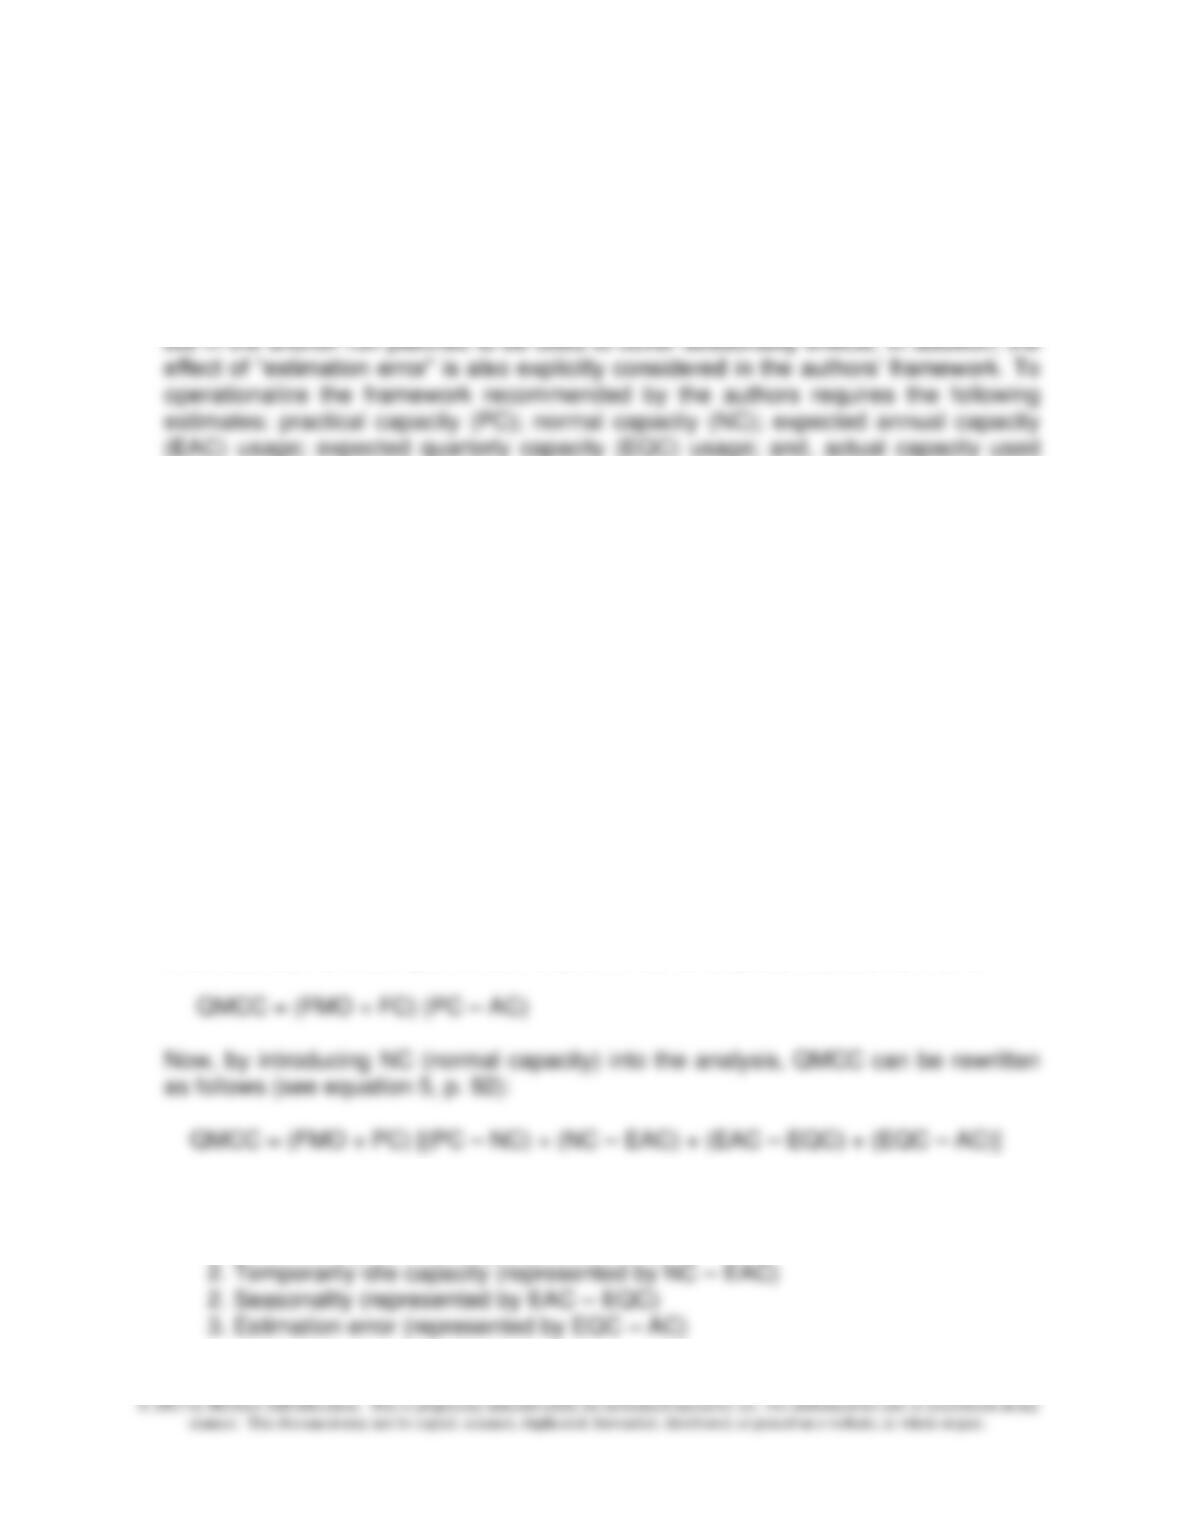
In a single-year timeframe, quarterly misapplied overhead cost for each quarter
(QMCC) is given by equation (3), p. 91, as follows:
QMCC = (FMO/FC) (PC – AC)
where FMO = budgeted fixed overhead for the year. QMCC can be partitioned into
the following components:
1. Idle capacity (represented by PC – EAC)
2. Seasonality (represented by EAC – EQC)
3. Estimation error (represented by EQC – AC)
In a multi-year timeframe, the preceding formula is expanded in order to capture
expected annually increasing use of capacity due to anticipated growth in demand.
As before, the analysis is presented on a quarterly basis so that quarterly misapplied
overhead cost for each quarter (QMCC) is the same as presented above, that is:
Next, QMCC be partitioned as follows:
1. Permanently idle capacity (represented by PC – NC)
Chapter 15 – Operational Performance Measurement: Indirect-Cost Variances and Resource-Capacity Management
15–56
15-46 (Continued-2)
4. According to the authors, what is the connection between the variance-decomposition
model they are proposing and the managerial control of capacity-related costs?
As seen in Chapter 14 (in the discussion of variances associated with variable costs),
partitioning a total variance into its constituent parts provides deeper understanding
regarding the source/cause of the variance. In terms of the production volume
volume variance would allow managers to better manage the demand for and supply
of capacity.
5. What do the authors of this article indicate are the financial-reporting consequences
of their proposed reporting framework?
One important implication for financial-reporting purposes pertains to end–of-period
disposition of standard cost variances, particularly the portion of the production
volume variance related to seasonality and the portion related to anticipated growth.
Specifically, the authors argue that one possibility is the use of “deferred capacity
costs” on the balance sheet, something not currently done in practice but otherwise
consistent with the treatment for deferred assets that may arise in the accounting for
be reexamined.
Finally, as noted by the authors (p. 100), the proposal to allow deferral of certain
unabsorbed fixed overhead costs to future periods coupled with engineering-based
estimates of capacity (viz., the use of practical capacity, PC), rather than marked–
based (and therefore more easily verifiable estimates) could increase the incidence of
earnings management.
Chapter 15 – Operational Performance Measurement: Indirect-Cost Variances and Resource-Capacity Management
15–57
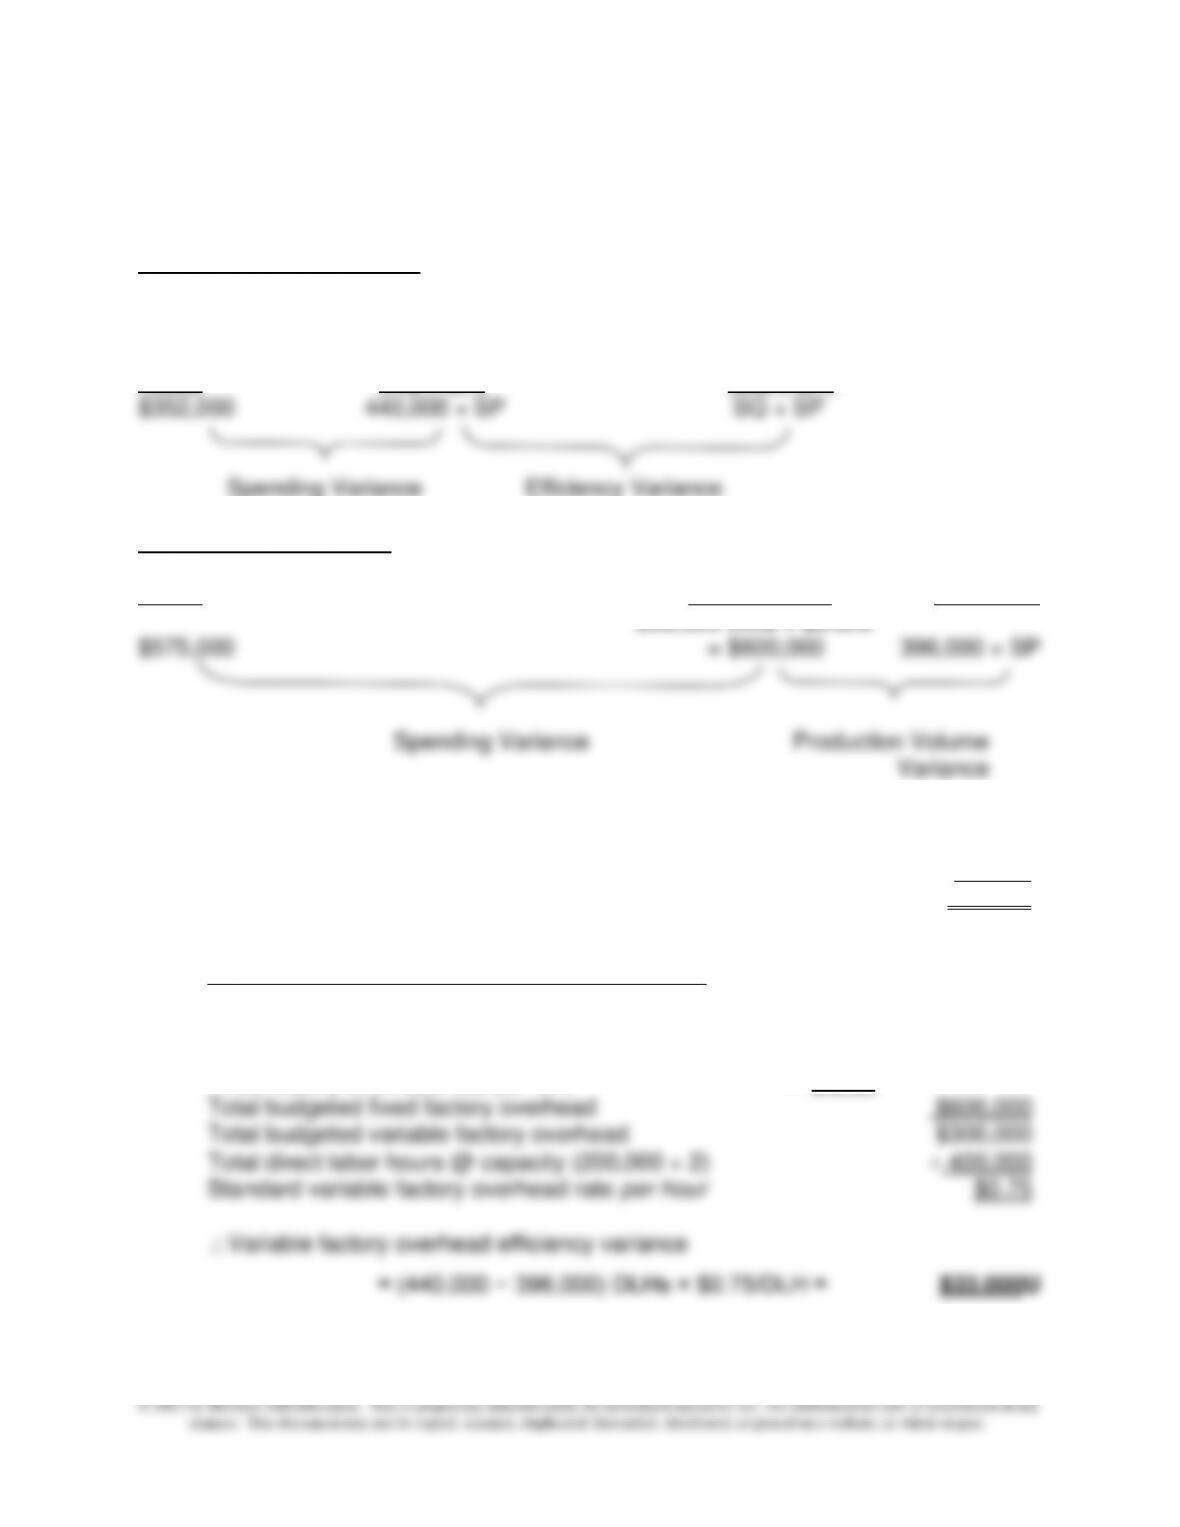
15–47 Four-Variance Analysis of Total Overhead Variance (60-75 minutes)
Variable factory overhead
Flexible Budget (FB) based FB Based on Output
on Inputs (i.e., hrs. worked) (i.e., allowed hours)
Actual (AQ × SP) (SQ × SP)
Fixed factory overhead
Budget Applied
Actual (“Lump–Sum”) (SQ × SP)
200,000 units × $3/unit
1.
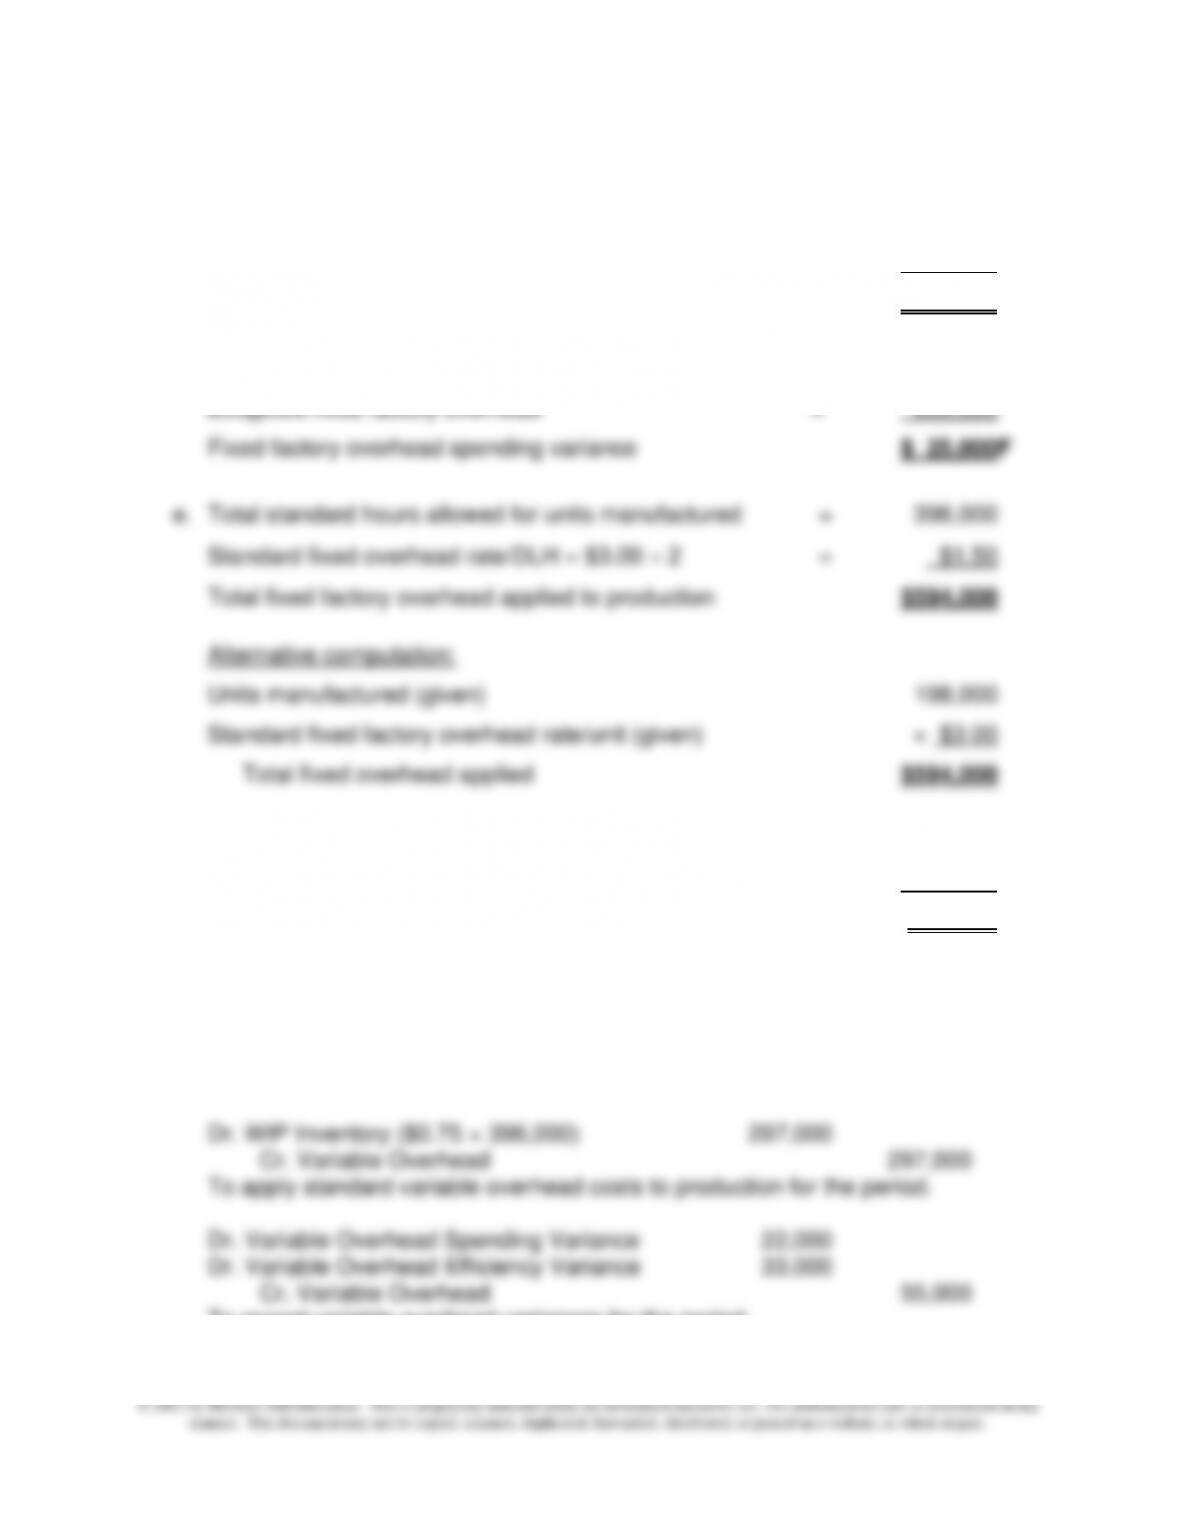
a. Total units manufactured 198,000
Standard hours allowed per unit manufactured × 2
Total standard hours for the units manufactured 396,000
b. Standard variable factory overhead rate per hour
Total budgeted factory overhead $900,000
Denominator activity (capacity level) 200,000
Fixed factory overhead rate per unit × $ 3.00
Chapter 15 – Operational Performance Measurement: Indirect-Cost Variances and Resource-Capacity Management
15–58
15–47 (Continued-1)
c. Variable factory overhead incurred (given) = $352,000
FB based on Inputs = 440,000 DLHs × $0.75/DLH = 330,000
Variable overhead spending variance $ 22,000U
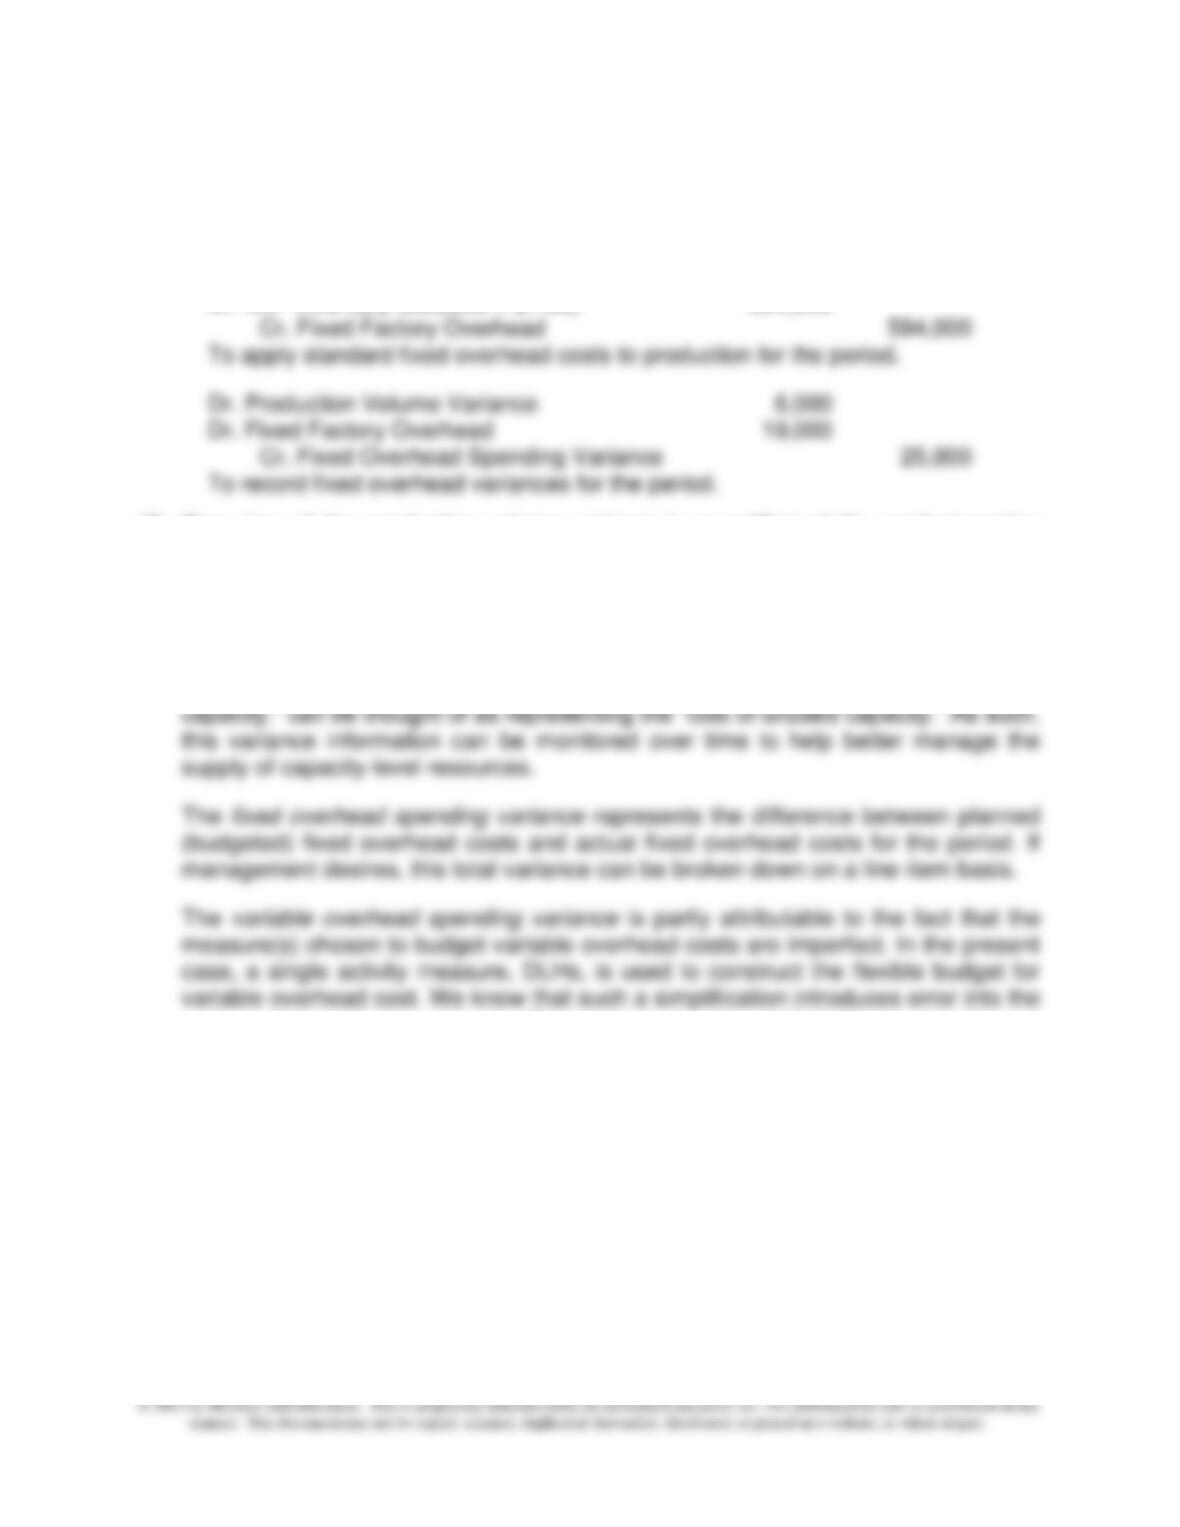
d. Fixed factory overhead incurred (given) = $575,000
f. Total budgeted fixed factory overhead $600,000
Total applied fixed factory overhead $594,000
Fixed factory overhead production volume variance $ 6,000U
(2) Journal entries:
Dr. Variable Overhead 352,000
Cr. Accounts payable, etc. 352,000
To record actual variable overhead costs for the period.
To record variable overhead variances for the period.
Chapter 15 – Operational Performance Measurement: Indirect-Cost Variances and Resource-Capacity Management
15–59
15–47 (Continued-2)
Dr. Fixed Factory Overhead 575,000
Cr. Accumulated depreciation, etc. 575,000
To record actual fixed overhead costs for the period.
Dr. WIP Inventory (396,000 × $1.50) 594,000
(3) One view of the production volume variance is an artifact of the product-costing
purpose of standard costing. To “unitize” budgeted fixed overhead for product–
costing purposes, a “denominator activity level” must be chosen over which the
budgeted fixed overhead costs can be spread. If the actual level of activity differs
from the level chosen to establish the fixed overhead application rate, a production
volume variance will occur. From a cost-control standpoint, the production volume
variance, particularly when the denominator activity level is defined as “practical
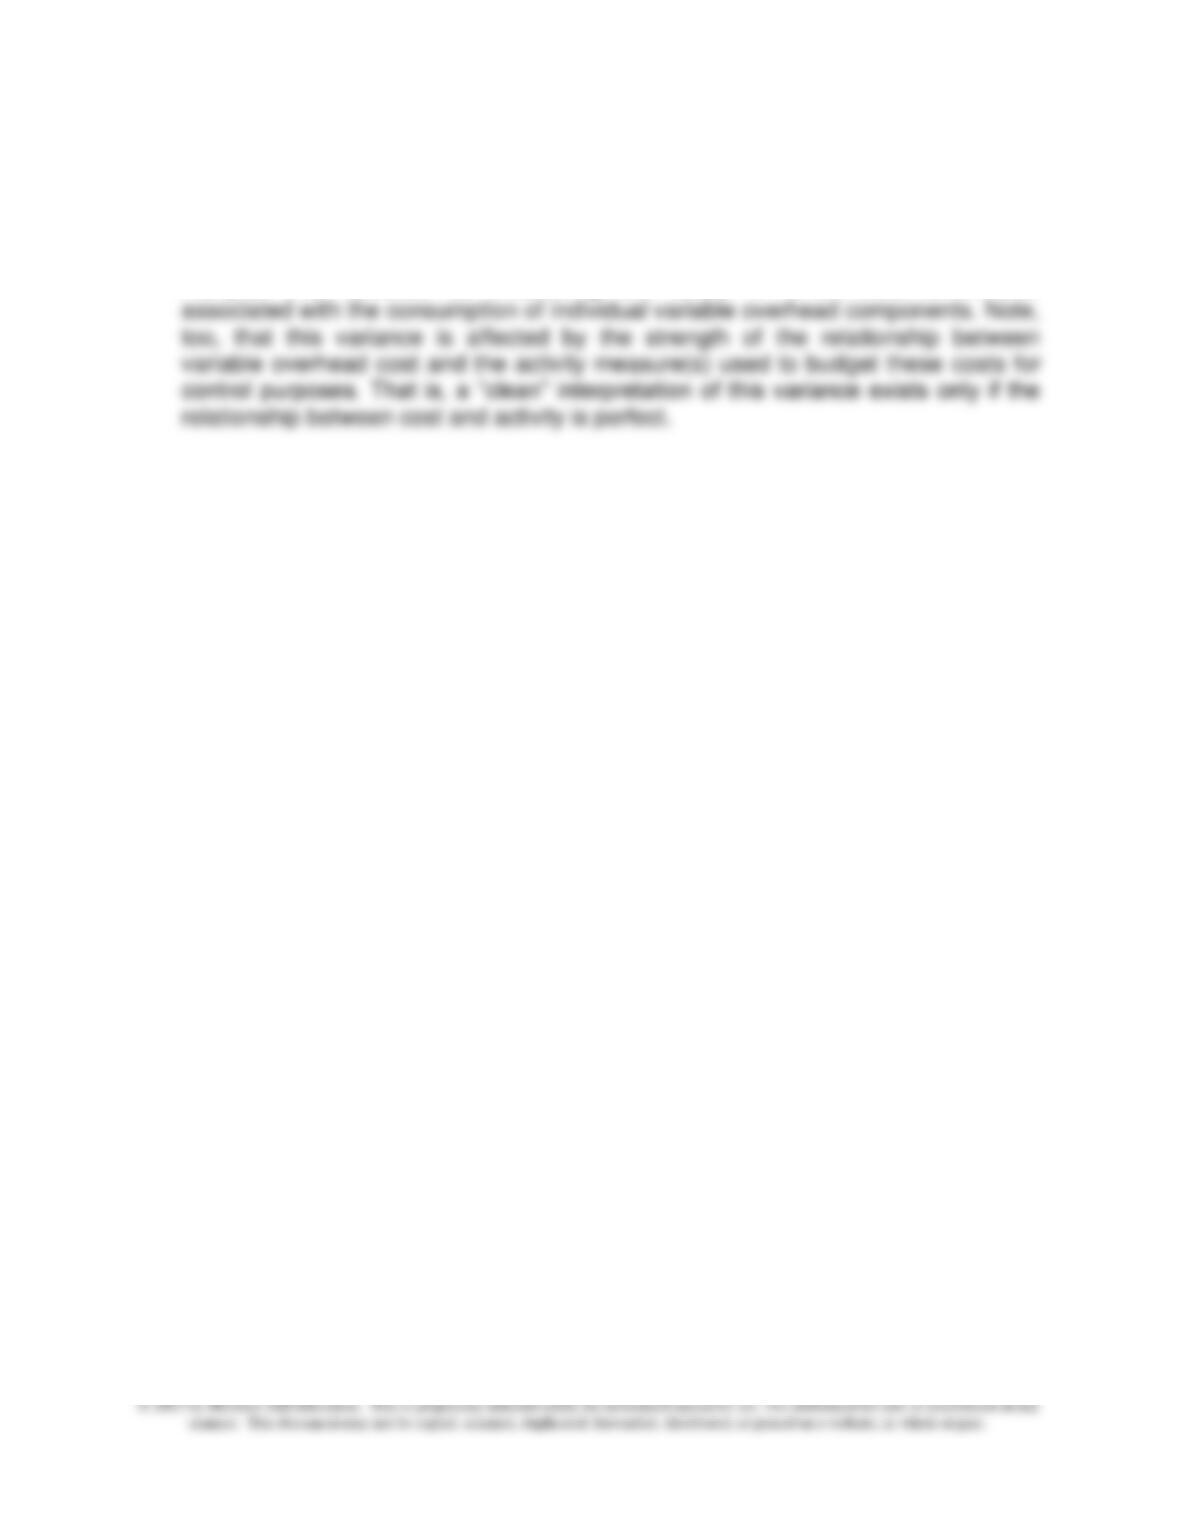
variance-determination process. This variance is also attributable to spending on
overhead items being different from expectations. These variances (e.g., spending
on electricity) can theoretically be decomposed into price and quantity components,
much the same as we did in chapter 14 for direct manufacturing costs.
Chapter 15 – Operational Performance Measurement: Indirect-Cost Variances and Resource-Capacity Management
15–60
15–47 (Continued-3)
The variable overhead efficiency variance refers to the impact of manufacturing
overhead of efficiency or inefficiency in the use of the activity measure(s) used to
construct the flexible-budget for variable overhead. It is a misnomer, therefore, to
interpret this variance as measuring the effect of efficiencies/inefficiencies