Chapter 13 – Cost Planning for the Product Life Cycle: Target Costing, Theory of Constraints, and Strategic Pricing
13–31
© 2013 by McGraw-Hill Education. This is proprietary material solely for authorized instructor use. Not authorized for sale or distribution in any
manner. This document may not be copied, scanned, duplicated, forwarded, distributed, or posted on a website, in whole or part.
a small amount of product inventory so that the unmet demand of product,
at times (as for tables in this case) can be sold from inventory.
13-46 Theory of Constraints (30 min)
With the information available Don can complete the first two steps of
TOC as shown below. The analysis shows that the reactor process is
the constraint, and that in the short run, Polymer 1 is the most
profitable product. The most profitable product mix is 60 units of
Polymer 1 and 35 units Polymer 2. Until the production delays can
be dealt with (TOC steps 3-5), Don should advise CPC to meet all the
only speculate about what these steps might be.
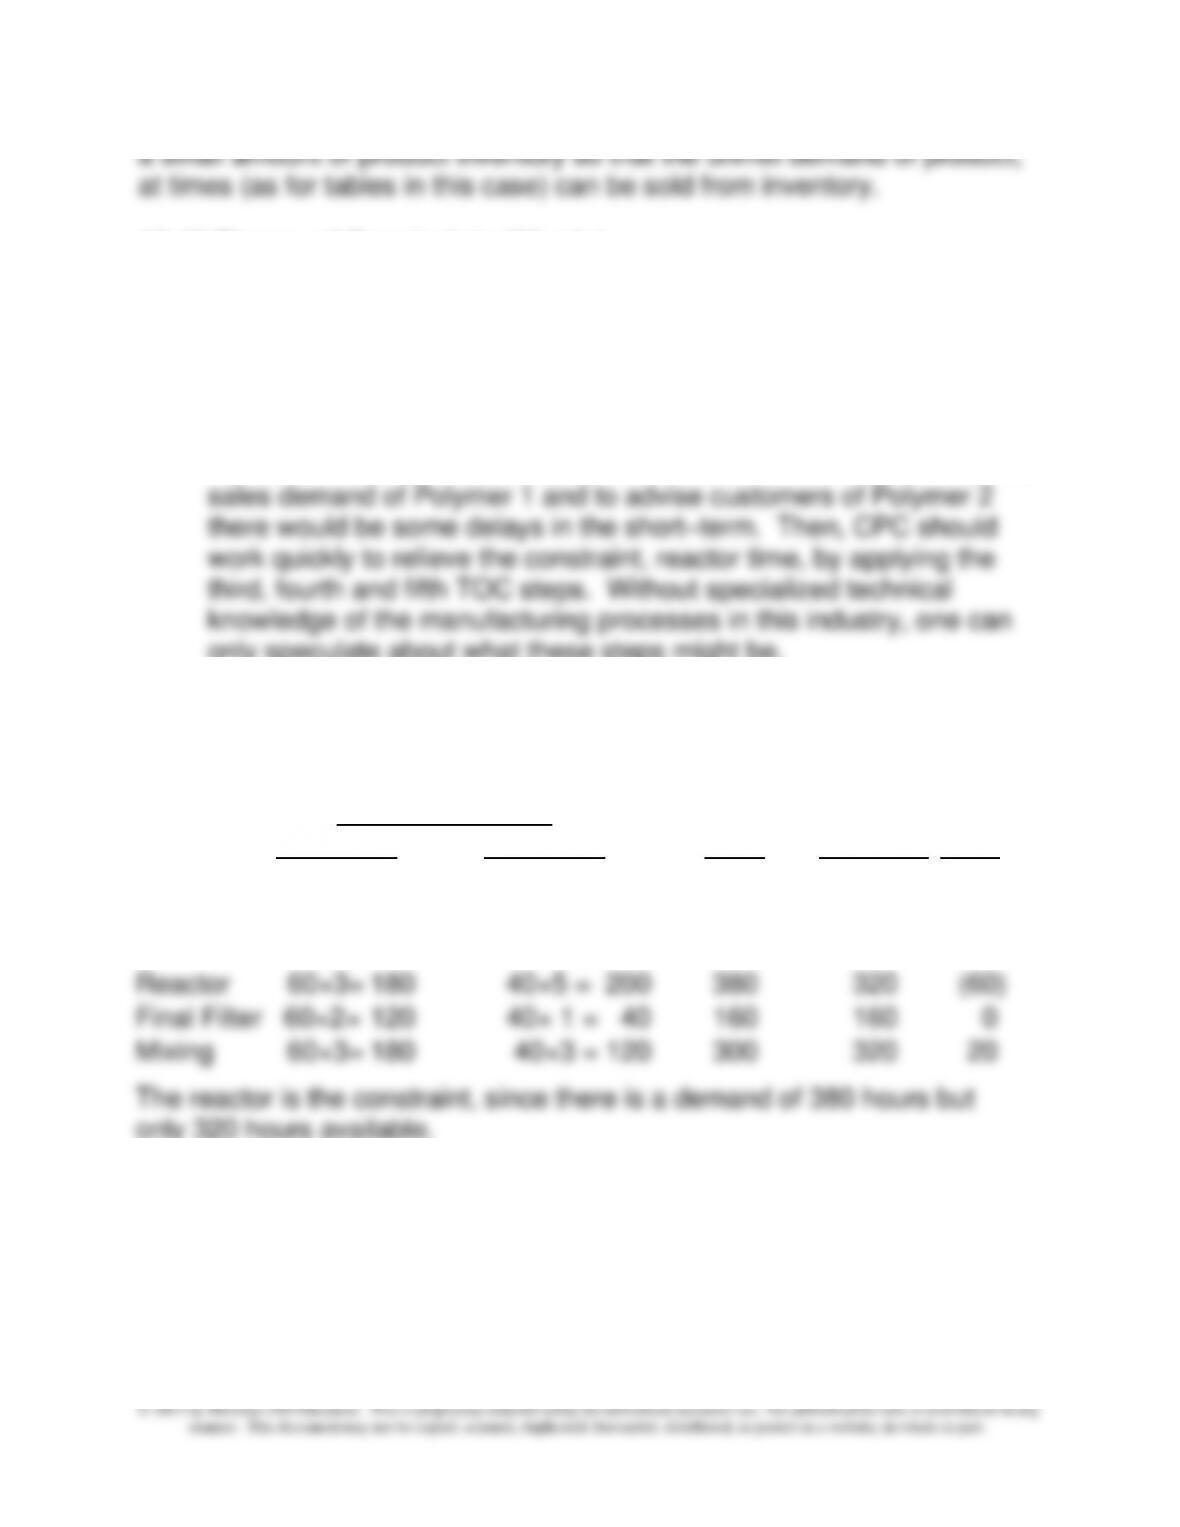
First: Identify the Constraint
Total Time Required for Each activity for Given Demand
Time Required for
Total
Time
Slack
Polymer 1
Polymer 2
Time
Available
Time
Filtering
60×2=
120
40×(2+2)= 160
280
320
40
Stripper
60×(1+1)
=
120
40×(2+1)= 120
240
320
80
Reactor
60×3=
180
40×5 = 200
380
320
(60)
Final Filter 60×2=
120
40× 1 = 40
160
160
0
Mixing
60×3=
180
40×3 = 120
300
320
20
The reactor is the constraint, since there is a demand of 380 hours but
only 320 hours available.
Chapter 13 – Cost Planning for the Product Life Cycle: Target Costing, Theory of Constraints, and Strategic Pricing
13–32
13–46 (continued)
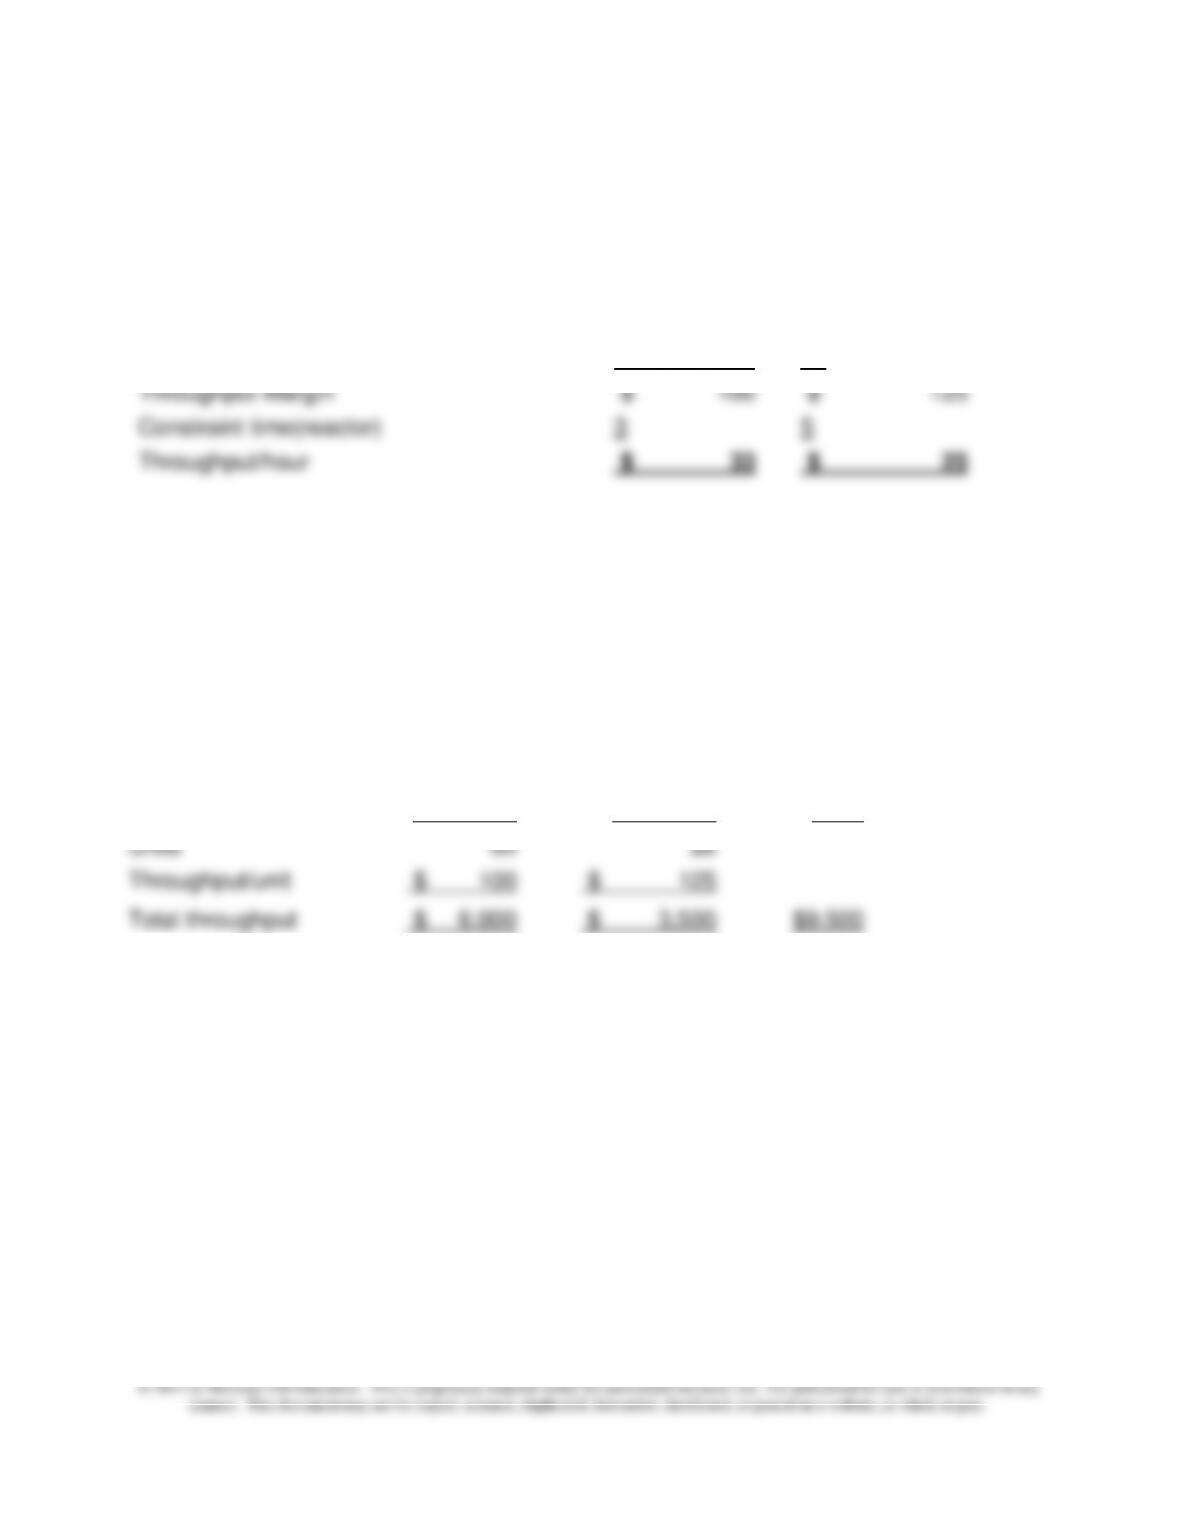
Third: Identify the most profitable product mix
Since Polymer 1 is the most profitable product, its total demand of 60 is
filled first. The remaining time on the reactor is used to complete as many
units of Polymer 2 as possible:
Capacity of reactor available for Polymer 2 = 320 – (60 × 3) = 140
140÷5 = 28 units of Polymer 2
Polymer 1
Polymer 2
Total
Units
60
28
Throughput/unit
$ 100
$ 125
Total throughput
$ 6,000
$ 3,500
$9,500
Second: Identify the most profitable product
Polymer 1
Polymer 2
Price
$ 145
$ 185
Materials Cost
45
60
Throughput Margin
$ 100
$ 125
Constraint time(reactor)
3
5
Throughput/hour
$ 33
$ 25
13–33
© 2013 by McGraw-Hill Education. This is proprietary material solely for authorized instructor use. Not authorized for sale or distribution in any
manner. This document may not be copied, scanned, duplicated, forwarded, distributed, or posted on a website, in whole or part.
13-47 Theory of Constraints for a Restaurant (80 min)
Note: 13-47 is a challenging problem with several difficult steps.
1.
Average
Customer
Average
Number of
Time in
Data
Number of
Customers
Restaurant
Customers/hr
Price
Materials
Cost
per car
(hours)
Bar
24
$ 7.00
$ 1.00
1.5
2
Dining
50
$ 22.00
$ 5.00
3
1
–
–
Time for preparation of each meal
12
min.
Number of meals that can be prepared at one time
20
meals
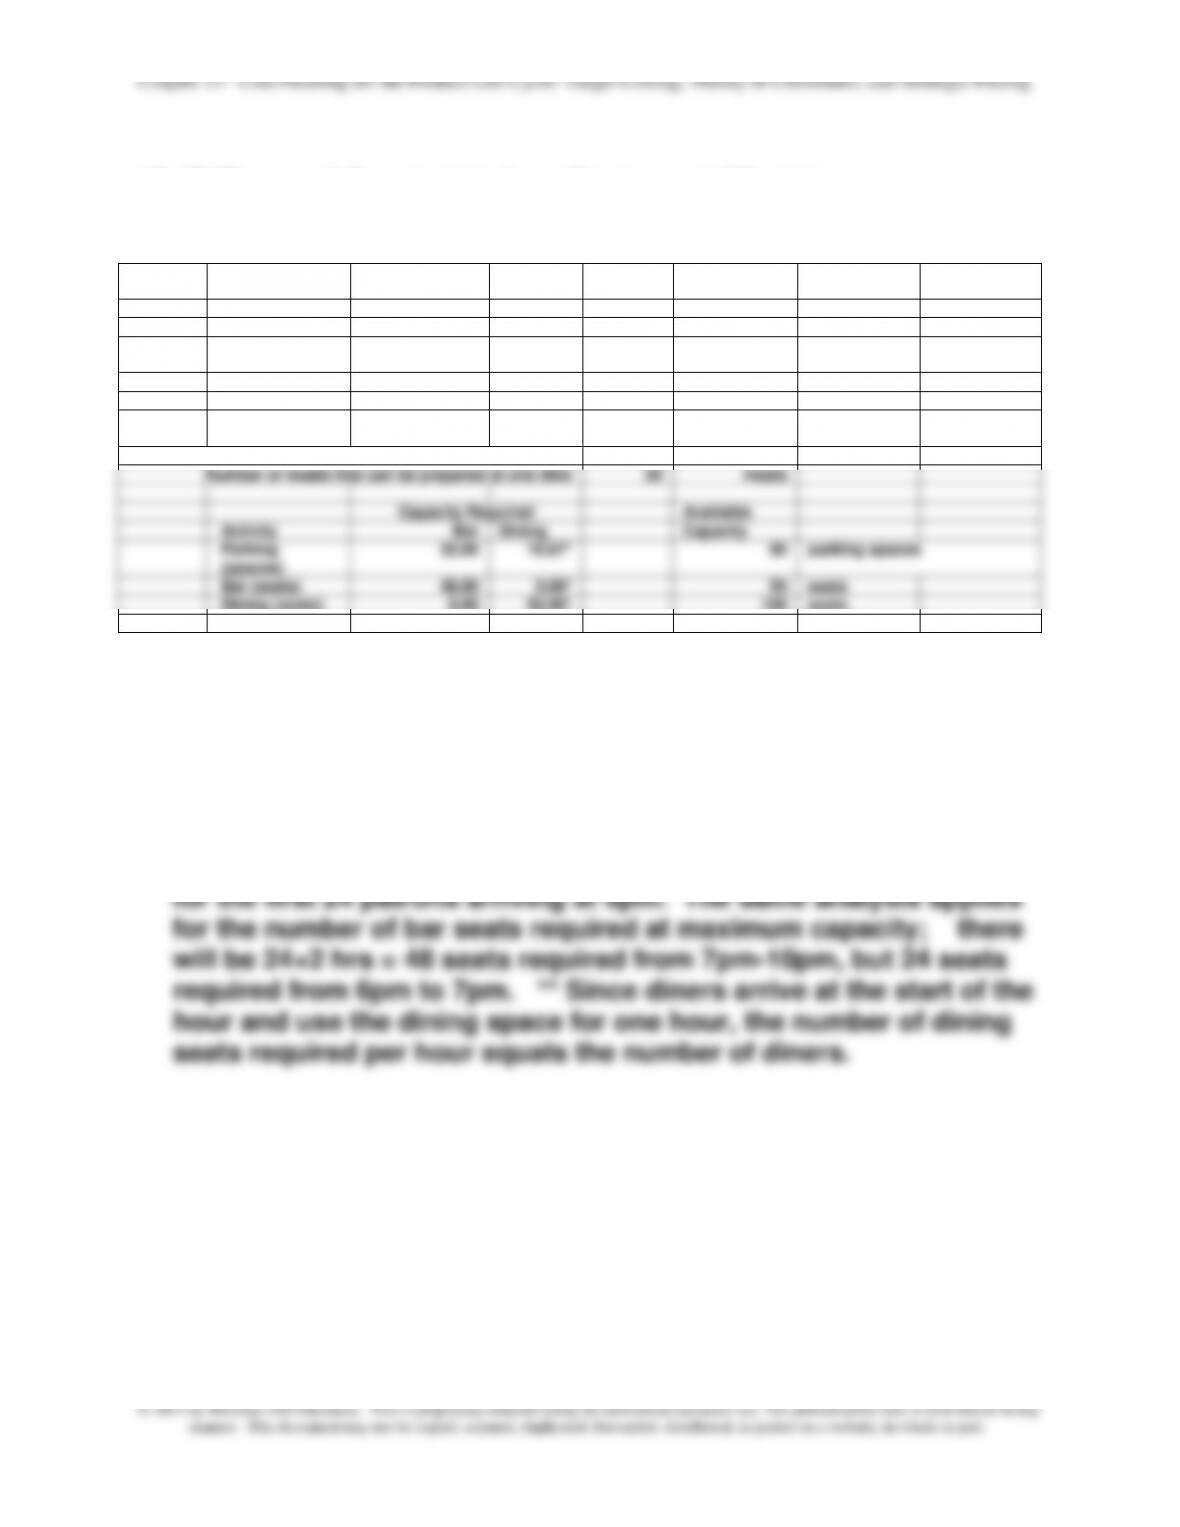
Capacity Required
Available
Activity
Bar
Dining
Capacity
Parking
(spaces)
32.00
16.67*
80
parking spaces
Bar (seats)
48.00
0.00*
54
seats
Dining (seats)
0.00
50.00*
100
seats
Kitchen (meals)
0.00
50.00
100
meals/hr
* Assumes the maximum capacity require in any hour is the case
scenario in which all 24 bar customers arrive at the start of the
hour and stay for 2 hours; those arriving at 9pm (an hour before
closing) will only stay for one hour(and have 2 drinks during this
hour); this means parking receives 24/1.5 = 16 cars per hour; the
patron stays 2 hours, so 16×2=32 parking spaces are required from
7pm-10pm. From 6pm-7pm, only 16 parking spaces are required,
Chapter 13 – Cost Planning for the Product Life Cycle: Target Costing, Theory of Constraints, and Strategic Pricing
13–34
13-47 (continued –1)
Step One: Identify the Constraint
Total Time Required for Each activity for Given Demand
Total
Capacity
Capacity
Bar
Dining
Usage/hr
Available
Slack
Parking (spaces)
32.00
17.00
49.00
80
31.0
Bar (seats)
48.00
–
48.00
54
6.0
Dining (seats)
–
50.00
50.00
100
50.0
Kitchen (meals)
–
50.00
50.00
100
50.0
Bar/hr
Dining/hr
Demand
24
50
Price
$ 7.00
$ 22.00
Materials Cost
$ 1.00
$ 5.00
Throughput Margin/hour
$ 6.00
$ 17.00
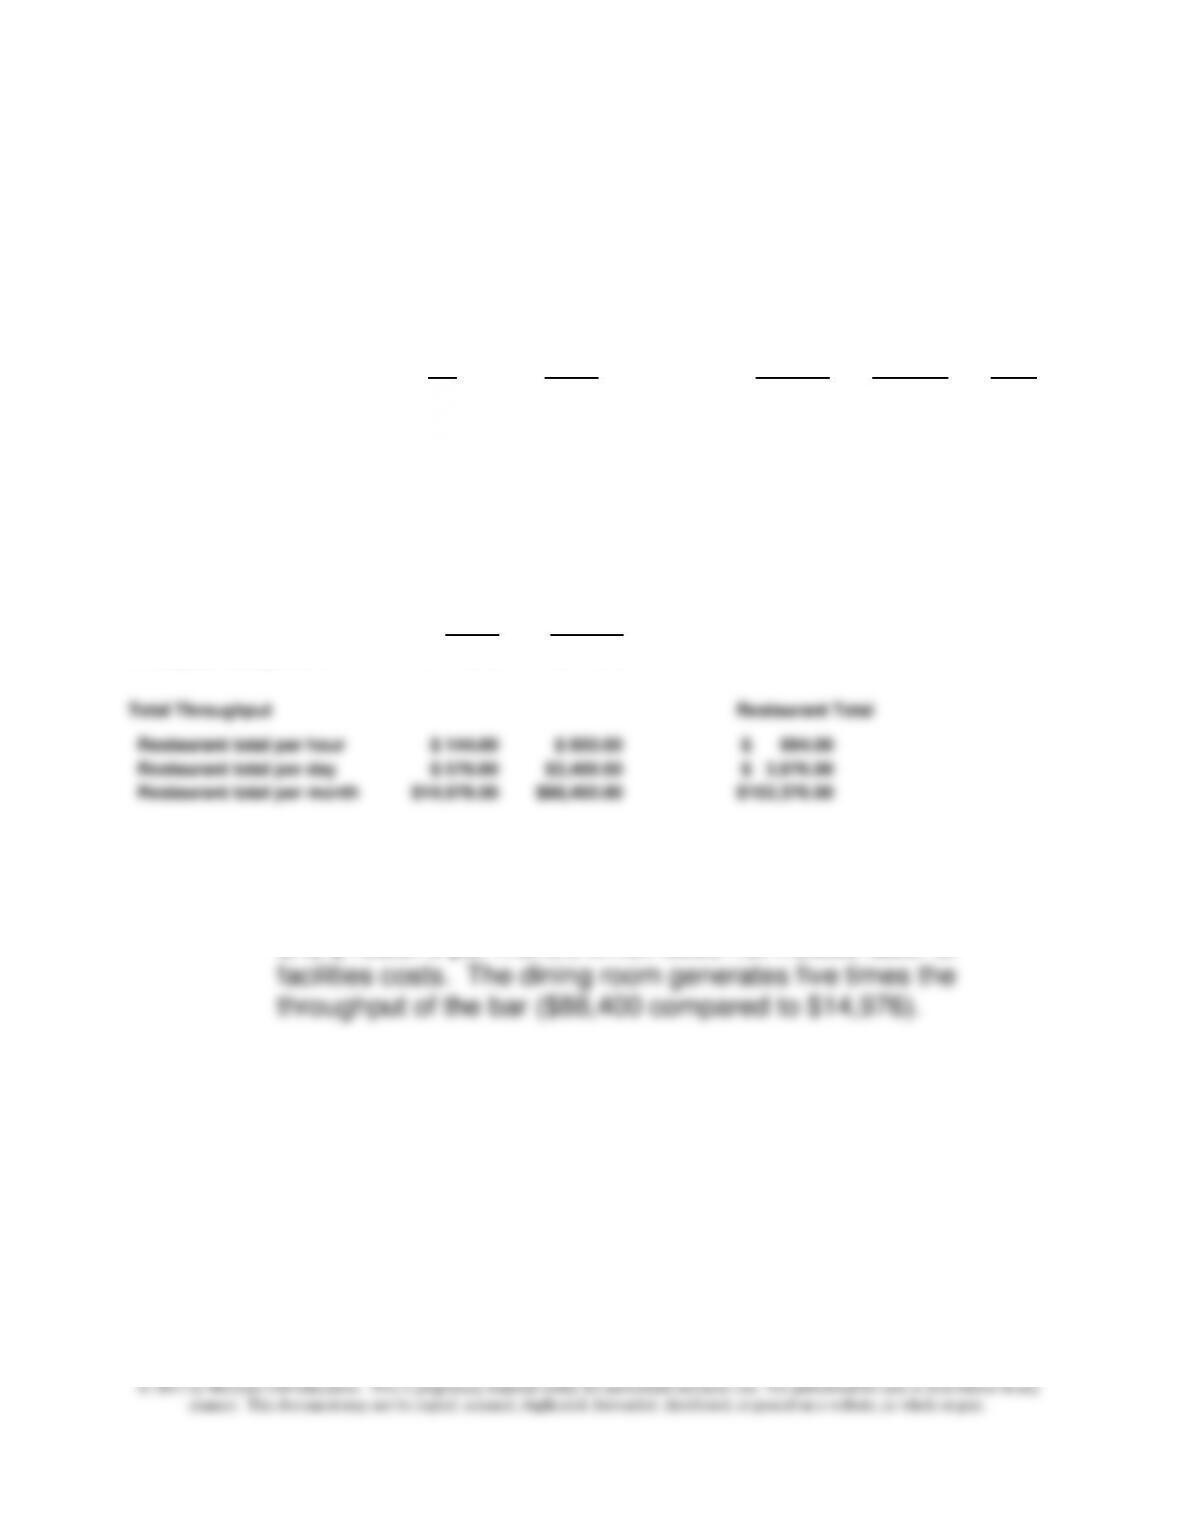
Total Throughput
Restaurant Total
Restaurant total per hour
$ 144.00
$ 850.00
$ 994.00
Restaurant total per day
$ 576.00
$3,400.00
$ 3,976.00
Restaurant total per month
$14,976.00
$88,400.00
$103,376.00
a) At the current level of demand, there is sufficient capacity in
each of the four activities; see column headed “Slack” above.
b) The total throughput margin is $994 per hour, $3,976 per day,
and $103,376 per month, which does not include labor or
Chapter 13 – Cost Planning for the Product Life Cycle: Target Costing, Theory of Constraints, and Strategic Pricing
13–35
13-47 (continued –2)
2a. First: calculate the required capacity usage for the expected
demand; the bar demand will increase 50% to 36 and the dining demand
will increase 20% to 60.
Data
Average
Average
Number of
Customer
Time in
Product
Number of
Customers/hr
Price
Materials
Cost
Customers
per car
Restaurant
(hours)
Bar
36
$ 7.00
1.00
1.5
2
Dining
60
$ 22.00
$ 5.00
3
1
Time for preparation of each meal
12
min.
Number of meals that can be prepared at one time
20
meals
–
Capacity
Required/hr
Available
Activity
Bar
Dining
Capacity/hr
Parking (spaces)
48.00
20.00
80
parking spaces
Bar (seats)
72.00
0.00
54
seats
Dining (seats)
0.00
60.00
100
seats
Kitchen (meals)
0.00
60.00
100
meals/hr
Step One: Identify the Constraint
Total Time Required for Each activity for Given Demand
Total
Capacity
Capacity
Slack
Bar
Dining
Usage
Available
Time
Parking
(spaces)
48.00
20.00
68.00
80
12.0
Bar (seats)
72.00
–
72.00
54
(18.0)
Dining (seats)
–
60.00
60.00
100
40.0
Kitchen
(meals)
–
60.00
60.00
100
40.0
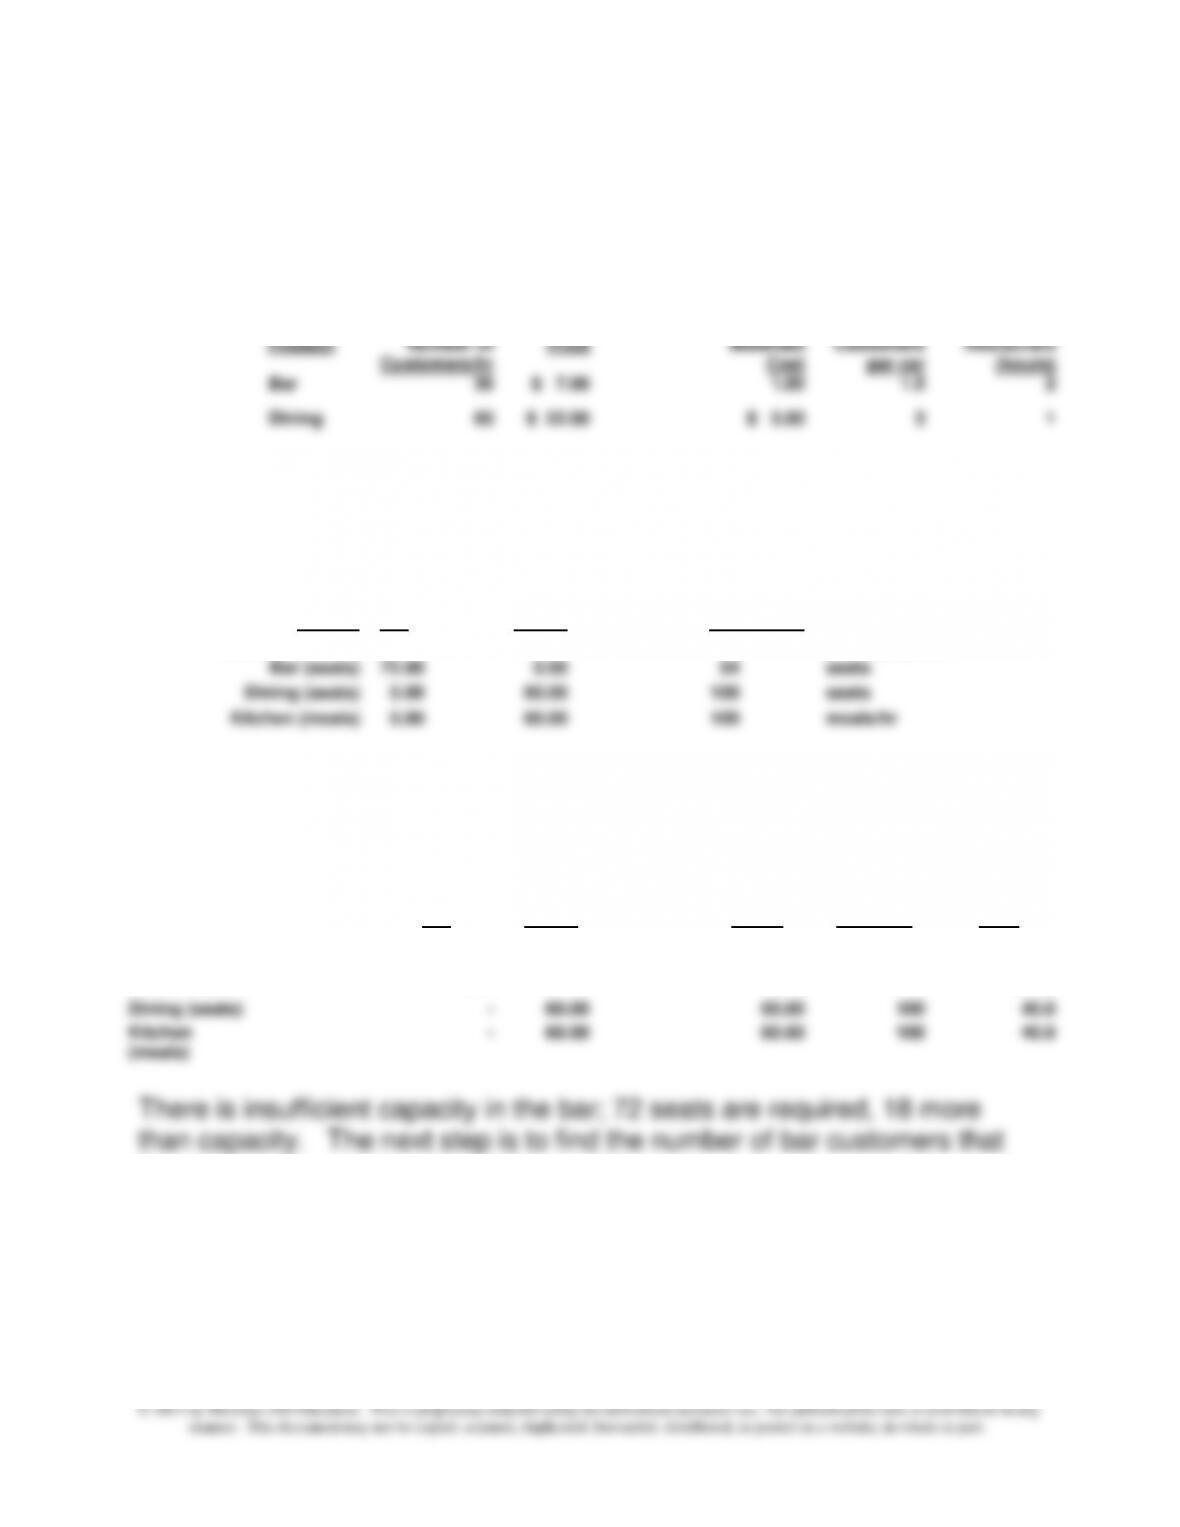
There is insufficient capacity in the bar; 72 seats are required, 18 more
than capacity. The next step is to find the number of bar customers that
the restaurant could serve at full capacity.
Chapter 13 – Cost Planning for the Product Life Cycle: Target Costing, Theory of Constraints, and Strategic Pricing
13–36
13-47 (continued -3)
2b. The number of customers the bar could serve at full capacity is 27
customers from 7pm to 10pm; 27 customers at 2 hours per customer
means 54 seats, the maximum available. From 6pm-7pm, 36 customers
can be served There is excess capacity in the parking lot, so no problem
there.
Average
Average
Number of
Customer
Time in
Product
Number of
Customers/hr
Price
Materials
Cost
Customers
per car
Restaurant
(hours)
Bar
27
$ 7.00
$ 1.00
1.5
2
Dining
60
$ 22.00
$ 5.00
3
1
Time for preparation of each meal
12
min.
Number of meals that can be prepared at one time
20
meals
Activity
Capacity
Required/hr
Bar
Dining
Available
Capacity/hr
Parking (spaces)
36.00
20.00
80
parking spaces
Bar (seats)
54.00
0.00
54
seats
Dining (seats)
0.00
60.00
100
seats
Kitchen (meals)
0.00
60.00
100
meals/hr
Step One: Identify the Constraint
Total Time Required for Each activity for Given Demand
Total
Capacity
Capacity
Slack
Bar
Dining
Usage
Available
Time
Parking (spaces)
36.00
20.00
56.00
80
24.0
Bar (seats)
54.00
–
54.00
54
–
Dining (seats)
–
60.00
60.00
100
40.0
Kitchen (meals)
–
60.00
60.00
100
40.0
Bar
Dining
Demand
27
60
Price
$ 7.00
$ 22.00
Materials Cost
$ 1.00
$ 5.00
Throughput Margin
$ 6.00
$ 17.00
Total Throughput
Restaurant Total
Restaurant average per hour
$1,020.00
First hour: 36 patrons, one drink/hr
$ 216.00
$ –
2nd-4th hours: 27 patrons, one drink/hr*
$ 162.00
$ –
Total for 4 hours
$ 702.00
$1,020.00
$ 1,722.00
Restaurant average per day (4hrs)
$ 702.00
$ 4,080.00
$ 4,782.00
Restaurant average per month (26 days)
$ 18,252.00
$106,080.00
$124,332.00
*With 27 new customers arriving at 7pm, this assumes that 9 (=36-27) of the 6pm customers must leave at 7pm
Chapter 13 – Cost Planning for the Product Life Cycle: Target Costing, Theory of Constraints, and Strategic Pricing
13–37
13–47 (continued -4)
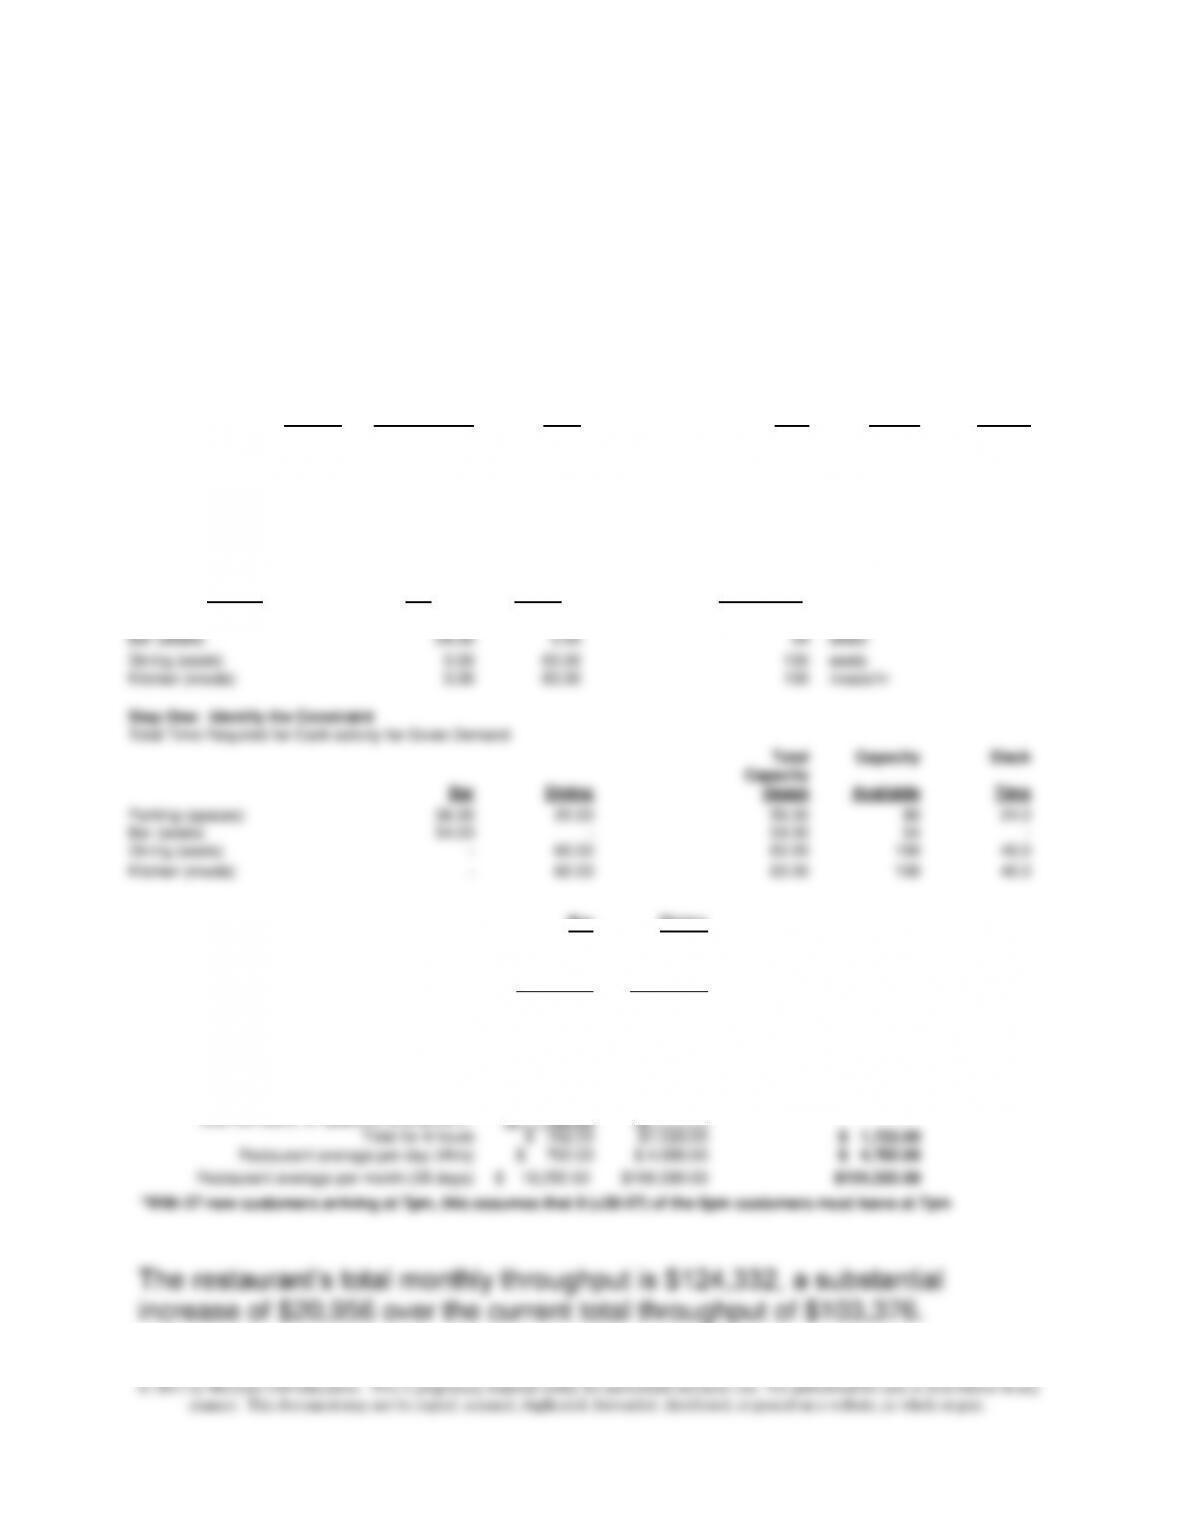
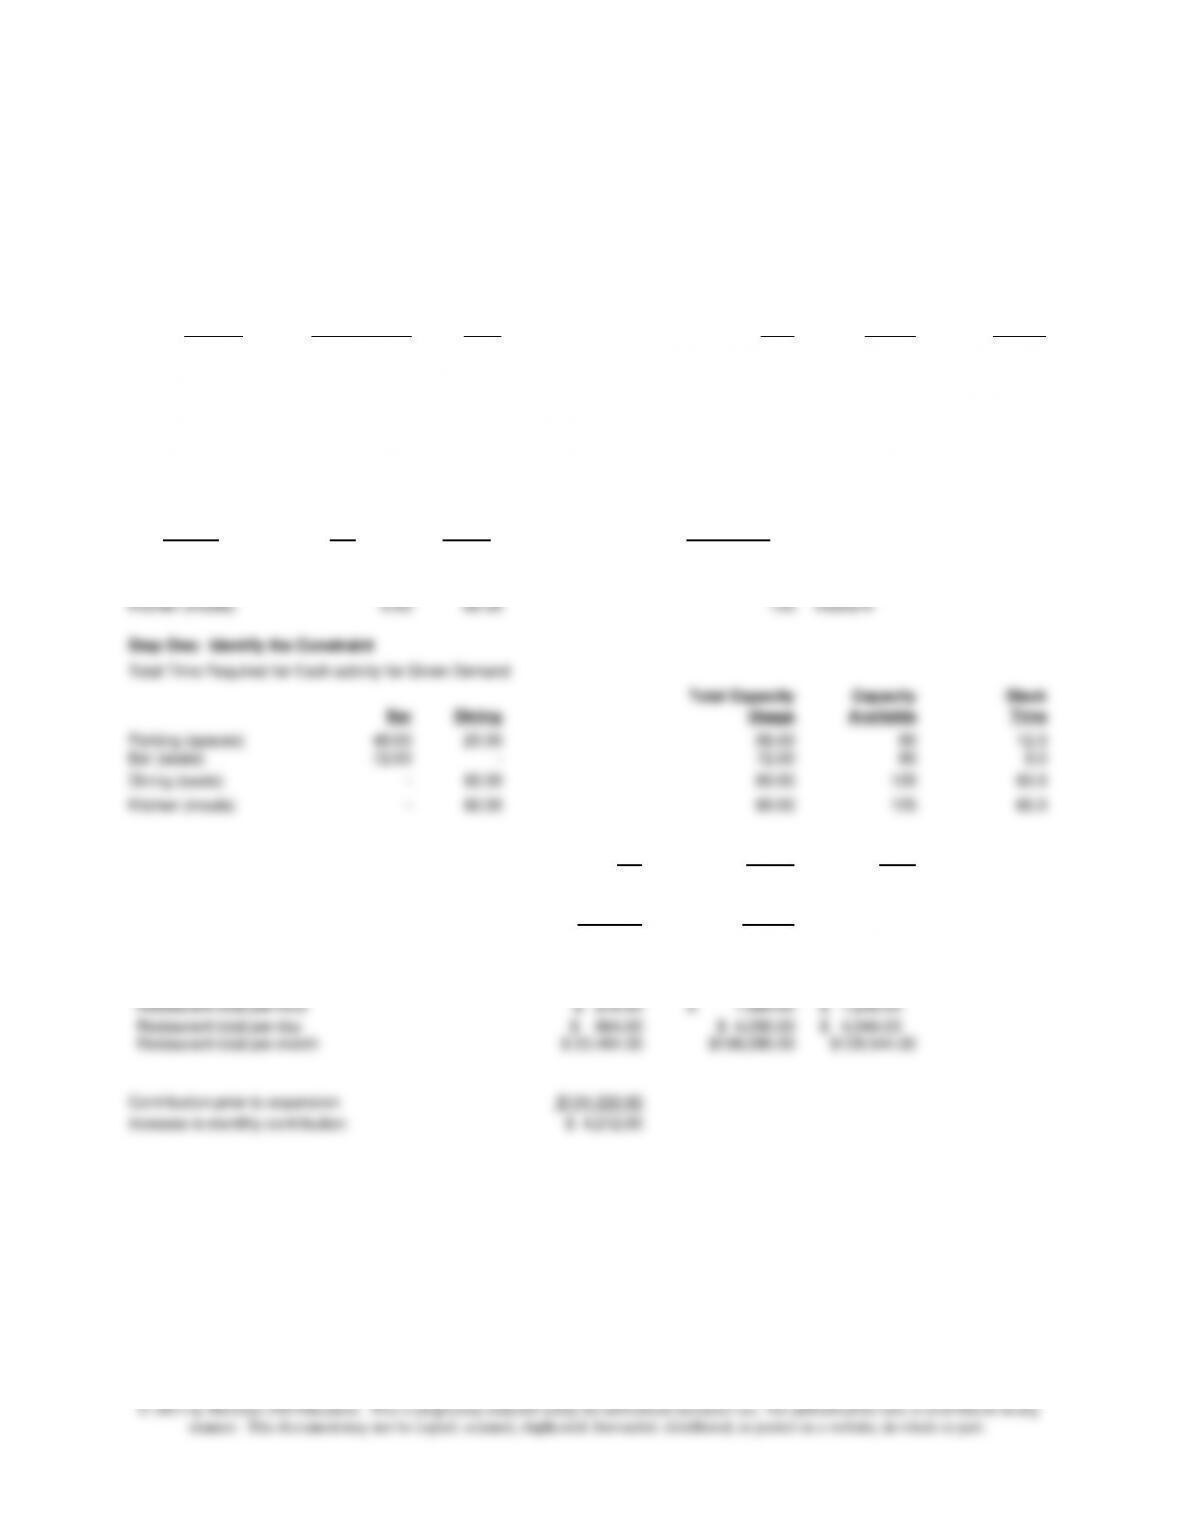
3.
The throughput with the added capacity would increase to $128,544 per
month, a $4,212 increase.
Average
Average
Number of
Customer
Time in
Product
Number of
Customers/hr
Price
Materials Cost
Customers
per car
Restaurant
(hours)
Bar
36
$ 7.00
$ 1.00
1.5
2
Dining
60
$ 22.00
$ 5.00
3
1
Time for preparation of each meal
12
min.
Number of meals that can be prepared at one time
25
meals
Capacity
Required/hr
Available
Activity
Bar
Dining
Capacity/hr
Parking (spaces)
48.00
20.00
80
parking spaces
Bar (seats)
72.00
0.00
80
seats
Dining (seats)
0.00
60.00
120
seats
Kitchen (meals)
0.00
60.00
125
meals/hr
Step One: Identify the Constraint
Total Time Required for Each activity for Given Demand
Total Capacity
Capacity
Slack
Bar
Dining
Usage
Available
Time
Parking (spaces)
48.00
20.00
68.00
80
12.0
Bar (seats)
72.00
–
72.00
80
8.0
Dining (seats)
–
60.00
60.00
120
60.0
Kitchen (meals)
–
60.00
60.00
125
65.0
Bar
Dining
Total
Demand
36
60
Price
$ 7.00
$ 22.00
Materials Cost
$ 1.00
$ 5.00
Throughput Margin
$ 6.00
$ 17.00
Total Throughput
Restaurant total per hour
$ 216.00
$ 1,020.00
$ 1,236.00
Restaurant total per day
$ 864.00
$ 4,080.00
$ 4,944.00
Restaurant total per month
$ 22,464.00
$106,080.00
$128,544.00
Contribution prior to expansion
$124,332.00
Increase in monthly contribution
$ 4,212.00
Chapter 13 – Cost Planning for the Product Life Cycle: Target Costing, Theory of Constraints, and Strategic Pricing
13–38
13-47 (continued -5)
Also, the above analysis does not consider the increased cost of labor
and facilities/operating costs that would be involved in the expansion; an
expanded facility is likely to increase these additional costs.
In recessionary times, restaurants also get help from their suppliers, that
provide hints for the design of menus, marketing and administrative
services, and suggestions for new recipes. The extra help can make
the restaurant more competitive, and of course, provides a continuing
customer for the supplier.
See: Christopher Palmeri, “SYSCO Hustles to Keep Restaurants Cooking,”
Business Week, may 18, 2009, pp. 52-3/