Chapter 13 – Cost Planning for the Product Life Cycle: Target Costing, Theory of Constraints, and Strategic Pricing
13–16
13-35 Pricing (25 min)
The price, contribution, and profit information is as follows.
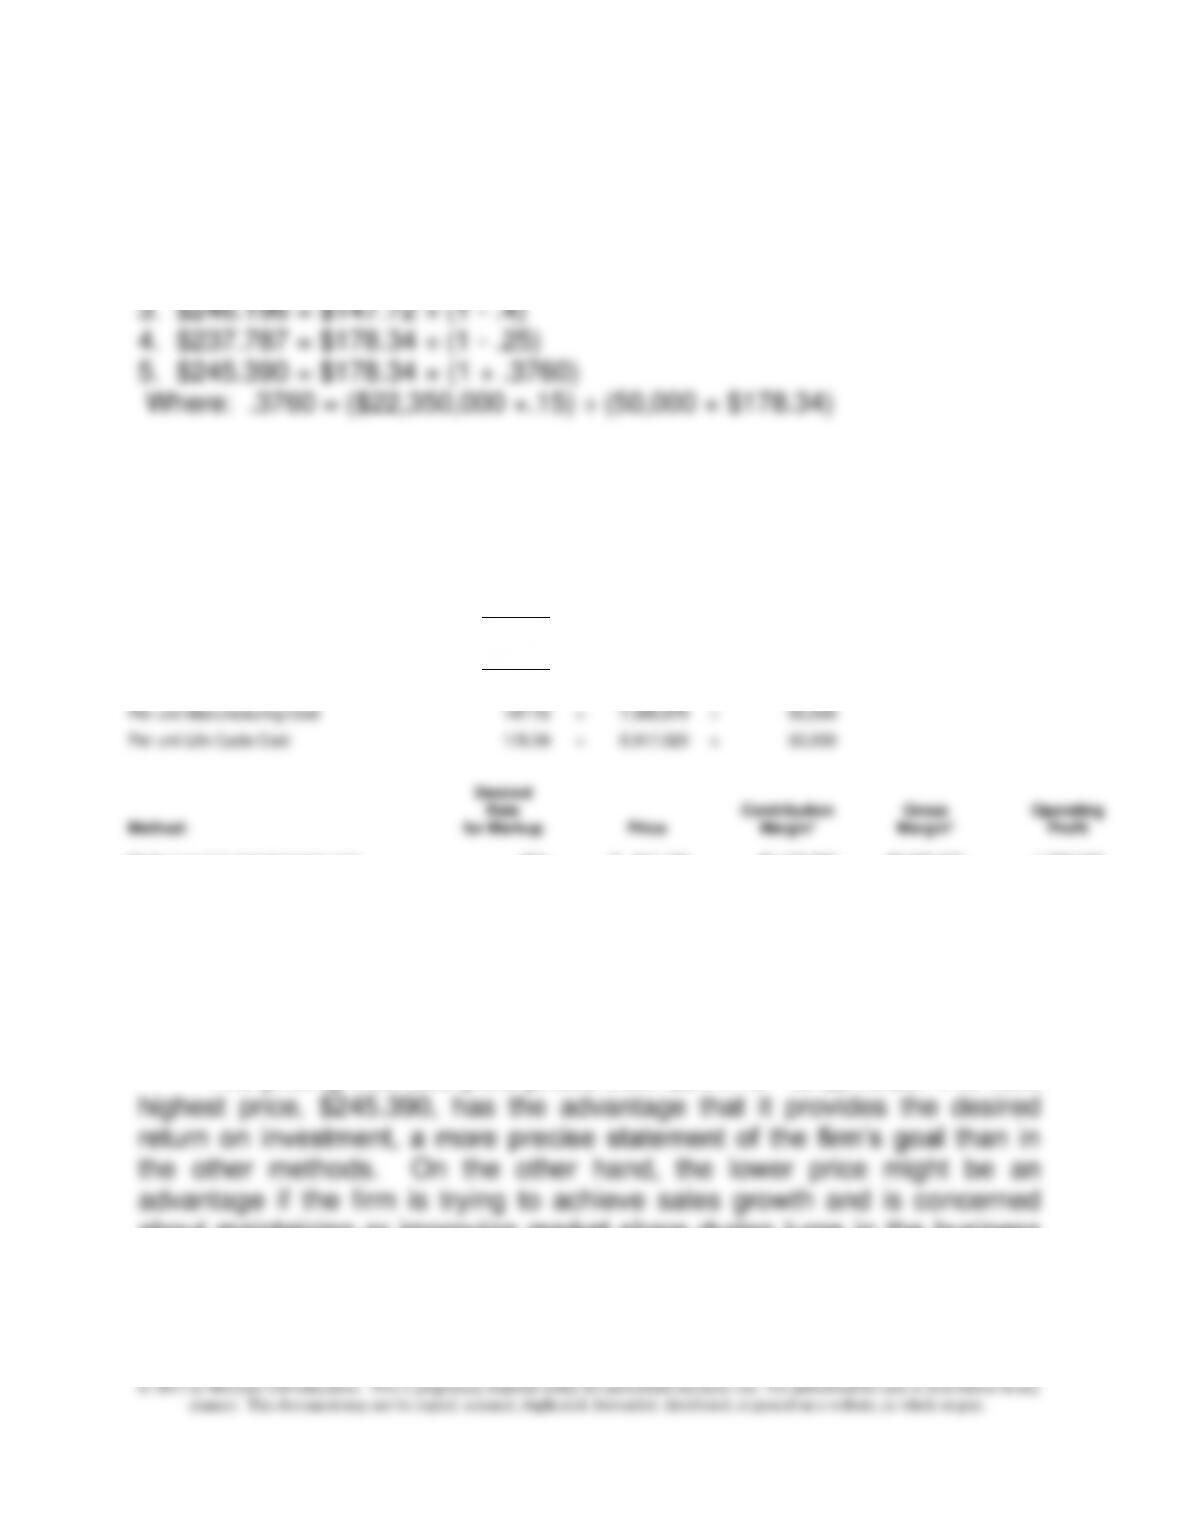
1. $214.190 = ($7,385,875 × 1.45) ÷ 50,000
2. $222.926 = ($8,917,020 × 1.25) ÷ 50,000
Total Investment in Product Line
22,350,000
Expected Sales (units)
50,000
Total Variable Costs
$ 5,535,650
=
$4,680,000
+
855,650
Total Fixed Costs
3,381,370
=
2,345,875
+
675,495
+
360,000
Total Manufacturing Cost
7,385,875
=
$4,680,000
+
2,345,875
+
360,000
Total Selling and Administrative
1,531,145
=
855,650
+
675,495
Total Life Cycle Cost
8,917,020
Per unit Manufacturing Cost
147.72
=
7,385,875
÷
50,000
Per unit Life Cycle Cost
178.34
=
8,917,020
÷
50,000
Desired
Rate
Contribution
Gross
Operating
Method:
for Markup
Price
Margin*
Margin*
Profit
Markup on full manufacturing cost
45%
$ 214.190
$5,173,900
$3,323,675
1,792,530
Markup on life cycle costs
25%
222.926
$5,610,650
$3,760,425
2,229,280
Price to Achieve Desired GM %
40.00%
246.196
$6,774,150
$4,923,925
3,392,780
Price to Achieve Desired LCC %
25.00%
237.787
$6,353,750
$4,503,525
2,972,380
Price to Achieve Desired ROA of
15%
37.60%
245.390
$6,733,850
$4,883,625
3,352,480
* Contribution margin and gross margin computed after price is rounded to 3 decimal places
6. The contribution margin, gross margin, and operating profit are shown in
0the right-hand portion of the table above.
The pricing methods yield prices from $214.19 to $246.20. The next
about maintaining or improving market share during turns in the business
cycle for its customers. This latter concern is especially important given
that the demand for the firm’s product is a derived demand, and there is
little that Williams can do to influence total auto sales.
Chapter 13 – Cost Planning for the Product Life Cycle: Target Costing, Theory of Constraints, and Strategic Pricing
13–17
13–36 Pricing Military Contracts (10 min)
This is a complex issue which Pentagon officers and congressional leaders
continue to squabble over. In this particular case, Senator McCain argued
that the contract should be re-written to reduce the fixed fee from 10% to
As for whether the performance fee is too low or too high is a matter of
perspective. While Congress might think the old 5% incentive was too low,
contractors might think the new 12% incentive fee is too big a proportion of
the overall potential fee.
Source: “The Right Stuff for the GIs of the Future,” BusinessWeek, August
15, 2005, pp. 74-75.
Chapter 13 – Cost Planning for the Product Life Cycle: Target Costing, Theory of Constraints, and Strategic Pricing
13–18
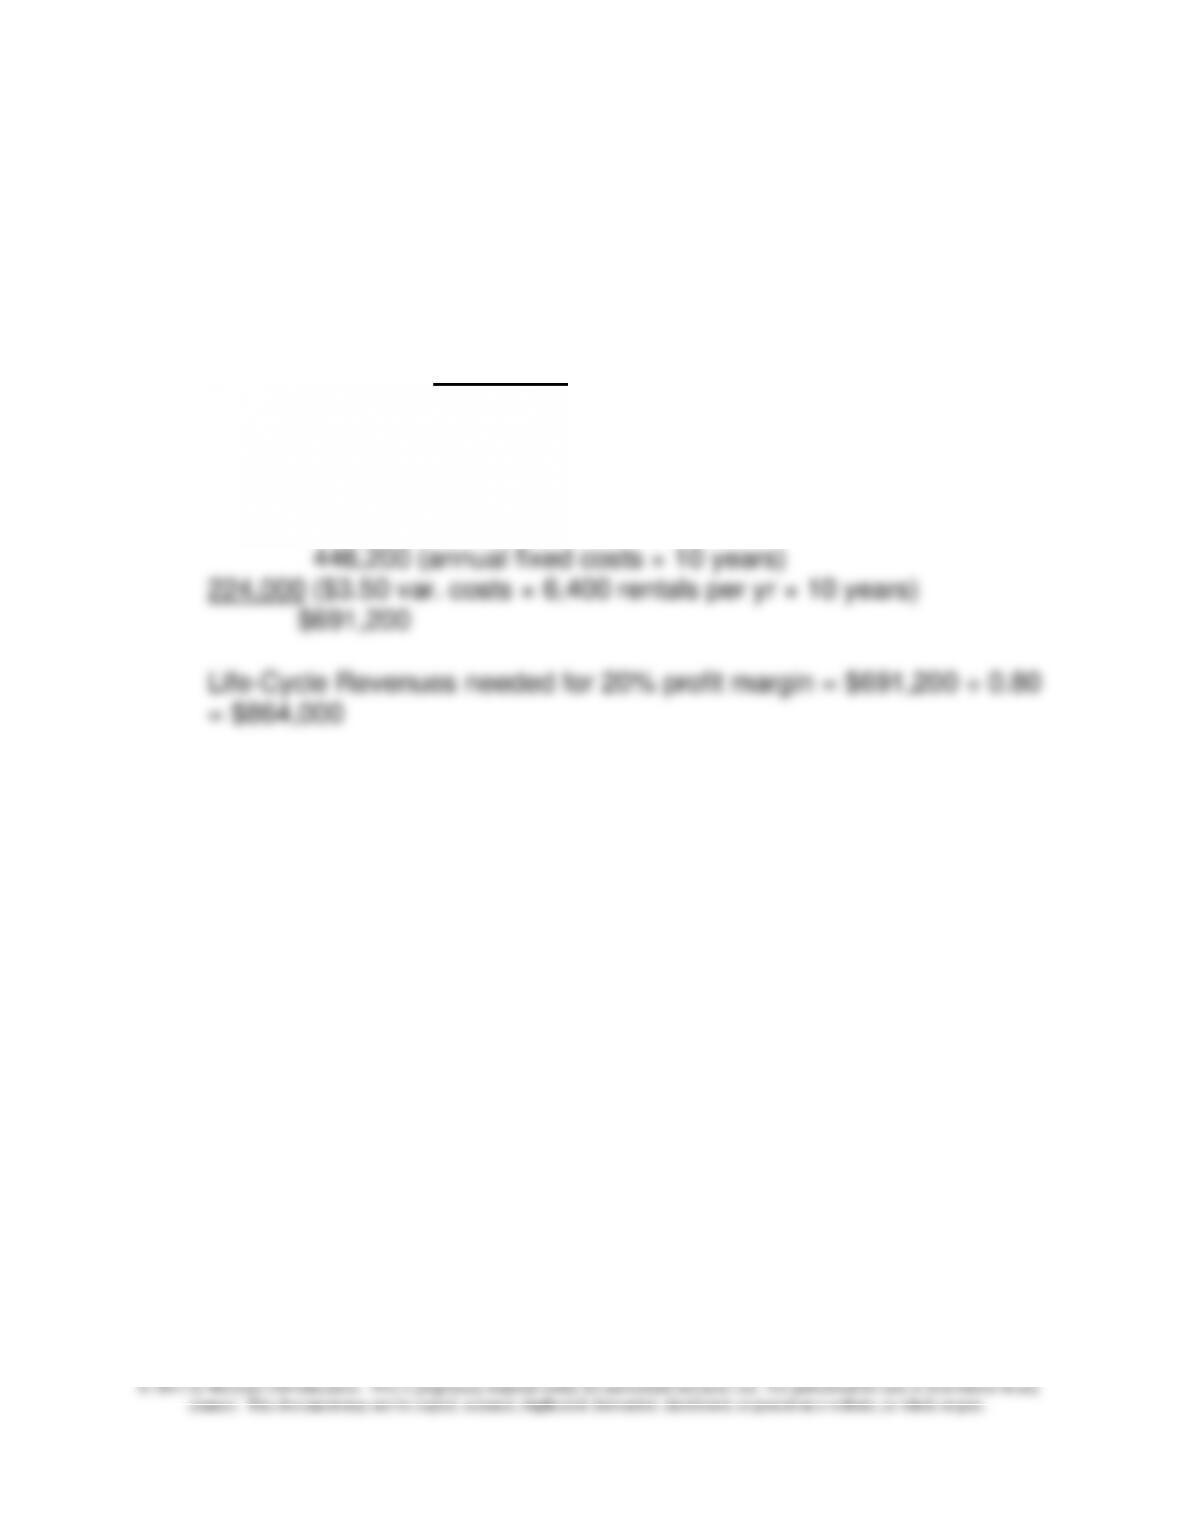
13-37 Life-Cycle Pricing (20 min)
Total Fixed Costs $ 2,300
3,000
5,400
6,920
6,000
21,000
$ 44,620
Total variable costs $2.50 + .50 + .50 = $3.50
Life-Cycle Costs =
$ 21,000 for fleet of canoes
Price per Rental for 20% profit margin = $864,000 ÷ 64,000 rentals in
ten years = $13.50
Chapter 13 – Cost Planning for the Product Life Cycle: Target Costing, Theory of Constraints, and Strategic Pricing
13–19
PROBLEMS
13-38 Target Costing in a Service Firm (20 min)
1.
ICU 100
ICU 900
Unit Cost
Quantity
Cost
Quantity
Cost
Video camera
$ 150
1
$150
3
$450
Video monitor
75
1
75
1
75
Motion detector
15
5
75
8
120
Floodlight
8
3
24
7
56
Alarm
15
1
15
2
30
Wiring
.10/ft
700
70
1,100
110
Installation
20/hr
16
320
26
520
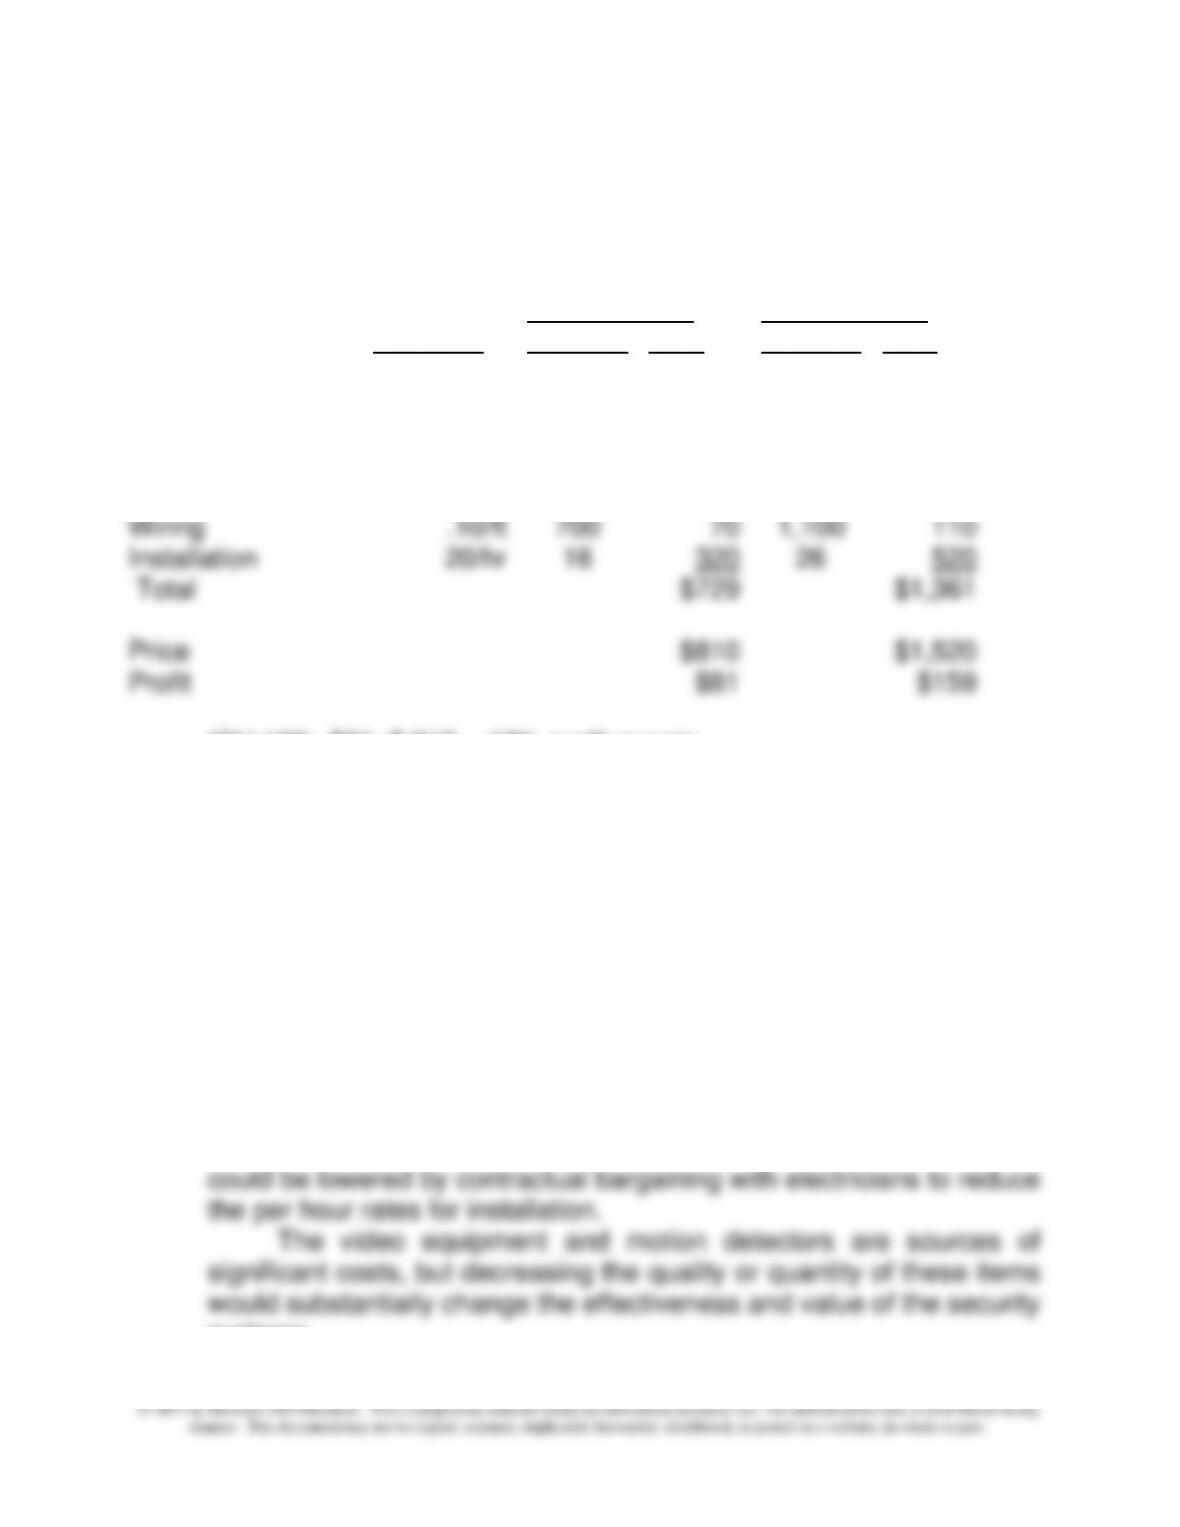
Total
$729
$1,361
Price
$810
$1,520
Profit
$81
$159
ICU 100: $81÷$ 810 = 10% profit margin
ICU 900: $159÷$1,520 = 10.46% profit margin
2.
Price $750 $1,390
Profit $21 $29
ICU 100: $21÷ $750 = 2.80% profit margin
ICU 900: $29÷$1,390 = 2.09% profit margin
3. The installation costs are the largest component of cost and this
category could have room for improvement. By redesigning the
layout of the systems or finding components that integrate more
readily, the installation times could then be reduced. Also, costs
systems.
Chapter 13 – Cost Planning for the Product Life Cycle: Target Costing, Theory of Constraints, and Strategic Pricing
13–20
13-39 Target Costing; Review of Chapter 11 (20 min)
1. The target cost, at the price of $1,500 and the desired margin of 20%
would be
TC = $1,500 – (.2 x $1,500) = $1,200
2.
Currently
With Cost
Reductions
Savings
Manufacturing
Cost
$1,000
$835
($85-$25)+$105=
$165
Marketing Cost
200
200
GSA Cost
225
175
$50
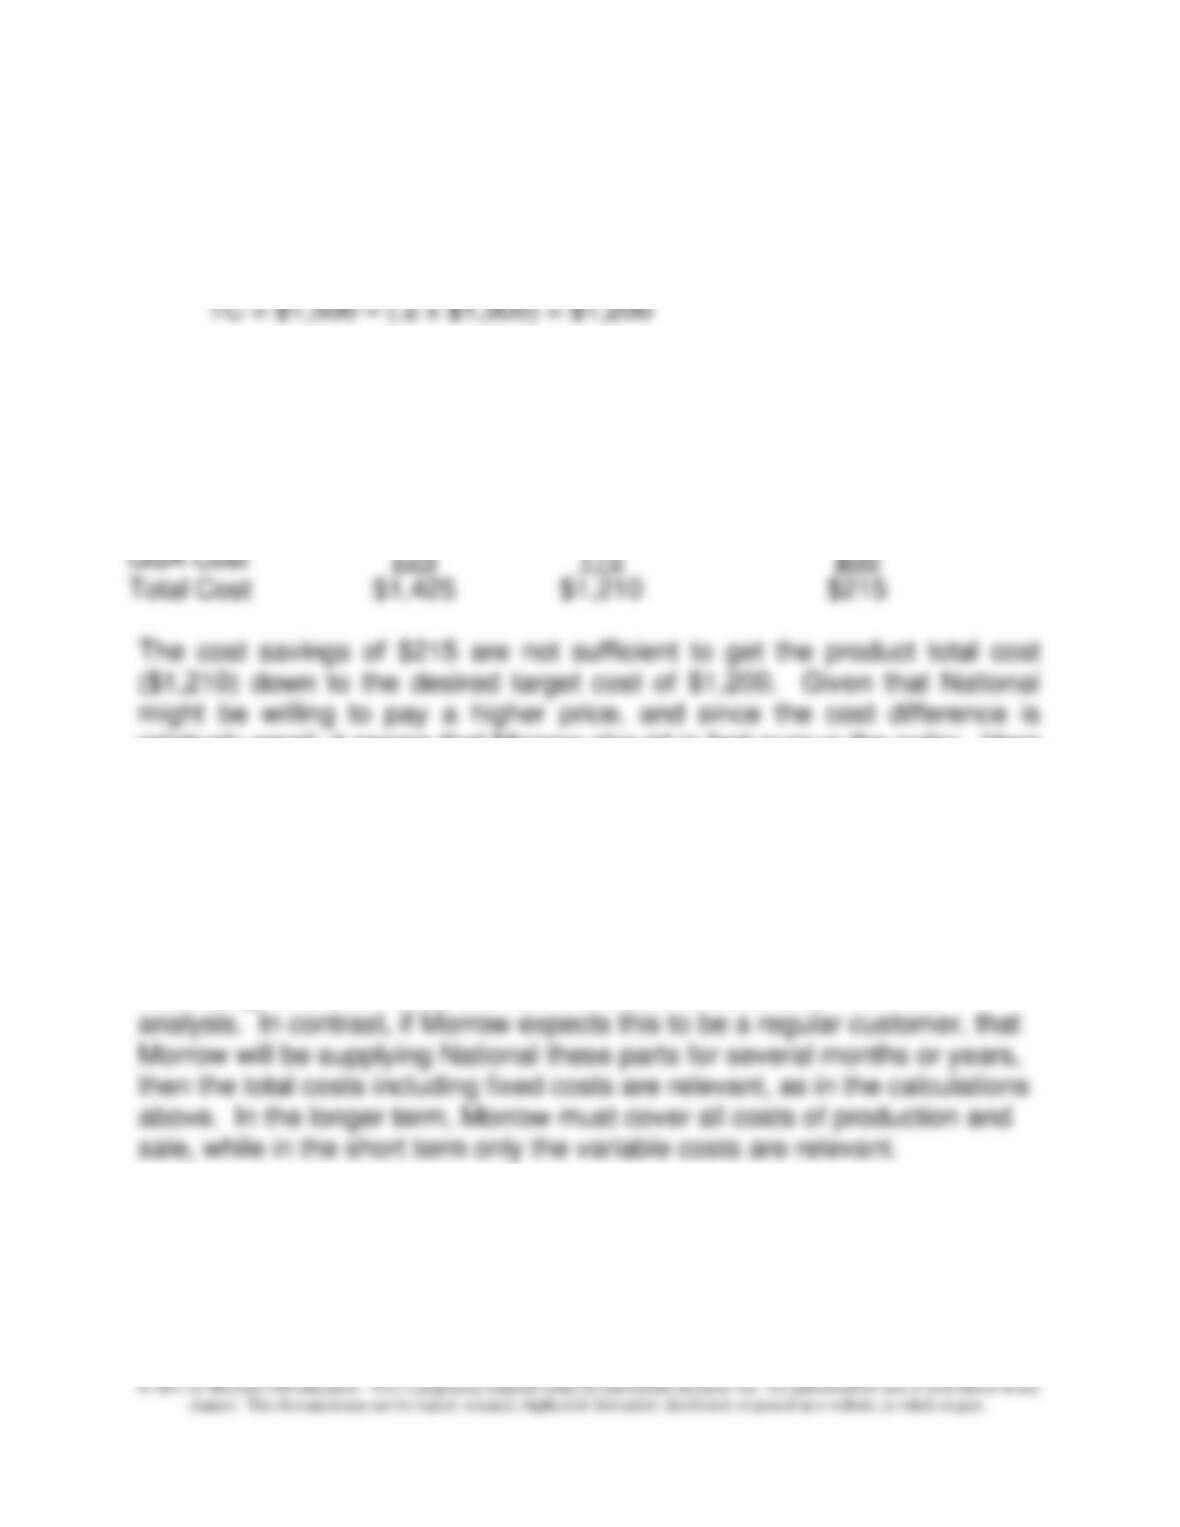
Total Cost
$1,425
$1,210
$215
The cost savings of $215 are not sufficient to get the product total cost
($1,210) down to the desired target cost of $1,200. Given that National
might be willing to pay a higher price, and since the cost difference is
relatively small, it seems that Morrow should in fact pursue the order. Here
are some other considerations:
a. Morrow should consider the short versus the long term issues of taking
on the order. In the short term, as noted in chapter 3, the fixed costs of
manufacturing the order will not change and therefore can be considered
irrelevant for the order if it is a one-time special order. Thus, for a short
term analysis, Morrow should determine that portion of manufacturing,
marketing, and GSA costs that are fixed and exclude them from the
Chapter 13 – Cost Planning for the Product Life Cycle: Target Costing, Theory of Constraints, and Strategic Pricing
13–21
13-39 (continued –1)
b. Morrow appears to compete in what Robin Cooper calls the
“confrontation” strategy (When Lean Enterprises Collide, Harvard Business
School Press, 1995) wherein each competitor must simultaneously
compete on the basis of price, quality and functionality. In Morrow’s case,
functionality refers not only to meeting product specifications but also to
and choosing the proper “bundle” of the three aspects of competition:
price, quality and functionality. For example, to be most competitive,
Morrow must spend extra dollars to ensure that there are few if any billing
and shipping errors, while at the same time reducing the costs of
manufacturing the product, and maintaining or improving product quality.
c. The problem notes that the manufacturing costs are “standard” full costs.
Since the costs are given at standard, this means that there are no
Should the standards be revised?
Chapter 13 – Cost Planning for the Product Life Cycle: Target Costing, Theory of Constraints, and Strategic Pricing
13–22
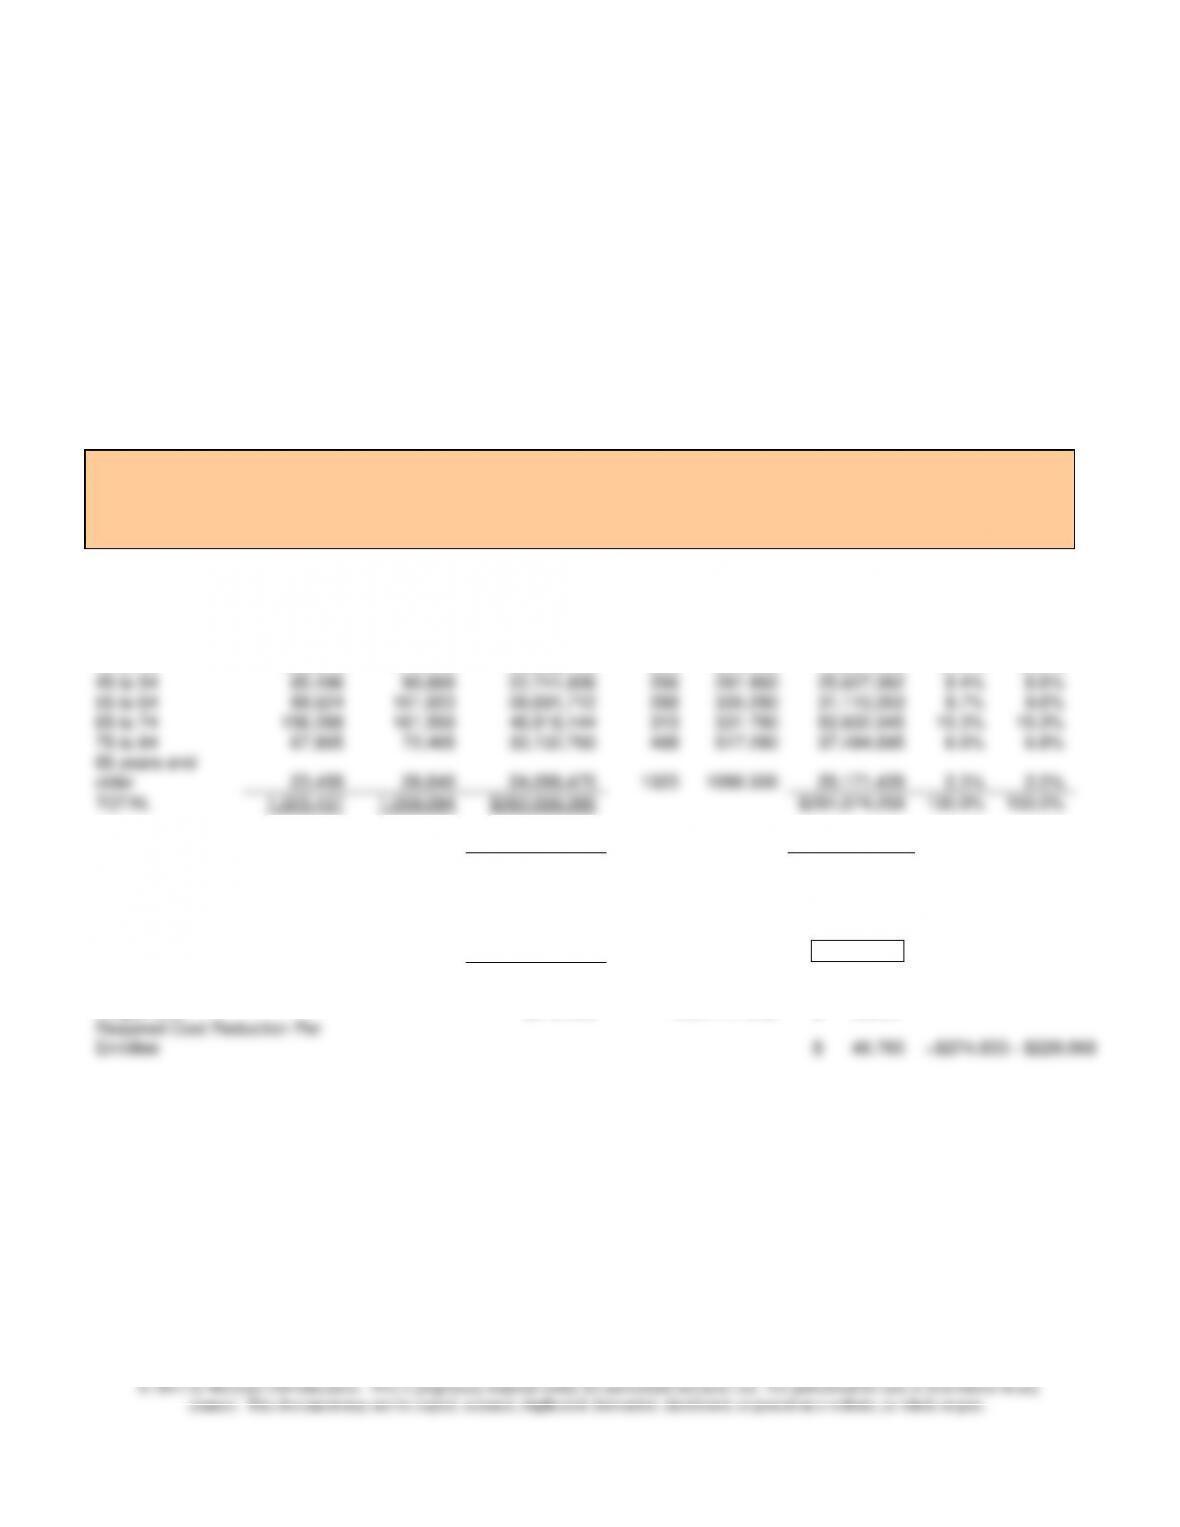
13-40 Target Costing; Health Care (20 min)
1. The average cost is $256.068 = $262,069,095÷1,023,437
The current profit per enrollee is $368 – $256.068 = $111.932
The target cost is $213.068 = $325 – $111.932 to maintain the same
contribution per enrollee
Enrollment
in 2013
Projected
Enrollment
in 2014
Average
Monthly Cost
in 2013
Avg
Cost in
2013
Age
Cost in
2014
(+6%)
Projected
Cost in 2014
Age %
in 2014
Age %
in 2014
1 to 4
45,688
48,977
$ 11,147,872
244
258.640
$12,667,411
4.5%
4.6%
5 to 14
82,456
84,663
10,059,632
122
129.320
10,948,619
8.1%
8.0%
15 to 19
95,873
95,887
8,436,824
88
93.280
8,944,339
9.4%
9.1%
20 to 24
66,246
67,882
9,539,424
144
152.640
10,361,508
6.5%
6.4%
25 to 34
133,496
132,554
26,432,208
198
209.880
27,820,434
13.0%
12.5%
35 to 44
166,876
175,446
38,882,108
233
246.980
43,331,653
16.3%
16.6%
45 to 54
85,496
90,889
22,741,936
266
281.960
25,627,062
8.4%
8.6%
55 to 64
99,624
101,923
28,691,712
288
305.280
31,115,053
9.7%
9.6%
65 to 74
156,288
161,559
48,918,144
313
331.780
53,602,045
15.3%
15.3%
75 to 84
67,895
72,465
33,132,760
488
517.280
37,484,695
6.6%
6.8%
85 years and
older
23,499
26,849
24,086,475
1025
1086.500
29,171,439
2.3%
2.5%
TOTAL
1,023,437
1,059,094
$262,069,095
$291,074,259
100.0%
100.0%
1,023,437
1,059,094
Average Cost
$ 256.068
$ 274.833
Current Price
$368
Current Profit Per Enrollee
(Desired Profit)
$111.932
=368-256.068
$ 111.932
New Market Price
$325
$ 340.000
Target Cost
$213.068
=325-111.932
$ 228.07
Required Cost Reduction Per
Enrollee
$ 46.765
=$274.833 – $228.068
Chapter 13 – Cost Planning for the Product Life Cycle: Target Costing, Theory of Constraints, and Strategic Pricing
13–23
2. The target cost for 2014 is $228.068 = $340 – $111.932; this calculation
uses the new price and the same profit per enrollee as in 2013. The
required reduction in cost per enrollee is $46.765 as shown in the above
table. Note that the cost per enrollee is determined by taking the average
cost per enrollee for each age group (Col E) in order to determine total
and H), and in particular, the two oldest age groups, the most expensive
groups, have increased slightly in number and percentage. Since the
coverage rate of $340 is applicable to all age groups, it is important for VIP-
13-40 (continued)
MD to study the actual pattern of increase in cost, across all age groups as
the number of enrollees in each group change.
3. A critical success factor is the relationship with network providers.
Establishing a good working relationship with its providers improves the
likelihood that the clinicians will follow the HMO’s protocols. Customer
satisfaction is essential, so VIP-MD should measure and monitor the
Chapter 13 – Cost Planning for the Product Life Cycle: Target Costing, Theory of Constraints, and Strategic Pricing
13–24
13-41 Target Cost; Warehousing (20 min)
Current Year Operating Income
Sales ($20 x 100,000) =
$2,000,000
Costs:
Purchase ($10 x 100,000)
$1,000,000
Purchasing order ($150 x 1,000)
150,000
Warehousing ($30 x 8,000)
240,000
Distributing ($80 x 500)
40,000
Fixed operating cost
250,000
1,680,000
Operating income
$320,000
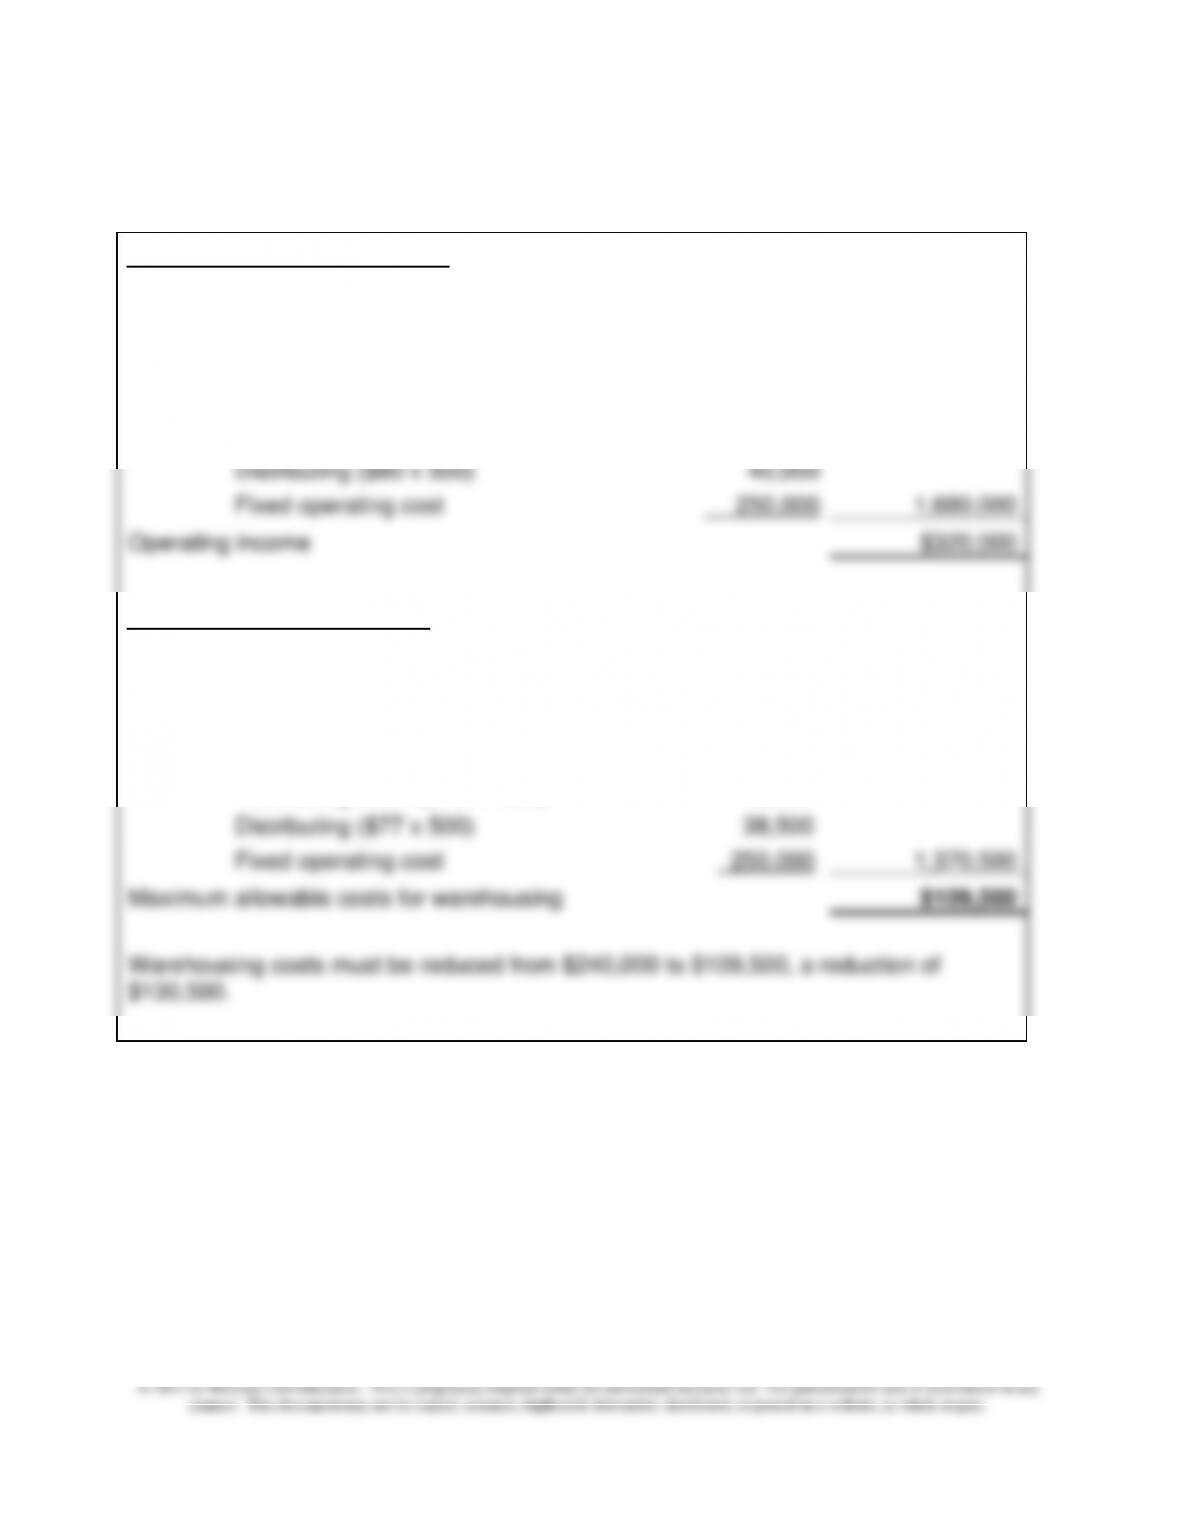
Determination of Target Cost:
Sales ($20.00 x 100,000 x 0.90)
$1,800,000
Desired profit (above)
320,000
Costs:
Purchase (2% discount)
$980,000
Purchasing order ($150 x 680)
102,000
Distributing ($77 x 500)
38,500
Fixed operating cost
250,000
1,370,500
Maximum allowable costs for warehousing
$109,500
Warehousing costs must be reduced from $240,000 to $109,500, a reduction of
$130,500.
Chapter 13 – Cost Planning for the Product Life Cycle: Target Costing, Theory of Constraints, and Strategic Pricing
13–25
13–42 Target Costing; International (20 min)
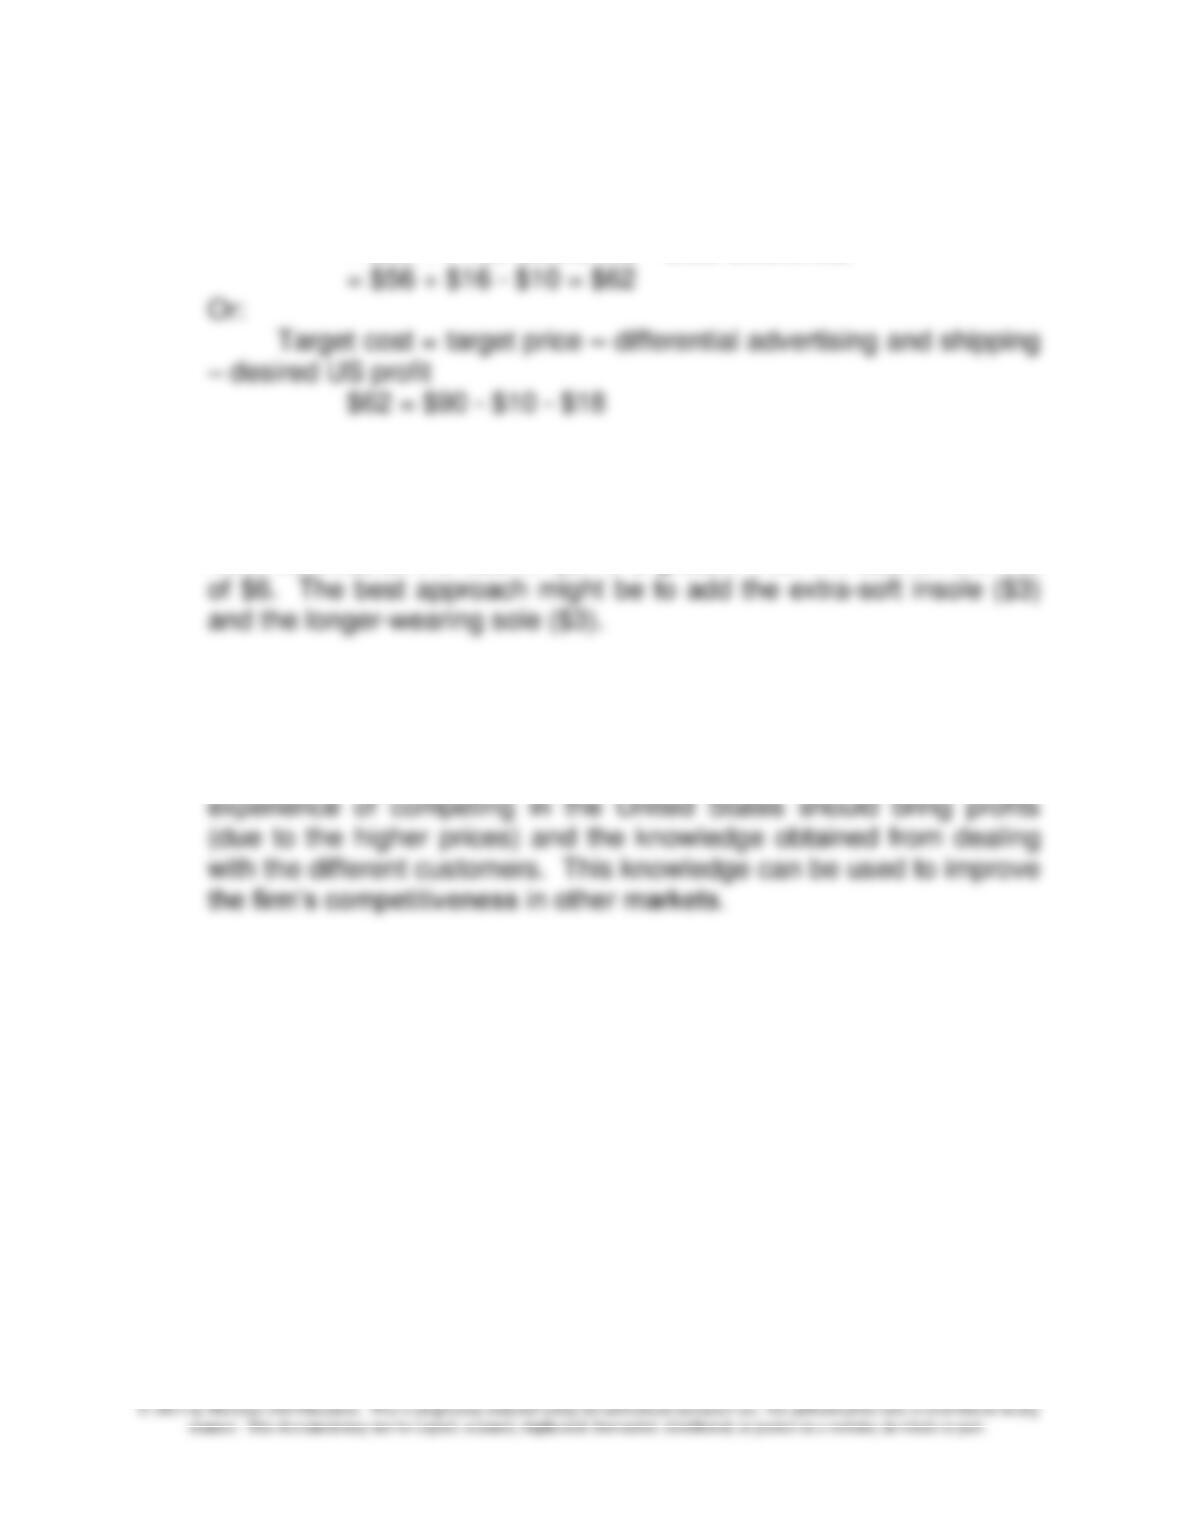
1. Target manufacturing cost = Current manufacturing cost + “U.S.
Differential”
= $56 + Price differential – Cost differential
2. The cost differential is $62 – $56 = $6
Harpers cannot add the lighter weight feature, though it is the
most desired, as the cost of $6.75 is greater than the cost differential
3. Strategically, the decision to sell shoes in the United States makes
very good sense. To compete effectively in a competitive global
market such as shoes, a firm has to have an effective presence in all
the key markets, which would include the United States. The
Note: the currency exchange rate used in the problem is based on the
exchange rate of $1.6523/ £but the actual exchange rate varies on a daily
basis.
Chapter 13 – Cost Planning for the Product Life Cycle: Target Costing, Theory of Constraints, and Strategic Pricing
13–26
13-43 Target Costing; Quality Function Deployment (QFD) (30 min)
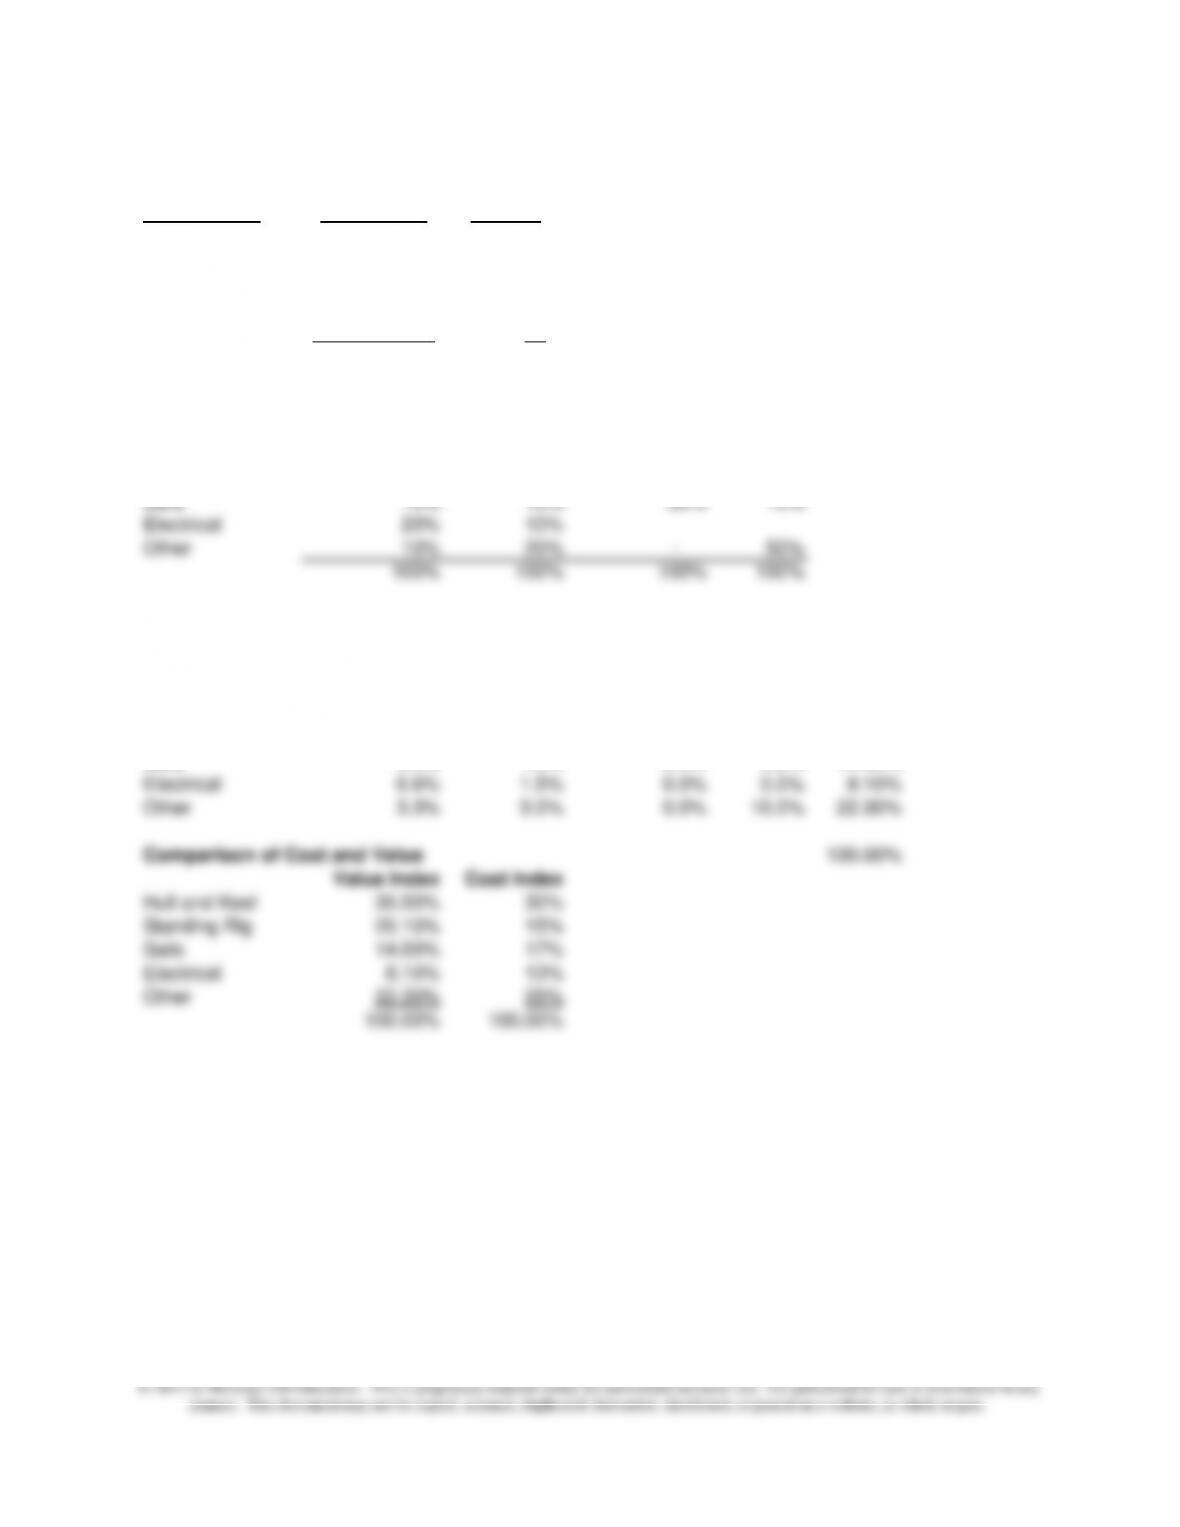
1.
Components Target Cost Percent
Hull and Keel 36,000$ 30%
Standing Rig 18,000 15%
Sails 20,000 17%
Electrical 16,000 13%
Other 30,000 25%
120,000$ 100%
Component/
Criteria Safety Styling Performance Comfort
Hull and Keel 30% 40% 50% 30%
Standing Rig 30% 20% 20% 10%
Sails 10% 10% 30% 10%
Electrical 20% 10%
Other 10% 20% – 50%
100% 100% 100% 100%
Component/ Value
Criteria Safety Styling Performance Comfort Index
Criteria Value 33.0% 15.0% 20.0% 32.0% 100%
Hull and Keel 9.9% 6.0% 10.0% 9.6% 35.50%
Standing Rig 9.9% 3.0% 4.0% 3.2% 20.10%
Sails 3.3% 1.5% 6.0% 3.2% 14.00%
Electrical 6.6% 1.5% 0.0% 0.0% 8.10%
Other 3.3% 3.0% 0.0% 16.0% 22.30%
Standing Rig 20.10% 15%
Sails 14.00% 17%
Electrical 8.10% 13%
Other 22.30% 25%
100.00% 100.00%
Chapter 13 – Cost Planning for the Product Life Cycle: Target Costing, Theory of Constraints, and Strategic Pricing
13–27
13-43 (continued)
2. When the value index is compared to the target cost, the percentage
investment in hull & keel and standing rig looks too low–
The value index for hull & keel is 35.5% while the cost index is 30%; the
that consideration be given to redesign of the boat to bring it more in line
with customer value.
Chapter 13 – Cost Planning for the Product Life Cycle: Target Costing, Theory of Constraints, and Strategic Pricing
13–28
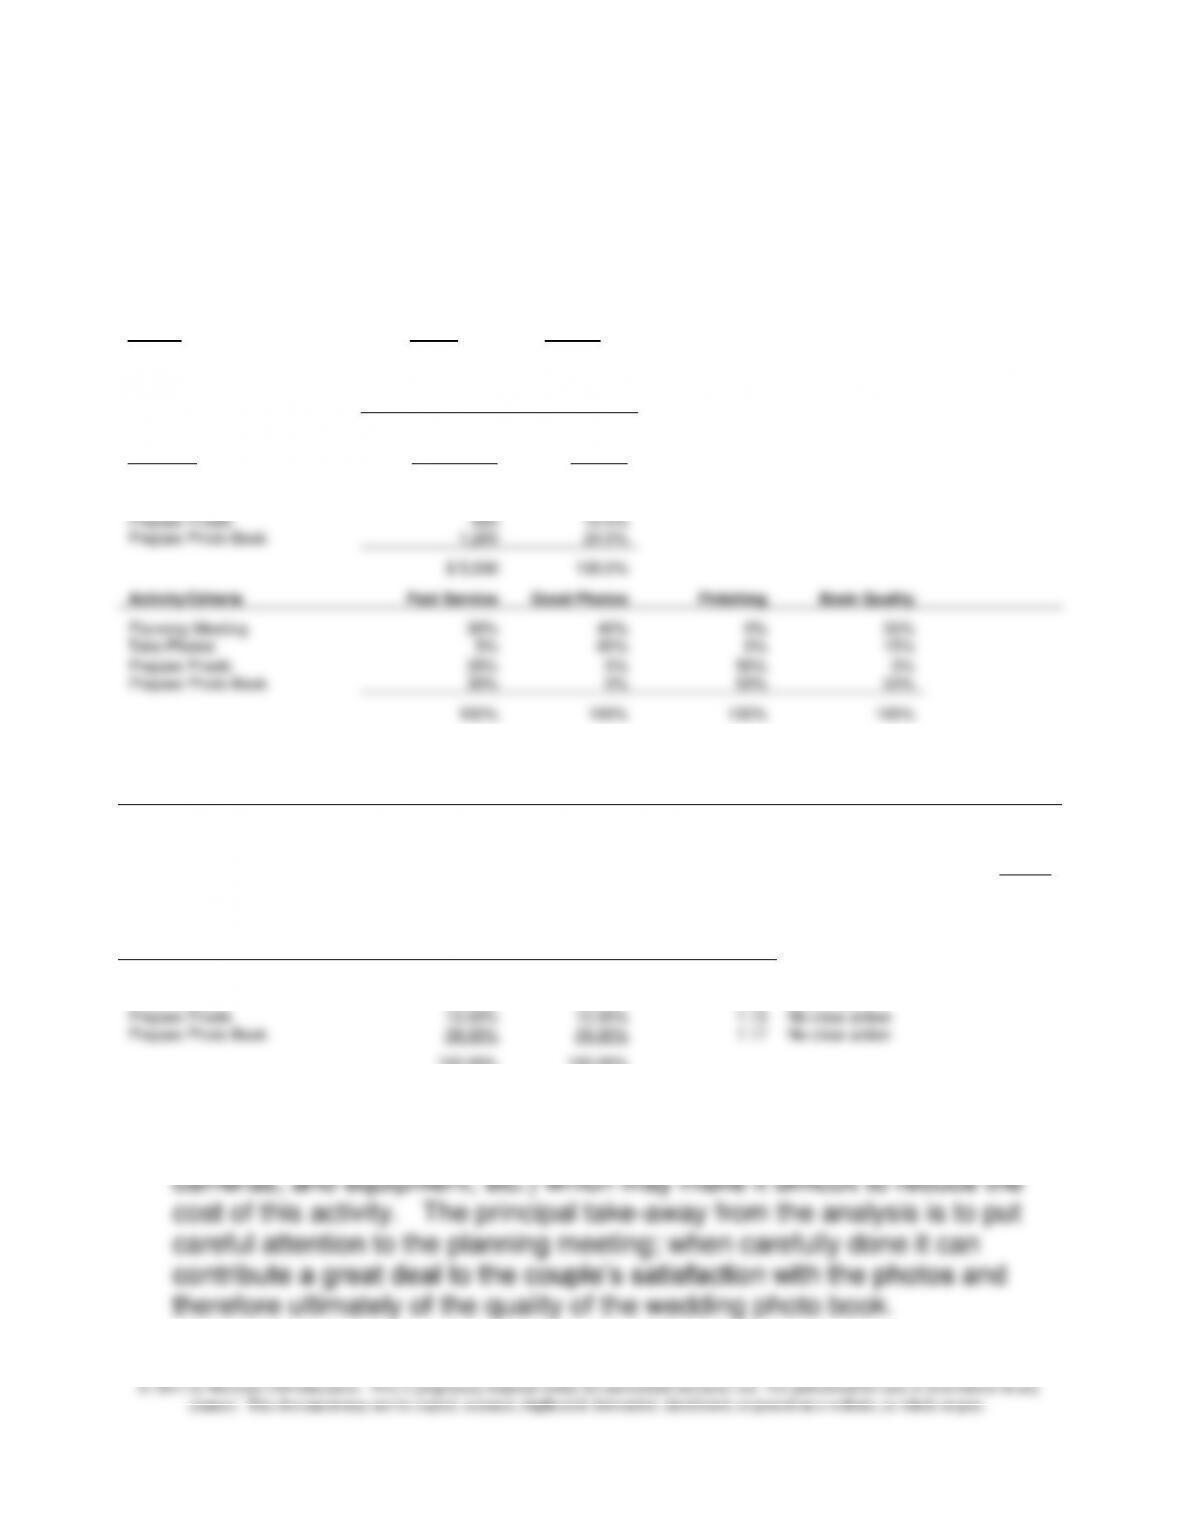
13-44 Target Costing: Quality Function Deployment
The QFD analysis shows that BPI should consider spending more time and
money on the planning meeting and less on the photography done the day
of the wedding, to put their costs more in line with the customer criteria.
Customer
Criteria
Rating
Percent
Fast Service
30
10.0%
Getting Good Photos
120
40.0%
Quality of Photo Finishing
60
20.0%
Quality of Photo Books
90
30.0%
300
100.0%
Activities
Target Cost
Percent
Planning Meeting
$ 800
16.0%
Take Photos
2,400
48.0%
Prepare Proofs
600
12.0%
Prepare Photo Book
1,200
24.0%
$ 5,000
100.0%
Activity/Criteria
Fast Service
Good Photos
Finishing
Book Quality
Planning Meeting
30%
40%
0%
35%
Take Photos
5%
60%
0%
15%
Prepare Proofs
35%
0%
50%
0%
Prepare Photo Book
30%
0%
50%
50%
100%
100%
100%
100%
Activity/Criteria
Fast Service
Good Photos
Finishing
Book Quality
Importance
Index
Criteria Value
10%
40%
20%
30%
100%
Planning Meeting
3%
16%
0%
11.5%
29.50%
Take Photos
0.5%
24%
0%
4.5%
29.00%
Prepare Proofs
3.5%
0%
10%
0%
13.50%
Prepare Photo Book
3%
0%
10%
15%
28.00%
100.00%
Comparison of Cost and Value
Importance
Index
Cost Index
Ratio
Planning Meeting
29.50%
16.00%
1.84
Spend More
Take Photos
29.00%
48.00%
0.60
Spend Less
Prepare Proofs
13.50%
12.00%
1.13
No clear action
Prepare Photo Book
28.00%
24.00%
1.17
No clear action
100.00%
100.00%
2. A limitation of the above analysis is that there are certain costs of taking
the photos on the day of the wedding (additional lighting, backup
Chapter 13 – Cost Planning for the Product Life Cycle: Target Costing, Theory of Constraints, and Strategic Pricing
13–29
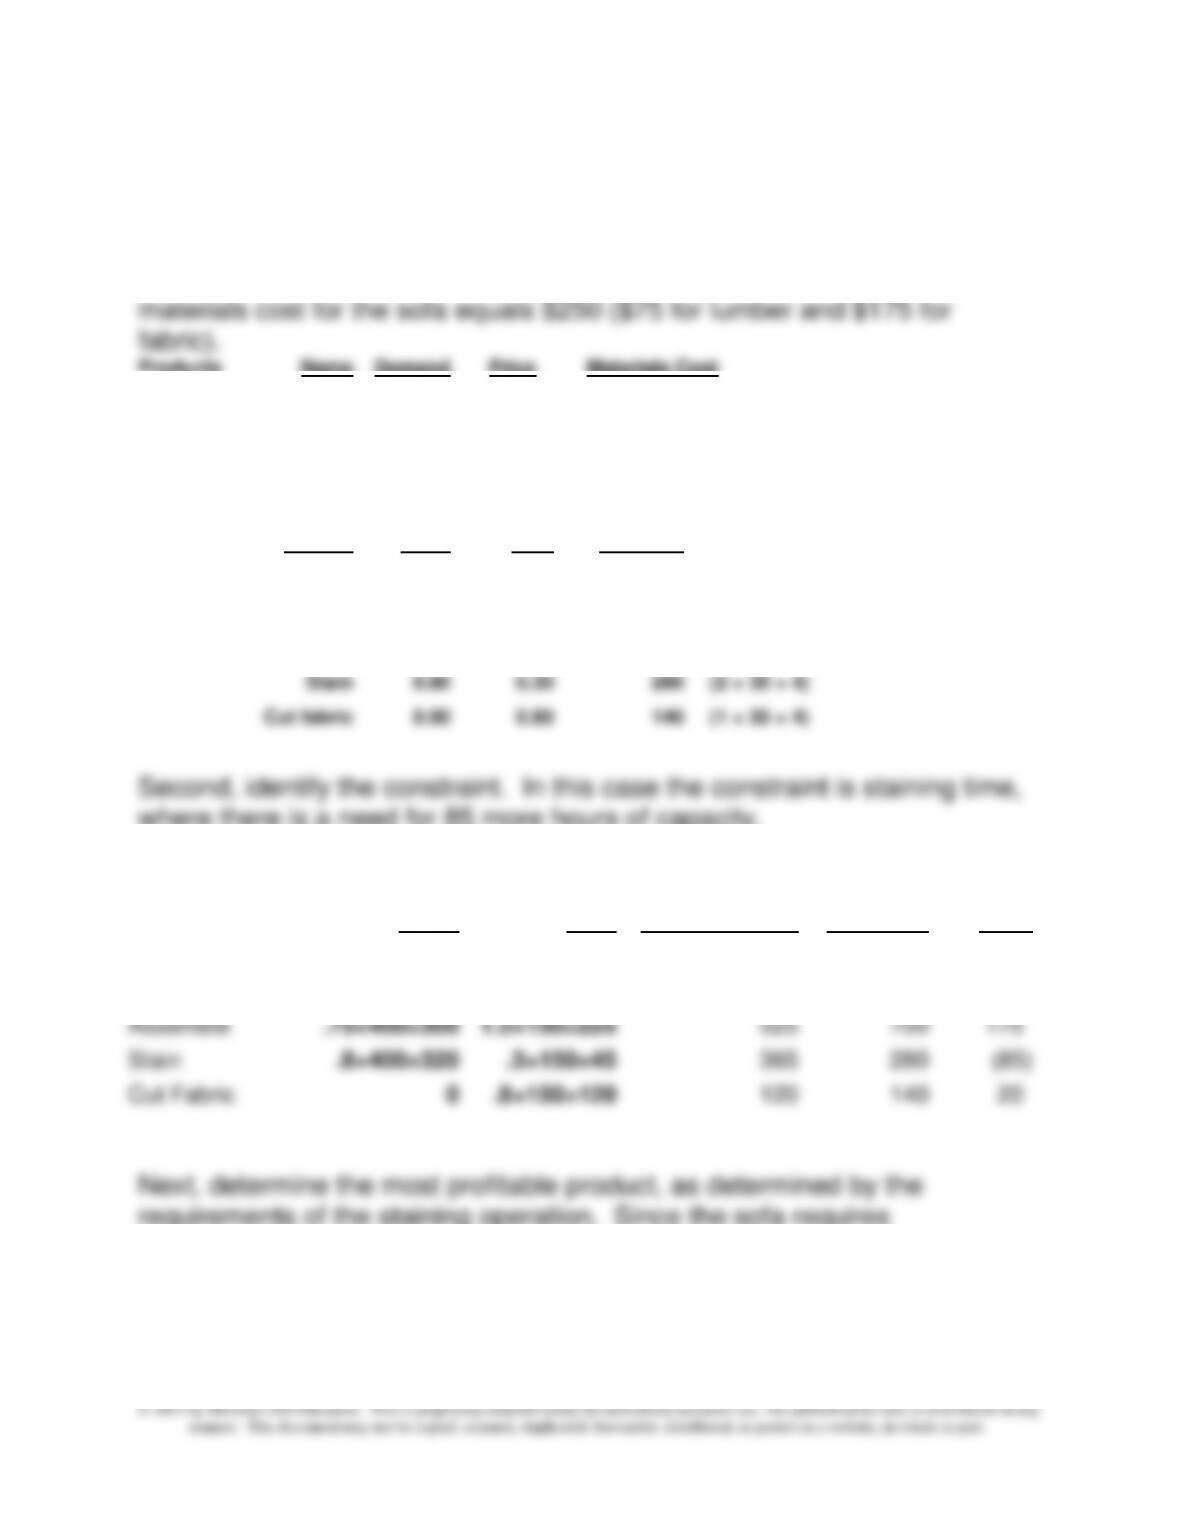
13-45 Theory of Constraints; Strategy (30 min)
First, summarize key information and obtain hours capacity in each
process. The materials cost for the table is $100 of lumber, while the
Products
Name
Demand
Price
Materials Cost
First
Table
400
$250.00
$100.00
Second
Sofa
150
$450.00
$250.00
Time Req’d for
Each Product
Time (hrs.)
Activity
Table
Sofa
Available
Cut lumber
0.50
0.20
280
(2 × 35 × 4)
Sand
0.50
0.50
280
(2 × 35 × 4)
Assemble
0.75
1.50
700
(given)
Stain
0.80
0.30
280
(2 × 35 × 4)
Cut fabric
0.00
0.80
140
(1 × 35 × 4)
where there is a need for 85 more hours of capacity.
Step Two, Part 1: Identify the Constraint
Total Time
Time
Slack
Table
Sofa
Required (hrs)
Available
Time
Cut
.5×400=200
.2×150=30
230
280
50
Sand
.5×400=200
.5×150=75
275
280
5
Assemble
.75×400=300
1.5×150=225
525
700
175
Stain
.8×400=320
.3×150=45
365
280
(85)
Cut Fabric
0
.8×150=120
120
140
20
Next, determine the most profitable product, as determined by the
requirements of the staining operation. Since the sofa requires
substantially less staining time, and because it has higher throughput, it is
the most profitable product.
Chapter 13 – Cost Planning for the Product Life Cycle: Target Costing, Theory of Constraints, and Strategic Pricing
13–30
13–45 (continued)
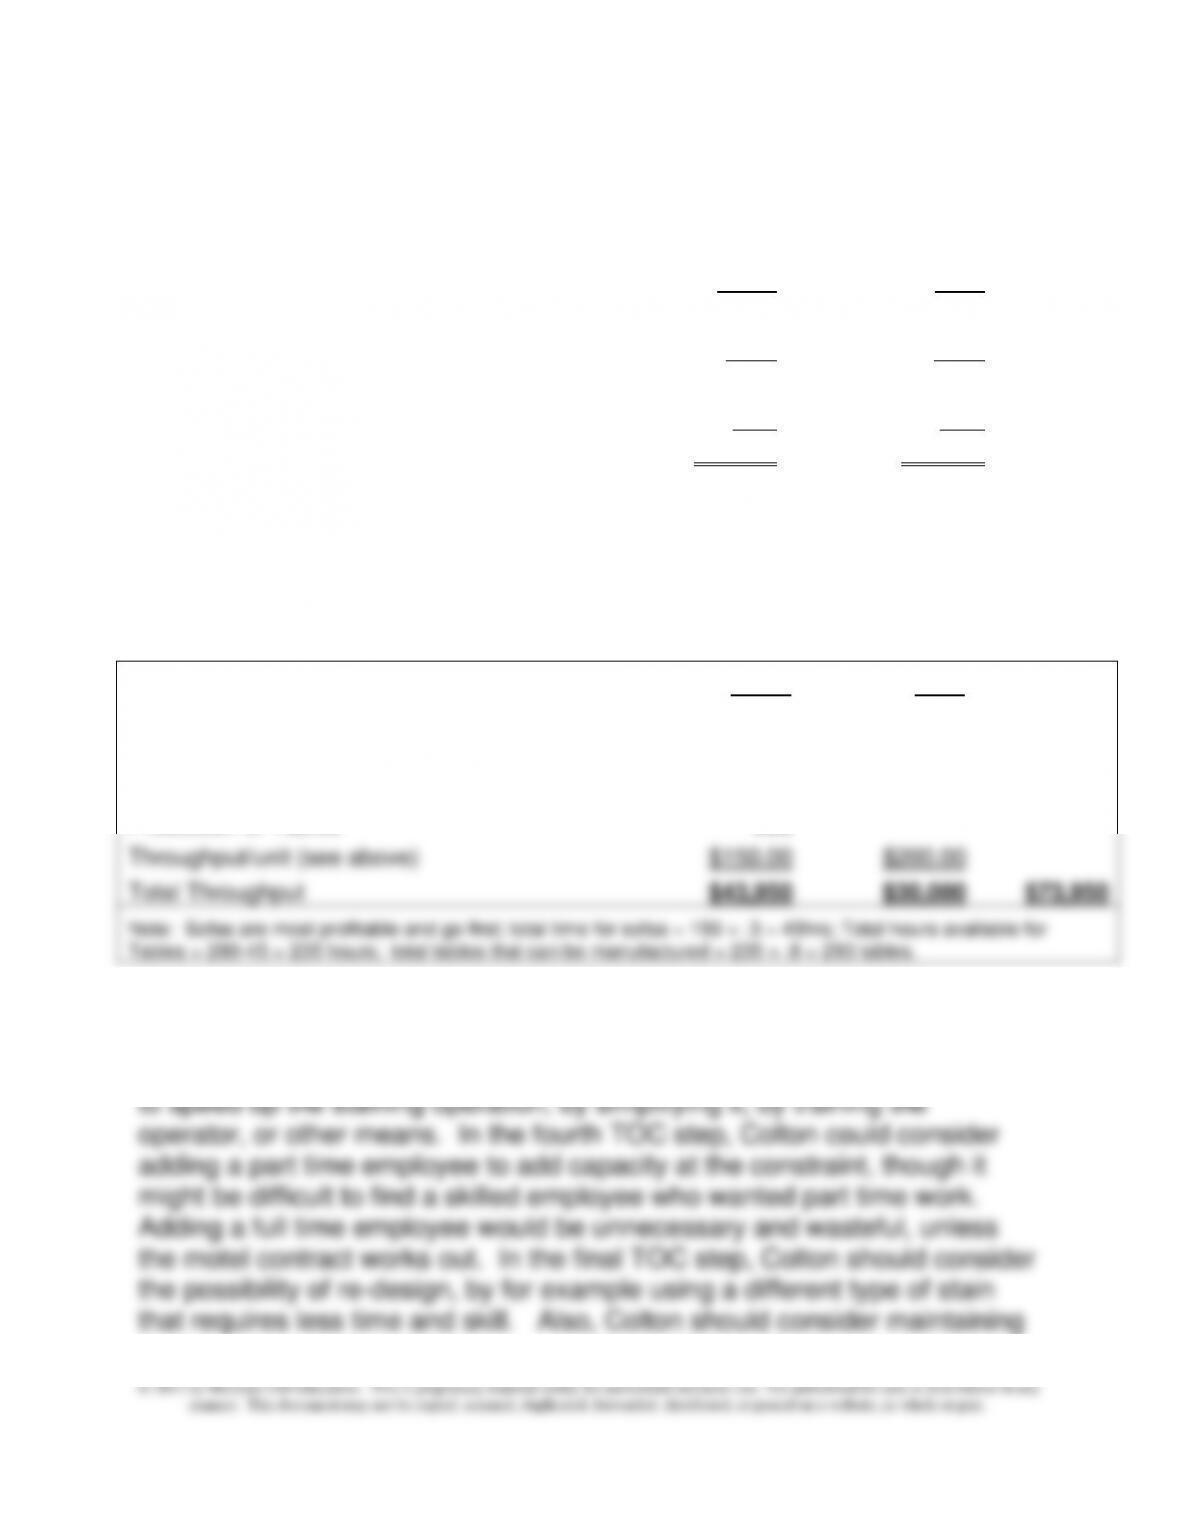
Part Two: Identify Most Profitable Product
Table
Sofa
Price
$250
$450
Materials Cost
$100
$250
Throughput Margin
$150
$200
Constraint time (staining)
0.80
0.30
Throughput/hour
$187.50
$666.67
Finally, determine the most profitable product mix. Since sofas are the
most profitable through the staining constraint, we fill the sofa demand first,
and then with the remaining staining capacity, fill as much of the table
demand as possible. See below for calculations.
Table
Sofa
Demand
400
150
Production of Sofas
150
Availability, Usage of Staining hours
235
45
280
Production of Tables
293
Throughput/unit (see above)
$150.00
$200.00
Total Throughput
$43,950
$30,000
$73,950
Note: Sofas are most profitable and go first; total time for sofas = 150 × .3 = 45hrs; Total hours available for
Tables = 280-45 = 235 hours; total tables that can be manufactured = 235 ÷ .8 = 293 tables.
2. Part one above solves the first two steps of the TOC, to identify the
constraint and determine the most profitable product mix. The third step, to
maximize flow through the constraint, would require Colton to look for ways